Hello There!

Lorem ipsum dolor sit amet, consectetur adipiscing elit,

How Anomaly Detection Safeguards Business Performance

How Anomaly Detection Safeguards Business Performance -Tatvic

Anomaly Detection is the silent guardian of your data, constantly at work behind the scenes.

Are hidden issues silently draining your business’s revenue, jeopardizing your security, or skewing your crucial data insights?

In today’s hyper-connected, data-rich world, unexpected deviations can appear anywhere from a sudden dip in website conversions to a subtle, yet dangerous, shift in network traffic.

These “anomalies,” often invisible to the naked eye, hold the key to uncovering both significant threats and untapped opportunities.

It’s a powerful discipline at the intersection of data science, AI, and machine learning, focused on identifying those rare events, observations, or data points that diverge significantly from the expected pattern.

More than just a buzzword, anomaly detection is becoming an indispensable tool for businesses aiming to stay competitive, secure, and data-driven.

In this comprehensive guide, we’ll peel back the layers of anomaly detection.

You’ll learn exactly what it is, why it’s not just a technicality but a strategic imperative for your business, its various types, how it works, and its impactful real-world applications.

We’ll also address common challenges and best practices for implementation, ultimately showing you how Tatvic empowers businesses like yours to harness this technology for smarter, safer operations.

What is Anomaly ?

An anomaly is any data point, event, or observation that significantly deviates from the normal or expected pattern within a dataset.

It’s an outlier or an irregularity that doesn’t conform to the typical behavior or trend.

These unusual occurrences can signal anything from a data error to a critical system issue, a fraudulent activity, or an unexpected but important business trend.

What Exactly is Anomaly Detection?

At its core, Anomaly Detection (also known as Outlier Detection) is the process of identifying data points or patterns that do not conform to an expected behavior.

Think of it as finding the “needle in the haystack” that one data point, or a sequence of points, that is significantly different from the vast majority of other data points.

While “normal” data often follows predictable trends and distributions, anomalies stick out because they violate these norms.

These deviations can be caused by various factors, including:

  • Errors: Data entry mistakes, sensor malfunctions.
  • Rare Events: A sudden, legitimate spike in sales due to a viral campaign.
  • Malicious Activity: Fraudulent transactions, cyber-attacks.
  • System Failures: Server crashes, network outages.

Unlike simple thresholding, which flags values above or below a fixed limit, anomaly detection often involves sophisticated algorithms that learn the “normal” baseline behavior from historical data.

This allows it to identify subtle, complex, or evolving abnormalities that a static rule might miss. It’s about understanding the context and the relationships within the data, rather than just isolated values.

What is Anomaly Detection - Tatvic

The ‘Why’: Why Anomaly Detection is Critical for Modern Businesses

In an era where data is king, overlooking anomalies is akin to leaving money on the table or an open door for threats.

Anomaly detection is not just a ‘nice-to-have’ technical capability; it’s a strategic ‘must-have’ that delivers tangible business benefits across various functions.

Importance Of Anomaly Detection In Various Business Functions:

1. Safeguarding Revenue & Preventing Fraud

Fraudulent activities, whether in financial transactions, advertising clicks, or e-commerce purchases, can lead to substantial revenue loss. Anomaly detection systems continuously monitor patterns, flagging suspicious transactions, unusual login attempts, or abnormal clickstream data that deviate from typical user behavior, allowing for rapid intervention and prevention.

2. Enhancing Operational Efficiency & Predictive Maintenance

For businesses with physical assets or complex IT infrastructures, anomalies can signal impending equipment failure or operational bottlenecks. By detecting unusual sensor readings (e.g., temperature spikes, abnormal vibrations) or unexpected latency in IT systems, companies can perform predictive maintenance, minimize downtime, and optimize operational costs, moving from reactive fixes to proactive solutions.

3. Optimizing Digital Marketing & User Experience

For Tatvic’s core audience, this is paramount.

Anomaly detection can transform digital marketing efforts:

  • Website Traffic: Identify sudden, inexplicable drops or spikes in traffic that could indicate bot activity, tracking errors, or a trending issue.
  • Conversion Rates: Pinpoint abnormal shifts in conversion rates for specific campaigns, channels, or user segments, allowing for quick A/B test adjustments or problem resolution.
  • Ad Spend & Performance: Flag unusual ad spend patterns, click fraud, or campaigns underperforming unexpectedly, ensuring budget efficiency.
  • Customer Journey: Spot deviations in user behavior sequences that might indicate frustration, confusion, or a new successful path.

4. Improving Data Quality & Accuracy

Garbage in, garbage out. Anomalies within your datasets can skew analysis, leading to incorrect conclusions and flawed strategies. Anomaly detection helps cleanse data by identifying erroneous entries, sensor glitches, or data collection issues, ensuring that your analytics and machine learning models are built on a solid foundation of reliable data.

5. Strengthening Cybersecurity & IT Operations

In the face of ever-evolving cyber threats, anomaly detection is a first line of defense. It helps identify:

  • Unusual Network Activity: Malicious intrusions, data exfiltration, or unauthorized access attempts.
  • System Performance Degradation: Subtle shifts indicating a server overload or an application issue before it escalates.
  • Insider Threats: Employee behaviors that deviate from their normal work patterns.

6. Gaining Competitive Advantage

By proactively identifying and addressing issues, optimizing performance, and preventing losses, businesses leveraging anomaly detection gain a significant edge. They can react faster to market changes, maintain higher levels of service quality, and make data-driven decisions with greater confidence.

What Are The Types of Anomalies? Understanding the Deviations

Not all anomalies are created equal.

Understanding the different types helps in selecting the most appropriate detection methods and interpreting their significance.

Let’s Explore Different Types Of Anomalies:

1. Point Anomalies (Outliers)

These are single data instances that deviate significantly from the rest of the dataset.

  • Example: A credit card transaction of $10,000 in an account where the average transaction is $50.
  • Example in Marketing: A single blog post suddenly receiving 10x its usual traffic for no apparent reason, or a single day with 0 conversions on an otherwise active e-commerce site.

2. Contextual Anomalies

A data instance is anomalous only in a specific context. It might be normal in a different context.

  • Example: A temperature of 30°C in a server room is normal during summer but highly anomalous in winter.
  • Example in Marketing: A spike in website traffic at 2 AM is normal for a global product launch, but anomalous for a local business on a typical weekday.

3. Collective Anomalies

A collection of related data instances that collectively behave anomalously, even if individual data points within the collection are not anomalous.

  • Example: A gradual, sustained decrease in network bandwidth over several hours, which individually might seem small, but collectively indicates a problem.
  • Example in Marketing: A consistent, but slight, drop in session duration across multiple pages over a week, signaling potential user frustration that isn’t evident from individual page metrics.

How Anomaly Detection Works: Methods & Techniques

The core idea behind anomaly detection is to build a model of “normal” behavior and then identify instances that deviate significantly from this model.

The methodologies employed can range from simple statistical rules to complex machine learning algorithms.

1. Overview of the Process:

  1. Data Collection: Gathering relevant data streams (e.g., logs, sensor data, transaction records, website analytics).
  2. Data Preprocessing: Cleaning, normalizing, and transforming data to suit the chosen method.
  3. Model Training: Teaching the algorithm what “normal” looks like based on historical data.
  4. Anomaly Scoring/Classification: Assigning an anomaly score to new data points or classifying them as normal/anomalous.
  5. Alerting & Action: Notifying relevant personnel or triggering automated responses when anomalies are detected.

2. Statistical Methods

These are often the simplest forms, suitable for data with clear statistical properties.

  • Z-score/Standard Deviation: Identifies data points that are a certain number of standard deviations away from the mean.
  • Interquartile Range (IQR): Flags values outside a certain range based on quartiles, robust to outliers.
  • Gaussian Models: Assumes data follows a normal distribution and flags points with low probability under this distribution.

3. Machine Learning Approaches

These are more sophisticated and can learn complex, non-linear relationships, making them suitable for high-dimensional or complex data.

  • Clustering-based: Algorithms like K-means or DBSCAN group similar data points together. Anomalies are data points that fall outside these clusters or form very small, isolated clusters.
  • Classification-based: Training a classifier (e.g., One-Class SVM) on “normal” data. Any new data point not classified as normal is an anomaly.
  • Proximity-based: Methods like Isolation Forest or Local Outlier Factor (LOF) identify anomalies by how “isolated” or how different they are from their neighbors.
  • Deep Learning: Neural networks like Autoencoders can learn compressed representations of normal data. Data points that reconstruct poorly (high reconstruction error) are considered anomalous.

4 Time Series Specific Methods

When dealing with sequential data (like website traffic or server logs), specialized methods account for temporal dependencies.

  • ARIMA (Autoregressive Integrated Moving Average): Models past values to predict future ones, flagging significant deviations from predictions.
  • Prophet (Facebook): Designed for forecasting time series data with trends, seasonality, and holidays, useful for detecting anomalies against a predicted baseline.

Anomaly Detection Method (Practical Approach)

Machine learning is useful to learn the characteristics of the system from observed data.

Common anomaly detection methods on time series data learn the parameters of the data distribution in windows over time and identify anomalies as data points that have a low probability of being generated from that distribution.

Another class of methods include sequential hypothesis tests like cumulative sum (CUSUM) charts, sequential probability ratio test (SPRT) etc., which can identify certain types of changes in the distributions of real-time data. All these methods use some predefined thresholds to alert to changes in the distributions of time series data.

At their core, all methods test if the sequence of values in a time series is consistent to have been generated from an i.i.d (independent and identically distributed) process.

This approach becomes infeasible and impractical for environments and infrastructures which are complex and of extremely large scale. As the complexity increases, fixed thresholds can’t adapt to the volume of data changing over time.

At Tatvic, we define anomaly detection as the identification of data points which deviate from normal and expected behaviour.

For example, in our system, we use historical data to construct a quantitative representation of data distribution exhibited by each metric being monitored.

Real-time data points are compared against these quantitative representations and are assigned a score.

A decision is made on whether the real-time data point is an anomaly or not, based on a threshold we derive from recent observations of the data. One of the key advantages of this approach is that the thresholds are not static, but rather, evolve with data.

Anomaly Dectection Time Series - Tatvic

Let me simplify further with an example of a website traffic data pattern. Tatvic’s solution starts with collecting the website’s behavioural data.

Three primary components of trend, namely fixed trends, cyclical trends, and seasonal data are measured individually and aggregated.

The system collects behavioural and conversion data with Google Analytics 360 and uses the Real Time Management APIs to export relevant metrics into a separate database.

Then, the algorithm looks for unexpected changes in the data and sends automated real-time alerts to concerned users using an SMS API and email server.

Some of the meticulously tracked metrics could be online-form completion rates, goal conversion rates, and page-loading time for specific browsers and operating systems.

This solution is built using R - a popular, robust and free programming language - for statistical computing and visualization.

Google Analytics 360 data can be exported into R for advanced analysis through the RGoogleAnalytics Library.

With this, Tatvic can decouple data between trends and seasonality as shown below.

Anomaly detection machine learning - Tatvic

Real-World Applications & Industry Use Cases

Anomaly detection isn’t confined to a single industry; its versatility makes it invaluable across diverse sectors:

1. Digital Marketing & Analytics (Tatvic’s Expertise!)

  • Traffic Anomalies: Sudden, unexplained spikes in bot traffic, or drops in organic search volume for key terms.
  • Conversion Rate Drops: Unexpected dips in checkout conversion rates, form submissions, or lead generation.
  • Campaign Performance: Ad campaigns showing unusually high click-through rates (potential click fraud) or abnormally low return on ad spend.
  • A/B Test Monitoring: Detecting if an A/B test is producing anomalous results that might indicate a technical issue rather than a genuine user preference.
  • Customer Journey Analysis: Identifying unusual navigation paths that might indicate user frustration or new, unexpected success funnels.

2. Financial Services & Fraud Detection

  • Credit card fraud, money laundering, insurance claim fraud, insider trading detection.
  • Example: A bank flagging a series of small, rapid transactions in an unusual location, followed by a large withdrawal.

3. IT Operations & Network Security

  • Network intrusions, denial-of-service (DoS) attacks, unusual access patterns, server performance degradation.
  • Example: An IT team identifying an employee logging in from an unfamiliar country at an odd hour.

4. Manufacturing & IoT

  • Predictive maintenance for machinery, quality control defect detection, supply chain disruptions.
  • Example: Sensors on a factory machine detecting abnormal vibrations or temperature, signaling a potential breakdown before it occurs.

5. Healthcare

  • Patient vital sign monitoring, disease outbreak detection, medical insurance fraud.
  • Example: An automated system alerting doctors to a sudden, inexplicable change in a patient’s heart rate patterns.

Anomaly Detection Case Study!

Magicbricks is India’s top high-end property portal. The website caters to a global market with its unique services and novel online features for both- buyers and sellers.

Given their commitment to user experience and performance across their site’s global operations, they needed a real-time solution to monitor and optimize against their key digital KPIs.

Tatvic helped the company to develop a way to reduce website downtime and promptly alert management when outages would occur.

Using our real-time anomaly alerts platform, the company could clearly see variances in KPIs and move quickly to troubleshoot and fix them.

One day, the page leads generated reduced below the threshold limit and this triggered alerts and an email was immediately sent to the relevant team to take corrective steps on the same day; otherwise, probably a substantial chunk of leads would have been lost.

Result: 70% faster response time

The automated SMS alert system is used to alert outages, determine severity, and provide real-time performance updates to senior and middle managers throughout Magicbricks.

Today, the entire Magicbricks team can make the most of these real-time insights to keep the site up and running and earning more every day.

The full story of anomaly detection for Magicbricks can be found on the Google Analytics blog 👉 here.

Overcoming Challenges in Anomaly Detection

While powerful, implementing anomaly detection is not without its hurdles:

  • Defining ‘Normal’ is Hard:

    What constitutes “normal” can be highly subjective, dynamic, and evolve over time, making it challenging to build robust models.

  • Data Scarcity for Anomalies:

    Anomalies are rare by definition. This scarcity makes it difficult to train models that accurately recognize them, leading to imbalanced datasets.

  • High Dimensionality:

    Modern datasets often have hundreds or thousands of features (dimensions), making it harder to discern patterns and spot anomalies.

  • Evolving Patterns:

    What was normal last month might be anomalous today, and vice-versa. Models need to adapt to concept drift.

  • False Positives/Negatives:

    Overly sensitive models can flood you with false alarms (false positives), leading to alert fatigue. Under-sensitive models might miss critical anomalies (false negatives).

  • Interpretability:

    Understanding why an anomaly was flagged can be challenging, especially with complex deep learning models, making it hard to take targeted action.

Implementing Anomaly Detection: Best Practices for Success

To maximize the effectiveness of your anomaly detection efforts, consider these best practices:

  • Start with Clear Objectives:

    Define what you want to achieve. Are you preventing fraud, optimizing marketing spend, or predicting system failures? Clear goals guide your data collection and model selection.

  • Ensure Data Quality & Preprocessing:

    Clean, consistent, and relevant data is foundational. This includes handling missing values, normalizing features, and feature engineering.

  • Select the Right Algorithm:

    There’s no one-size-fits-all. The best method depends on your data type (time series, categorical, numerical), the nature of anomalies, and your specific problem.

  • Continuous Monitoring & Feedback Loops:

    Anomaly detection models are not set-it-and-forget-it solutions. Regularly monitor their performance, update models with new data, and incorporate human feedback to refine accuracy.

  • Integrate with Existing Systems:

    To make anomaly detection actionable, integrate it with your alerting systems (e.g., Slack, email), dashboards (e.g., Google Looker Studio, Power BI), and operational tools.

  • Start Simple, Then Scale:

    Begin with simpler methods and gradually move to more complex ones as your understanding of the data and problem deepens.

  • Focus on Actionable Insights:

    The goal isn’t just to find anomalies, but to act on them. Ensure your system provides enough context for teams to understand and address the flagged issues.

How Tatvic Empowers Businesses with Anomaly Detection

At Tatvic, we understand that true business intelligence comes from not just seeing the data, but understanding the subtle shifts that impact your bottom line.

We move beyond generic tools, offering tailored Anomaly Detection solutions that integrate seamlessly with your existing data ecosystem.

Tatvic’s Approach To Empower Businesses with Anomaly Detection:

  • Custom Model Development:

    Leveraging our expertise in AI and Machine Learning, we build bespoke anomaly detection models tuned to your specific business needs, data types, and operational context. Whether it’s detecting fraudulent transactions in finance or pinpointing unusual customer behavior in e-commerce, our solutions are purpose-built.

  • Integration with Leading Analytics Platforms:

    We seamlessly integrate anomaly detection capabilities with your existing tools, including Google Analytics 4, Adobe Analytics, Google BigQuery, and other cloud data platforms. This means you get real-time alerts and insights directly within your familiar dashboards.

  • Proactive Alerting & Visualization:

    Beyond just detection, we focus on making anomalies actionable. We design intuitive dashboards and automated alerting systems that notify the right teams instantly, providing context and severity assessments to enable rapid response.

  • Data Health Monitoring:

    Our solutions help you maintain high data quality, identifying inconsistencies or errors that could skew your analytics and impact business decisions.

  • Fraud & Security Optimization:

    For digital marketing, we implement sophisticated models to identify and mitigate various forms of ad fraud, click fraud, and unusual user behavior, protecting your marketing spend and brand reputation.

  • End-to-End Implementation & Support:

    From initial data assessment and model training to deployment, monitoring, and ongoing refinement, Tatvic provides comprehensive support, ensuring you maximize the value of anomaly detection without heavy internal resource allocation.

Success Story Snippet: Imagine a leading e-commerce client who was struggling with unexplained drops in conversion rates during peak seasons. Tatvic implemented a real-time anomaly detection system that identified specific product categories experiencing unusual traffic sources and checkout flow errors, enabling the client to rectify issues within hours, preventing significant revenue loss.

The Future of Anomaly Detection

The field of anomaly detection is constantly evolving, driven by advancements in AI and the increasing complexity of data.

Anomaly Detection Key trends to watch :

  • Real-time Detection at Scale:

    The ability to detect anomalies instantaneously across massive, streaming datasets will become standard.

  • Explainable AI (XAI):

    As models become more complex, XAI will be crucial to provide human-understandable explanations for why an anomaly was flagged, fostering trust and enabling quicker action.

  • Automated Anomaly Resolution:

    Moving beyond just alerting, future systems may suggest or even initiate automated responses to certain types of anomalies.

  • Multi-Modal Anomaly Detection:

    Integrating data from various sources (e.g., text, images, sensor data, time series) to detect more complex, holistic anomalies.

Conclusion

In a world drowning in data, anomaly detection emerges as a lifeline transforming raw data into actionable intelligence.

It’s the silent guardian protecting your business from unseen threats and the intelligent guide revealing paths to untapped growth.

By identifying the unusual, you gain unparalleled insights into your operations, security, and customer behavior.

Don’t let hidden anomalies erode your profits or jeopardize your reputation.

Partner with Tatvic, and leverage our expertise in advanced analytics and machine learning to build robust anomaly detection capabilities tailored to your unique business challenges.

Transform your data into your most powerful defense and a dynamic engine for growth.

Ready to uncover hidden insights and protect your business?
👉 Contact Tatvic today for a consultation on implementing cutting-edge Anomaly Detection solutions.
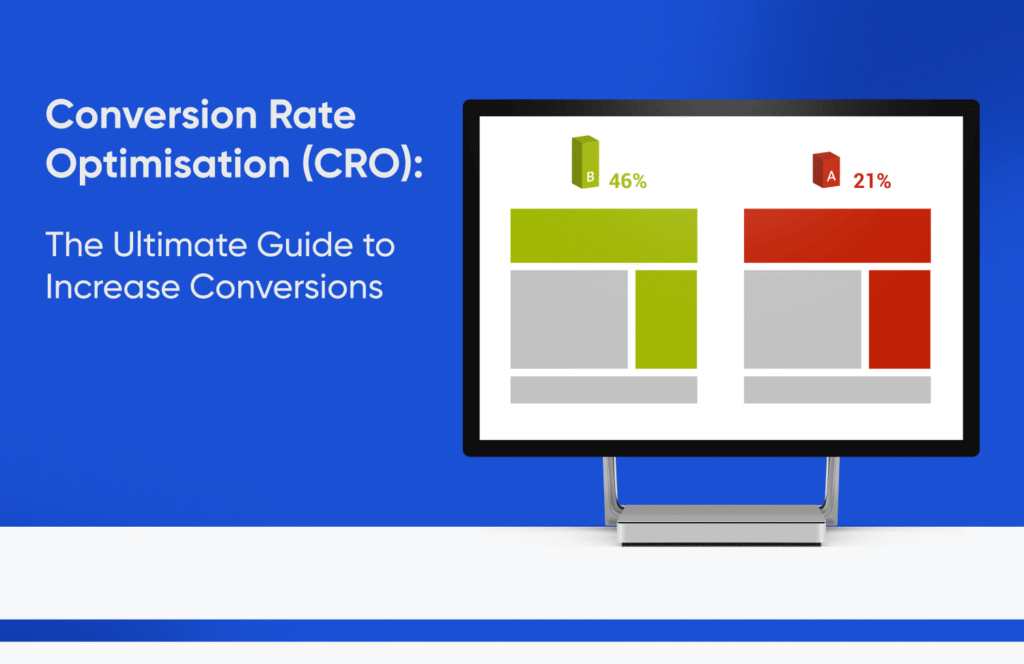
 

Conversion Rate Optimisation (CRO): The Ultimate Guide to Increase Conversions in 2025 & Beyond

Conversion Rate Optimisation (CRO) - The Ultimate Guide to Increase Conversions

In today’s digital-first world, simply driving traffic to your website isn’t enough. Conversion Rate Optimisation (CRO) is the science and art of turning that traffic into actual results, whether that’s a purchase, a sign-up, a lead, or any other measurable business goal.

Put simply, CRO is the process of improving your website or digital experience to increase the percentage of users who take a desired action. It goes beyond flashy design and A/B testing. It’s about understanding user behavior, eliminating friction, and delivering a seamless, persuasive journey that encourages conversion.

Why Conversion Rate Optimisation (CRO) Matters More Than Ever in 2025?

In 2025, CRO isn’t just a “nice-to-have”, it’s a mission-critical function for any digital business.

Conversion Rate Optimisation (CRO) has evolved from a tactical experiment to a strategic growth engine.

With rising customer acquisition costs, increased competition and AI reshaping user expectations, CRO is now essential for maximizing ROI, improving user journeys and sustaining profitability in a privacy-first digital era.

Here’s why:

  • Rising Acquisition Costs (CAC): Paid media is becoming more expensive across all platforms. Brands are spending more than ever to bring users in making it vital to maximize ROI from every visitor.
  • AI-Driven Personalization: With the rise of Agentic AI, machine learning, and real-time data, users now expect hyper-personalized experiences. CRO has evolved to incorporate AI-powered journey optimization that dynamically adjusts to user intent.
  • Shorter Attention Spans: Users bounce faster and decide quicker. Your website has mere seconds to impress, convince, and convert.
  • Privacy-First Digital Landscape: With third-party cookies on their way out, first-party behavioral insights gained through CRO have become a key competitive advantage.

Simply put, Conversion Rate Optimisation (CRO) is your growth multiplier.

It doesn’t just improve conversions, it drives smarter decision-making, improves user experience, and increases revenue without increasing ad spend.

What You’ll Learn in This CRO Guide?

This is not an average CRO article.

Whether you’re a CMO, growth marketer, performance expert or a founder looking to improve your digital ROI, this 2025-ready guide will give you:

  • A complete understanding of what conversion rate optimisation means and how it works
  • A detailed breakdown of CRO strategies, tools, and techniques that deliver results
  • The role of Agentic AI and automation in modern CRO
  • Industry-specific conversion benchmarks and real case studies
  • Common CRO mistakes and how to avoid them
  • Proven frameworks to build and scale your CRO program in 2025 and beyond

CRO is no longer a standalone task, it’s the foundation of all effective digital marketing. Throughout this guide, we’ll show you how to integrate CRO into your SEO, paid media, UX, and AI strategies for sustainable and scalable growth.

So, Let’s Deep dive Into It >>>

What is Conversion Rate Optimisation (CRO)?

Conversion Rate Optimisation Explained

Conversion Rate Optimisation (CRO) is the systematic process of increasing the percentage of website or app visitors who take a desired action, such as making a purchase, filling out a form, signing up for a newsletter or engaging with key on-page elements.

In simpler terms, CRO is all about making your digital experience more persuasive, more intuitive  and more efficient so that more users convert without needing to increase your traffic or ad spend.

The “CONVERSION” can vary based on business goals:

  • For ecommerce, it could be a Completed Purchase
  • For B2B, it might be a Demo Request or Lead Submission
  • For apps, it could mean a Successful Signup or Retention Milestone

In 2025, with shrinking attention spans and rising costs of customer acquisition, CRO is no longer just about tweaking buttons or headlines, it’s about deeply understanding user intent, behavior  friction, and removing barriers to action with precision and personalization.

A Brief History of Conversion Rate Optimisation (CRO)

To understand the power and potential of CRO today, it’s helpful to see how far it has come.

From humble beginnings as simple page tweaks to its current role as an AI-driven growth engine, CRO has continuously evolved alongside technology and user behavior.

Here’s a quick timeline and transformations of Conversion Rate Optimisation so far:

  • Early 2000s: CRO was rudimentary, mostly focused on split testing headlines, landing pages and calls to action.
  • 2010-2015: As analytics tools matured, marketers began using behavioral data (like heatmaps and funnel drop-offs) to inform experiments.
  • 2016-2020: CRO became more strategic. Frameworks, user research and experimentation platforms (like Optimizely, VWO) gained popularity.
  • 2021-2024: The rise of AI, machine learning and no-code tools enabled personalization at scale, while privacy regulations shifted focus to first-party behavioral data.
  • 2025: CRO has now evolved into a hybrid discipline, powered by Agentic AI. It is now integrated across SEO, UX, content and analytics and sits at the heart of any high-performing digital marketing funnel.

How to Calculate Conversion Rate?

Conversion rate is the percentage of visitors who complete a desired action on your website, such as making a purchase, filling out a form, or downloading an app.

A higher conversion rate means your site is effectively turning traffic into tangible business outcomes. In 2025, tracking conversion rate is more important than ever due to rising acquisition costs and evolving user expectations.

The CRO Formula (Simple Yet Powerful)

The conversion rate formula is straightforward: It’s calculated by dividing the number of conversions by the total number of visitors, then multiplying by 100.

Conversion Rate (%) = (Total Conversions ÷ Total Visitors) × 100

For example, if your website had 5,000 visitors last month and 250 completed a purchase, your conversion rate is:

(250 ÷ 5,000) × 100 = 5%

This simple formula is the foundation of CRO analytics whether you’re optimizing ecommerce purchases, form fills, demo signups or app installs.

Primary vs Secondary Conversions

Not all conversions are created equal.

In modern CRO, we differentiate between:

  • Primary Conversions: These are your core business goals (e.g., purchases, subscriptions, demo bookings).
  • Secondary Conversions: Supporting actions that indicate engagement (e.g., newsletter signups, video views, adding to cart).

Tracking both gives a complete picture of user intent, enabling smarter optimization strategies.

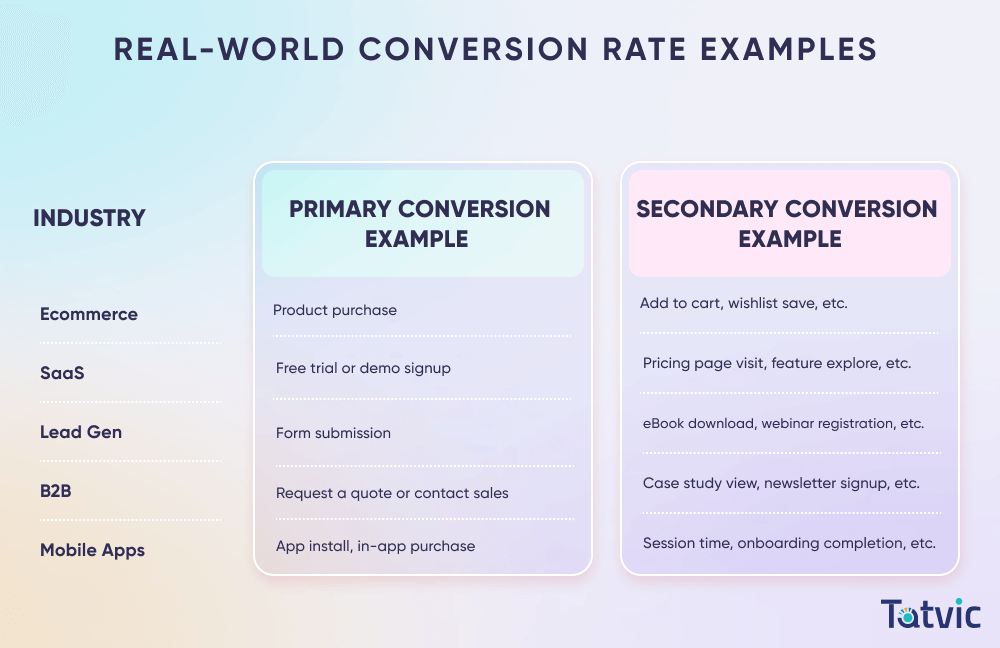
Real-World Conversion Rate Examples

Here’s how conversion rate optimisation plays out across different industries:

Real-World Conversion Rate Examples

Tip: Use tools like GA4, Mixpanel, or Amplitude to track micro and macro conversions across the entire user journey.

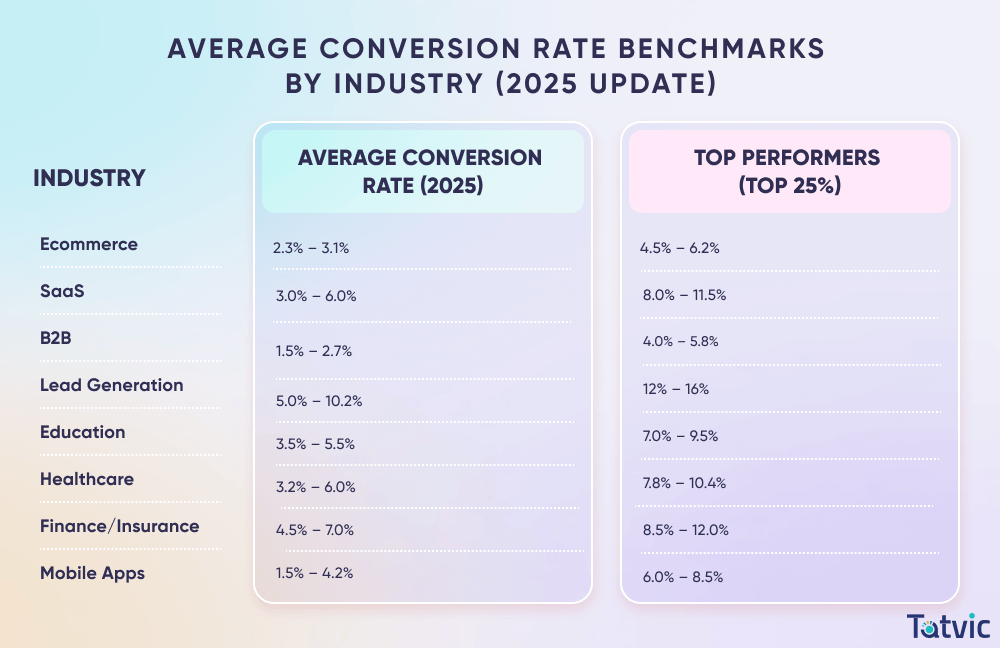
Average Conversion Rate Benchmarks by Industry (2025 Update)

Knowing how your site performs against industry benchmarks helps identify opportunities and gaps in your CRO efforts.

Understanding conversion rate benchmarks by industry is essential for setting realistic goals, identifying gaps, and making informed decisions in your CRO strategy. While benchmarks aren’t universal targets, they provide valuable directional insight especially in a year like 2025 where AI, personalization, and privacy-first design have reshaped digital behavior.

Based on 2025 data trends and reports from platforms like HubSpot, Shopify and Statista, here are the latest average conversion rates:

Average Conversion Rate Benchmarks by Industry (2025 Update)

Note: These are global averages. Your ideal benchmark may vary based on audience type, traffic sources, and industry vertical.

What Influences Average Conversion Rate?

  • Traffic quality: Not all visitors have equal intent.
  • UX and performance: Speed, mobile responsiveness, and intuitive design matter.
  • Offer relevance: A compelling value proposition improves conversions.
  • Personalization: In 2025, real-time, AI-powered personalization is a conversion game-changer.

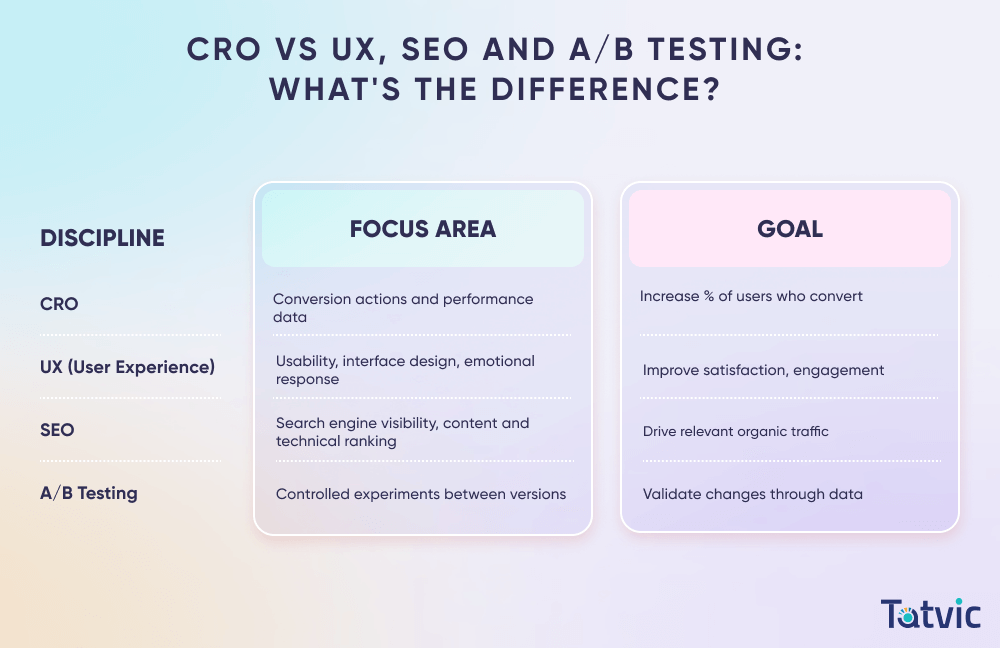
CRO vs UX, SEO and A/B Testing: What’s the Difference?

While often used interchangeably, CRO, UX, SEO, and A/B testing each serve distinct purposes in digital strategy. Understanding how they differ-and how they complement each other-is crucial for building a cohesive, high-performing marketing ecosystem. Below is a quick breakdown to help you see where CRO fits in the bigger picture.

Let’s see the comparison of CRO vs UX, SEO and A/B Testing

CRO vs UX, SEO and AB Testing

While CRO often overlaps with these disciplines, it uniquely focuses on outcomes, turning intent into action.

For example: SEO gets the user to the page, UX ensures it feels good, but CRO ensures the user actually takes the desired step

How CRO Fits into the 2025 Digital Marketing Funnel

The modern funnel is no longer linear, it’s fluid, multi-device and influenced by dozens of micro-moments.

In this complex journey, CRO acts as the “glue” that:

  • Aligns user intent with business goals
  • Personalizes the journey in real time using behavioral and contextual signals
  • Removes friction across devices and touchpoints
  • Ensures every visitor is nudged toward a conversion, regardless of entry point

In 2025, successful brands are integrating CRO across SEO landing pages, paid ad campaigns, email flows and even chatbot conversations, all optimized dynamically through AI and predictive behavior modeling.

CRO is no longer just about tweaking, it’s about transforming how users experience and interact with your brand.

CRO is the conversion engine of modern digital marketing which is deeply data-driven, AI-augmented and essential for growth in a crowded, fast-evolving digital economy.

Why Conversion Rate Optimisation (CRO) is Essential ?

Conversion Rate Optimisation (CRO) is essential in 2025 and beyond because it empowers businesses to maximize value from existing traffic, reduce dependency on rising ad costs, and adapt to fast-changing user behavior.

In a world driven by AI, personalization, and privacy-first marketing, CRO is the key to sustainable, scalable digital growth.

Let’s See Why CRO is Actually Essential in 2025 & Beyond

1. The Impact of Rising Customer Acquisition Costs (CAC)

In 2025, Customer Acquisition Costs (CAC) are at an all-time high-driven by intense ad competition, stricter data privacy laws, and saturated digital channels.

Platforms like Google and Meta have increased CPMs and CPCs, while third-party data targeting has become less effective.

As a result, businesses can no longer afford to rely solely on traffic growth to drive revenue. Instead, maximizing the value of existing traffic through Conversion Rate Optimisation (CRO) has become the most cost-efficient path to growth.

CRO importance in 2025: It’s the difference between scaling profitably or burning budgets.

2. User Impatience and Attention Scarcity

Today’s digital consumers are more distracted, decisive, and demanding than ever. Studies in 2025 show that users decide within 3-5 seconds whether to stay on a page or bounce. Long forms, poor UX, slow-loading pages, or irrelevant messaging now result in instant abandonment.

CRO tackles this head-on by:

  • Streamlining user journeys

  • Reducing cognitive friction

  • Delivering the right message at the right moment

This makes CRO a critical layer of defense against bounce rates and a powerful driver of user satisfaction.

3. Role of AI/ML and Agentic AI in Hyper-Personalization

In 2025, CRO has entered a new era powered by AI, ML and agentic AI frameworks.

Traditional optimization relied on manual A/B testing and generalized hypotheses. But now, AI models can:

  • Predict user intent in real-time
  • Auto-personalize CTAs, page layouts, and product recommendations
  • Adapt conversion paths based on behavioral signals and historical data

Agentic AI takes it further by autonomously testing, learning, and optimizing without human prompt ushering in an age of “self-improving” experiences.

AI in conversion optimization means brands can now deliver 1:1 personalized experiences at scale, improving both conversion rates and customer satisfaction.

4. CRO as a Revenue and Profitability Driver Not Just a Tactic

Gone are the days when CRO was seen as a siloed tactic for the marketing team.

In 2025, top-performing organizations view CRO as:

  • A core revenue function
  • A strategic enabler of sustainable growth
  • A bridge between data, creativity, and business outcomes

Whether it’s improving funnel efficiency, lowering CAC, boosting LTV or increasing repeat purchases, CRO delivers measurable impact on the bottom line.

When aligned with broader business goals, CRO becomes a profit multiplier, not just a series of isolated tests.

In the high-stakes, AI-driven, privacy-aware digital world of 2025, CRO is no longer optional. It’s a mission-critical investment for brands that want to grow smarter, not just harder.

Key Elements of a Conversion Rate Optimisation (CRO) Strategy (2025 Edition)

A winning Conversion Rate Optimisation (CRO) strategy goes beyond just A/B testing, it’s a holistic, AI-powered approach that blends psychology, data and design.

From landing page optimization to real-time personalization, every element is engineered to remove friction and guide users toward conversion.

With rising acquisition costs and shrinking attention spans, CRO is now a strategic revenue growth engine, not just a marketing tactic.

Let’s Deep Dive Into Key Elements of a Conversion Rate Optimisation (CRO) Strategy

1. Landing Page Optimization

Your landing page is often the first and only chance to convert a visitor. In 2025, CRO-driven landing pages are clean, mobile-first, AI-personalized, and laser-focused on one conversion goal. Key elements include a compelling headline, scannable content, trust indicators (like reviews or guarantees), and visual hierarchy that directs attention toward the CTA. Tools like Unbounce, Instapage, and Framer AI are frequently used to test and optimize these experiences.

2. A/B and Multivariate Testing

Testing remains the backbone of CRO strategies.

  • A/B testing compares two versions of a page or element (like a CTA button) to determine which performs better.
  • Multivariate testing (MVT) evaluates multiple changes across different combinations simultaneously.

In 2025, platforms like Google Optimize 360, VWO and Adobe Target leverage AI to auto-prioritize winning variations faster, helping marketers continuously improve conversion rates with data-driven insights.

3. User Journey Mapping

Understanding the complete customer journey-from ad click to final action-is crucial. CRO professionals use journey mapping to uncover friction points, abandonment zones, and opportunities for persuasion. In 2025, this process is enriched by tools like FullStory, Hotjar, and GA4, which provide real-time behavioral insights, scroll-depth tracking, rage click detection, and heatmaps that decode intent.

4. Call-to-Action (CTA) Design

A strong CTA is clear, visible, and psychologically persuasive. Modern CRO focuses not just on the color or placement but also on the context in which the CTA appears. In 2025, successful CTAs often leverage AI-triggered timing (e.g., exit intent, scroll depth) and dynamic messaging tailored to user segments. Phrases like “Get My Free Demo” or “See It in Action” outperform generic ones like “Submit.”

5. Value Proposition Clarity

A sharp, specific value proposition answers: “Why should I choose you?”
In a crowded market, ambiguity kills conversions. CRO strategies ensure your core message is instantly understood, emotionally resonant, and consistent across touchpoints. The 2025 approach uses eye-tracking AI and messaging frameworks like the Value Proposition Canvas to validate clarity and impact.

6. Form Optimization

Forms are often where conversions drop off. Shorter, smarter forms win.

  • Autofill, predictive fields and progressive disclosure are standard CRO techniques.
  • Forms dynamically adapt based on user behavior-if intent is high, more fields can be shown to qualify leads.

Avoid friction: don’t ask for unnecessary data, and always include visual cues like progress bars and tooltips.

7. Speed & Performance Optimization

Website speed is no longer optional. With mobile-first indexing and Core Web Vitals updates, slow-loading pages bleed conversions.
Top CRO strategies include:

  • Using modern frameworks like Next.js or Astro
  • Compressing assets with AI
  • Minimizing third-party scripts

Page speed also affects SEO, so this is where CRO and SEO converge.

8. Micro Conversions & Funnel Drop-Offs

While macro conversions (like purchases) are the goal, micro conversions-such as newsletter signups or video views-indicate engagement and buying intent.
CRO strategies map these events across the funnel to identify where users drop off. Tools like Heap, Mixpanel, and GA4 are used to trigger retargeting, smart nudges, or live chat at the right moment.

9. Personalization & Dynamic Content

2025 is the year of Agentic AI and personalization is no longer static.
Modern CRO strategies now involve:

  • AI-generated content variations
  • Product recommendations based on real-time behavior
  • Dynamic pricing or offers based on location or segment

Platforms like Mutiny, Dynamic Yield and Adobe Sensei help marketers deliver contextual experiences that boost both engagement and conversions.

These CRO techniques form the core of a robust, modern conversion rate optimisation strategy.

When implemented with the right tools, data, and user understanding, they consistently improve conversion rates and maximize ROI across industries.

SEO & CRO: How to Integrate for Maximum ROI 

Integrating SEO and CRO isn’t just smart, it’s essential.

While SEO drives qualified traffic, CRO ensures that traffic converts.

Businesses that treat them as a unified strategy rather than separate silos unlock higher ROI, better user experience and faster revenue growth.

Aligning SEO Landing Pages with CRO Goals

The best-performing landing pages are built with both visibility and conversion in mind. That means:

  • Using SEO best practices like keyword-rich headings, structured data, and internal linking.
  • Ensuring each SEO-driven landing page has a clear goal, whether it’s lead capture, product discovery or trial sign-up.

By tying content topics directly to high-intent keywords and pairing them with persuasive design, businesses maximize both search rankings and conversion potential.

Matching Search Intent with User Flow

Search intent in 2025 is more nuanced, thanks to Google’s advancements in semantic understanding and SGE (Search Generative Experience).
CRO experts must ensure the user flow reflects the searcher’s intent, such as:

  • Informational queries ➜ Direct to rich blog pages with educational CTAs like “Get the Checklist”
  • Transactional queries ➜ Drive users to optimized product or service pages with social proof and urgency triggers
  • Navigational queries ➜ Ensure seamless UX with clear pathways to what users expect to find

When search expectations are met with tailored user experiences, bounce rates drop, time-on-page increases, and conversions surge.

Optimizing Page Speed, Structure, and CTAs

CRO and SEO both benefit from technical excellence.
Top-performing pages meet or exceed Core Web Vitals thresholds and are built using:

  • Modern frameworks like Next.js, Remix, or Astro for lightning-fast load times.
  • Semantic HTML and accessible design for both crawlers and users.
  • Contextual CTAs that appear based on scroll behavior, exit intent or content relevance keeping the user engaged.

Remember: Google rewards fast, useful pages and users convert on them more.

Case Examples of Successful SEO-CRO Alignment

Example 1: B2B SaaS Company

  • Created SEO content hubs for “AI Marketing Automation”
  • Embedded CRO widgets like in-line demos and chatbot CTAs
  • Result: 38% increase in demo bookings from organic traffic in 90 days

Example 2: Ecommerce Brand

  • Optimized category pages for search volume and intent (“best running shoes 2025”)
  • A/B tested layouts and offer banners based on user behavior
  • Result: 22% boost in organic revenue per session

Example 3: Lead Generation Agency

  • Rewrote blog posts with clearer CTA flows and exit-intent forms
  • Integrated dynamic CTAs based on traffic source
  • Result: 60% increase in MQLs from organic visits in six months

True ROI happens when your SEO pages don’t just rank but convert. With the right strategy, SEO brings the right people, and CRO ensures they take the right action. In 2025, this integration is the cornerstone of sustainable digital growth.

The Role of Agentic AI in Conversion Rate Optimisation (CRO)

What is Agentic AI & Why It’s a Game-Changer for CRO?

In 2025, Agentic AI is redefining the future of conversion rate optimisation.

Unlike traditional AI, which reacts to pre-set instructions, Agentic AI is proactive.

It identifies friction in the user journey, determines optimal actions, and executes those actions autonomously.

Think of it as an intelligent CRO agent working behind the scenes, continuously testing, learning and personalizing every touchpoint without waiting for a human to initiate an A/B test.

Agentic AI aligns perfectly with the speed and complexity of modern digital experiences, where user behavior, preferences and context shift in real time.

Agentic AI allows digital marketers to break free from linear, manual experimentation models. It’s fast, scalable, and context-aware-critical traits in a digital landscape where user patience is minimal, data privacy is paramount, and real-time personalization drives ROI.

As CRO in 2025 evolves into a multi-disciplinary, data-rich practice, Agentic AI becomes the engine that powers intelligent decision-making and execution all without waiting for human bandwidth.

Real-World Examples of Agentic CRO in 2025

1. Real-Time Content Adaptation

Imagine a visitor landing on your SaaS homepage. Based on their referral source (e.g., LinkedIn), device type, and browsing history, Agentic AI immediately swaps the hero image, adjusts the headline to fit B2B buyers, and shows relevant use cases-without manual rule-setting.

2. Autonomous Testing & Learning

Instead of marketers manually running A/B or multivariate tests, Agentic AI automatically identifies underperforming areas (e.g., high bounce on mobile CTA), runs multiple test variants, and deploys the highest performer-all in real time.

3. Automated Copy and Layout Optimization

Agentic systems continuously monitor engagement signals like scroll depth, click maps, and cursor movement. If the bounce rate spikes on a new pricing page, the AI reorders sections, shortens paragraphs, and rephrases headlines dynamically to improve conversion.

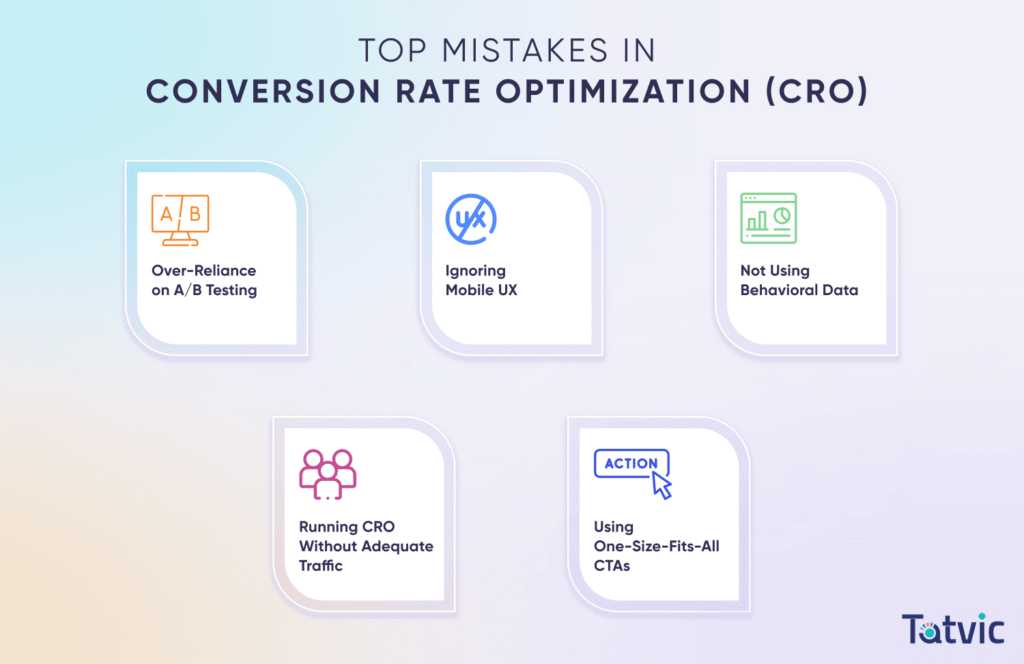
Top Mistakes in Conversion Rate Optimisation (CRO)

Even the most well-funded CRO efforts can fall flat if rooted in outdated assumptions or misapplied tactics.

In 2025, with AI tools, sophisticated UX expectations, and tighter privacy laws reshaping digital strategy, it’s more important than ever to avoid these critical CRO mistakes that can quietly erode your conversion potential.

Top Mistakes in Conversion Rate Optimisation (CRO)

Let’s see the Top Mistakes in CRO:

1. Over-Reliance on A/B Testing

While A/B testing remains valuable, depending on it as the only CRO tactic is outdated. In 2025, A/B tests are often too slow or statistically underpowered-especially for low-traffic pages. Instead, combine them with AI-driven multivariate testing, behavioral data insights, and predictive analytics for smarter, faster optimization.

2. Ignoring Mobile UX

Over 70% of web traffic in 2025 comes from mobile. Yet, many businesses still design primarily for desktop. Poor mobile responsiveness, small CTAs, and slow load times contribute to major conversion friction. CRO today must prioritize mobile-first experiences, with thumb-friendly layouts, micro-interactions, and lightning-fast performance.

3. Not Using Behavioral Data

Ignoring tools like heatmaps, session recordings, scroll depth tracking, and funnel analytics leads to blind optimization. Behavioral data provides the why behind the what, revealing intent, hesitation, and frustration in real time-vital for crafting CRO strategies rooted in real user experience, not assumptions.

4. Running CRO Without Adequate Traffic

CRO isn’t magic-it needs statistically significant data to work. Running experiments with insufficient traffic leads to misleading results and wasted time. Before launching a CRO campaign, ensure your baseline traffic and conversions are high enough to yield trustworthy insights. Consider qualitative research and heuristics if volume is low.

5. Using One-Size-Fits-All CTAs

“Sign Up Now” and “Learn More” won’t cut it in 2025. CRO fails when calls-to-action lack context, personalization, or relevance. Modern users expect micro-segmented CTAs based on where they are in the funnel, their device, referral source, or even real-time behavior. Static CTAs are conversion killers.

A common reason why CRO fails is when it’s run in a silo-disconnected from brand messaging, SEO, content, or sales goals. Conversion optimisation must be strategically aligned across teams and customer journeys to truly move the revenue needle.

The most common CRO errors in 2025 are avoidable with the right mix of data, UX thinking and AI support. The goal isn’t just to “test” more it’s to learn more, faster. That’s the mindset behind truly scalable conversion growth.

Winning Conversion Rate Optimisation (CRO) Frameworks and Methodologies

In 2025, conversion rate optimisation isn’t just about running experiments-it’s about using the right decision-making frameworks to prioritize, execute, and scale efforts with precision. The most successful CRO strategies today are grounded in structured methodologies that balance user insight with business impact.

Here are two of the most battle-tested CRO frameworks still driving measurable growth in 2025:

1. PIE Framework (Potential, Importance, Ease)

Developed by: Chris Goward, WiderFunnel
Best For: Prioritizing A/B test ideas

The PIE framework helps marketers decide which CRO tests to run first, based on three weighted criteria:

  • Potential - How much room for improvement does this page or element have?
  • Importance - How valuable is the traffic or revenue from this area?
  • Ease - How simple is it to implement the change?

Each factor is scored on a scale (typically 1-10) and total scores help create a testing roadmap that’s both strategic and efficient.

Real-World Example:
A global SaaS platform used the PIE framework to prioritize homepage vs. pricing page testing. The pricing page scored higher on Importance and Potential, leading to a redesign that increased trial sign-ups by 21% within 30 days.

2. LIFT Model (Landing Page Influence Function for Tests)

Developed by: WiderFunnel
Best For: Diagnosing why a page may not be converting

The LIFT Model evaluates a landing page’s effectiveness across six key factors:

  1. Value Proposition - Is the core offer clear and compelling?
  2. Clarity - Is the content easy to understand?
  3. Relevance - Does it match the visitor’s intent?
  4. Urgency - Is there a reason to act now?
  5. Anxiety - What doubts might be holding users back?
  6. Distraction - Are there elements pulling attention away?

Using this model, CRO teams can analyze pages visually and strategically before even running a test.

Real-World Example:
An ecommerce brand selling eco-friendly apparel used the LIFT Model to redesign their product pages. By reducing distractions, increasing trust signals, and sharpening the value message, they saw a 28% increase in conversions within 45 days.

Frameworks like PIE and LIFT don’t just simplify Conversion Rate Optimisation but amplify ROI by ensuring each test or optimization is grounded in business logic and user psychology.

In 2025, where digital attention is scarce and AI is ubiquitous, having the right methodology is what separates growth leaders from the rest.

How to Get Started with Conversion Rate Optimisation (CRO) in 2025?

Whether you’re new to conversion rate optimisation (CRO) or looking to scale your existing efforts in 2025, the key lies in building a structured, data-driven approach from day one. With AI-driven tools, privacy changes, and increasing competition, businesses must evolve beyond one-off experiments into systematic, ROI-focused CRO programs.

Here’s your comprehensive roadmap to begin or refine your CRO journey in 2025:

1. CRO Maturity Self-Assessment Checklist

Before diving into tests, assess where your organization currently stands.

Use this CRO maturity checklist to identify gaps:
Maturity Level
Indicators
Beginner No clear funnel insights, ad hoc changes, limited user behavior tracking
Intermediate A/B testing in place, tools like GA4, Hotjar, or VWO used, isolated success stories
Advanced Data-informed hypotheses, personalization at scale, integrated CRO-UX-SEO approach
Leader (2025 Standard) Agentic AI experimentation, full-funnel attribution, constant test iterations across platforms

Pro Tip: Run a monthly self-audit to align your CRO activities with business outcomes and user needs.

2. In-House vs Agency-Led CRO: What’s Best?

Depending on your internal resources, you can either build an in-house CRO team or partner with a CRO agency.

Brief Comparison between In-House vs Agency-Led CRO
In-House CRO
CRO Agency
Deeper brand understanding Access to experts across design, data, and UX
Direct control over testing velocity Faster setup and proven CRO frameworks
Requires skilled team and tools Often more cost-effective than hiring full-time specialists

In 2025, hybrid models are also popular where in-house teams manage execution while agencies provide strategy and experimentation design.

3. Setting Up a  Well Defined Conversion Rate Optimisation (CRO) Roadmap

Your CRO roadmap should align with business goals and user behavior insights.

Here’s a proven phased approach:
  1. Data Audit: Review analytics, heatmaps, funnel leaks, mobile performance
  2. User Research: Gather qualitative insights (polls, surveys, user testing)
  3. Hypothesis Building: Use frameworks like PIE or LIFT to prioritize test ideas
  4. Test Planning: A/B, multivariate, split testing, personalization
  5. Experimentation: Run, monitor, document outcomes
  6. Iteration: Scale what works, discard what doesn’t

Document your roadmap in a shared, cross-functional dashboard, visibility is key.

4. Key Metrics to Track for ROI for Conversion Rate Optimisation

To understand the real impact of CRO, focus on more than just lift in conversions.

Key Metrics to Track:
  • Primary Metrics: Conversion rate, revenue per visitor, average order value (AOV)
  • Secondary Metrics: Bounce rate, time on page, cart abandonment, micro-conversions
  • Operational Metrics: Test velocity, win rate, time-to-deploy
  • ROI Metrics: Cost per experiment vs revenue gained, lift per channel, CAC reduction

In 2025, CRO is no longer judged on isolated experiments, it’s about business efficiency, user satisfaction, and revenue impact.

Getting started with CRO in 2025 means thinking strategically, not sporadically.

Assess your maturity, build the right team (or partners), align testing to business outcomes, and measure what truly matters.

Whether you’re a growing startup or an enterprise, CRO done right is your most cost-effective growth lever.

Conversion Rate Optimisation (CRO) Tools & Tech Stack in 2025

In 2025, the CRO tech stack is smarter, faster, and more integrated than ever.

Here are the Key Tools Powering Top-performing CRO:

  • Optimizely & VWO: Enterprise-grade platforms for A/B, multivariate, and server-side testing.
  • Google Optimize Alternatives: GA4 now integrates with platforms like SiteSpect, Convert.com, and Adobe Target post-Google Optimize sunset.
  • Hotjar & FullStory: Behavioral analytics for session recordings, heatmaps, and user flows.
  • AI-Powered CRO: Tools like Mutiny and Tatvic Agentic CRO Services  automate personalization, CTA testing, and real-time journey optimization.
  • No-Code/Low-Code Platforms: Unbounce, Webflow, and Visual Website Optimizer enable fast test deployment without dev dependency.
  • Data Integrations: Seamless integration with GA4, CDPs, and CRM/marketing automation tools ensures data-driven, omnichannel optimization.

Smart CRO in 2025 is built on data, automation and velocity and your tech stack is the engine behind it.

Top CRO Trends to Watch in 2025-2026

  • Agentic AI & Autonomous Testing: AI agents now run tests, adapt layouts, and optimize in real time-zero manual input needed.
  • Predictive Personalisation: CRO tools use behavior + intent signals to deliver hyper-targeted experiences before users act.
  • Conversion APIs & Privacy-First Testing: With cookies fading, server-side tracking and first-party data are the new CRO foundation.
  • Voice & Multimodal CRO: Optimizing for voice search, chat interfaces, and AI assistants is now critical for seamless user journeys.

CRO in 2025-2026 is no longer reactive, it’s predictive, privacy-ready and intelligently automated.

Read In Depth about Latest Conversion Rate Optimization (CRO) Trends to Follow in 2025 & Beyond


Conclusion: CRO Is No Longer Optional, It’s Essential for ROI in 2025

In today’s high-CAC, attention-fragmented digital world, Conversion Rate Optimization (CRO) isn’t just a tactical upgrade-it’s a strategic imperative. Whether you’re scaling a B2B SaaS company, running an ecommerce brand, or managing lead generation funnels, the difference between flat metrics and exponential growth often comes down to how well you optimize for conversions.

With the rise of Agentic AI, hyper-personalization and real-time testing, CRO in 2025 has evolved into a dynamic, data-led discipline that directly impacts revenue, user experience, and long-term profitability.

Talk to Tatvic’s CRO experts and build a custom roadmap to grow your ROI sustainably


Brands Boosted Leads & Sales with Data-Driven Conversion Rate Optimisation (CRO)

CRO isn’t just theory, it delivers measurable results.

Here are real-world examples of how leading brands achieved significant gains in leads, conversions and engagement using advanced Conversion Rate Optimisation (CRO) strategies and technology integration.

Let’s See Few Conversion Rate Optimisation (CRO) Real World Success Stories:

1. ICICI Prudential Life

+22% Sales | +122% Session Duration
By harnessing the power of Google Marketing Platform and custom machine learning models, Tatvic enabled ICICI Prudential Life to dramatically enhance user engagement and conversion paths resulting in a 22% boost in sales and over 2x longer session durations.

Insight: Data-backed personalization and predictive analytics can directly elevate revenue metrics.

2. HDFC Life Insurance

+169% Lead Form Submissions
Tatvic implemented a comprehensive CRO strategy for HDFC Life focused on user journey mapping, intent-driven landing pages, and frictionless UX design. This resulted in a 169% surge in qualified lead submissions-all without increasing ad spend.

Insight: CRO helps extract more value from your existing traffic by eliminating barriers to conversion.

3. UNext Learning

+15% Lead Submissions via Course Pages
For UNext Learning, Tatvic optimized messaging and information hierarchy across their course pages. This clear, benefit-led communication strategy led to a 15% improvement in form submissions from prospective learners.

Insight: Message clarity and page-level UX are critical to motivating user action.

4. Ferns N Petals (FNP)

+13% Mobile Purchase Funnel Completion | +4% Overall Purchases
Tatvic focused on mobile-first CRO for FNP, identifying key friction points in their mobile purchase journey. Streamlining checkout and CTA placements led to a 13% uplift in mobile funnel completions and a 4% increase in total transactions.

Insight: In a mobile-dominated world, mobile-specific optimization can’t be an afterthought.

5. TVS Motor

+31% Lead Generation through Landing Page Optimization
Tatvic transformed TVS Motor’s product landing pages by aligning content with user intent and simplifying the lead capture process. This UX-focused revamp generated a 31% increase in high-quality leads.

Insight: Strong UI/UX synergy can significantly boost lead velocity in high-stakes industries.

6. Royal Enfield

+93% Higher Conversion Rate on Desktop | 44% Higher Conversion Rate on Mobile
By redesigning the ‘Book a Test Ride’ form with better CTA placement, reduced fields, and mobile responsiveness, Tatvic helped Royal Enfield achieve a 50% improvement in conversion rate on this key performance metric.

Insight: Even minor UI changes when based on behavioral data can unlock massive ROI.

These results underline a core principle: CRO is not just about testing, it’s about strategic transformation backed by data, psychology, and continuous iteration. When done right, it turns traffic into business outcomes.

Ready to Start Turning Clicks into Conversions?

Talk to Tatvic’s CRO Experts and Get a Personalized & Data-Driven Roadmap to Conversion Rate Optimisation Success

Ultimate Guide to Performance Max (PMax) Campaigns in 2025: Setup, Strategies, Benefits & Optimization

Ultimate Guide to Performance Max (PMax) Campaigns in 2025 Setup, Strategies, Benefits & Optimization - Tatvic

In today’s fast-evolving digital marketing landscape, advertisers need smarter, more efficient ways to reach customers across multiple channels without juggling countless campaigns. Enter Performance Max campaigns (PMax), Google’s cutting-edge, goal-driven campaign type that launched in late 2021 and has rapidly become a game-changer for marketers worldwide.

Performance Max campaigns unify Google’s vast advertising inventory - including Search, YouTube, Display, Gmail, Discovery, and Maps - into a single, streamlined campaign. Powered by advanced machine learning and automation, PMax helps advertisers maximize conversions and achieve their business goals with minimal manual effort. Unlike traditional campaigns that require managing separate efforts for each channel, PMax intelligently optimizes performance in real time, dynamically delivering the right creative to the right audience at the right moment.

In 2025, Performance Max campaigns represent the pinnacle of automated, cross-channel advertising. They are designed not just to increase clicks or impressions but to drive real business outcomes such as lead generation, sales, and revenue growth, all while reducing management complexity. Google continues to enhance PMax capabilities with new insights, audience signals, and asset optimizations, making it a must-have in any digital marketer’s toolkit.

Why Performance Max Campaigns Are Vital for Modern Marketers

As customer journeys become increasingly complex and omnichannel, brands need smarter solutions to stay competitive.

PMax campaigns allow advertisers to:

  • Reach audiences across all Google channels seamlessly without creating multiple campaigns
  • Leverage real-time machine learning to optimize bids, creatives, and targeting simultaneously
  • Simplify campaign management, freeing up marketers to focus on strategy rather than micro-managing ads
  • Adapt quickly to evolving consumer behavior with dynamic asset combinations and audience signals

This means your marketing budget is efficiently spent on high-value conversions, not just clicks or views.

Quick Performance Highlights of PMax Campaign from 2025

Businesses leveraging PMax in 2025 are reporting remarkable results:

  • Average lead generation increased by over 150% compared to previous campaign types
  • Cost per lead (CPL) improvements of up to 80% or more due to smarter bidding and targeting
  • Cross-channel reach expanded by up to 40%, tapping into new audiences on YouTube, Discovery, and Maps
  • Campaigns launched with PMax see faster time-to-value with significant uplifts in conversions within weeks

These compelling statistics underscore why Google’s Performance Max campaigns have become the backbone of successful paid marketing strategies in 2025.

Pmax campaign touches all the above six inventories from one single campaign

What is a Performance Max (PMax) Campaign?

Definition and Background

Performance Max campaigns, commonly known as PMax campaigns, represent Google’s next-generation advertising solution, first introduced in November 2021. Designed to simplify and supercharge digital advertising, PMax enables advertisers to access all Google ad inventories and channels from a single campaign. This unified approach helps brands drive better results by leveraging Google’s full ecosystem - eliminating the need to manage multiple campaigns separately for Search, Display, YouTube, and more.

Performance Max was launched to replace and enhance legacy campaign types like Smart Shopping and Local campaigns, delivering a broader reach with superior automation and performance. By 2025, PMax has become the go-to campaign type for businesses aiming to maximize conversions and revenue across Google’s entire advertising network.

How PMax Differs From Traditional Campaigns

Unlike traditional campaigns, which focus on specific channels (e.g., Search campaigns target keywords only, Display campaigns show banner ads, YouTube campaigns serve video ads), Performance Max campaigns use advanced automation to combine all channels into one optimized experience. Here’s how PMax stands out:

  • Unified Campaign Structure: Instead of managing separate Search, Display, Shopping, and YouTube campaigns, PMax runs them all simultaneously under one campaign umbrella.
  • Automation-Driven: Uses Google’s machine learning to optimize bids, budget allocation, creative combinations, and audience targeting in real-time.
  • Broader Inventory Access: While Smart Shopping campaigns only covered Shopping and Display networks, PMax unlocks additional Google channels like Gmail, Discover Feed, and Google Maps.
  • Focus on Conversion Goals: PMax campaigns prioritize performance based on advertiser-defined conversion objectives (e.g., leads, sales, app installs) rather than just traffic volume.

Google Channels Covered by Performance Max

A key advantage of PMax campaigns is their reach across multiple high-impact Google channels, including:

  • Google Search: Text ads targeting users actively searching for relevant keywords
  • YouTube: Video ads engaging audiences on the world’s largest video platform
  • Google Display Network: Banner, rich media, and responsive ads across millions of sites
  • Google Discover Feed: Personalized content feed on mobile devices to reach users early in their buying journey
  • Gmail: Interactive ads in users’ inboxes for direct engagement
  • Google Maps: Location-based ads targeting users with high intent near your business

This omnichannel presence helps advertisers meet customers at every stage of the buying funnel.

How Does Performance Max Work

How Does Performance Max Work?

Automation and Smart Bidding

At the heart of every Performance Max campaign is Google’s advanced automation powered by machine learning.

This includes:

  • Smart Bidding: Real-time auction-time bidding that automatically adjusts bids based on predicted conversion likelihood, maximizing conversions or conversion value while respecting your target CPA or ROAS.
  • Budget Optimization: Dynamically allocates budget across channels and audiences to ensure maximum ROI.
  • Creative Asset Optimization: Automatically tests different combinations of headlines, descriptions, images, and videos you provide to find the best performing ads.

This level of automation reduces manual management and enhances campaign performance by continuously learning from performance data.

Role of Audience Signals and Data Feeds

While PMax leverages broad automation, advertisers can accelerate machine learning by providing audience signals - hints about who your ideal customers are. These may include:

  • First-party customer data (e.g., email lists, website visitors)
  • Custom segments based on interests, demographics, or behaviors
  • Remarketing audiences

Additionally, optional product or business data feeds can enrich campaigns by providing Google with detailed information about inventory, offers, and promotions, improving ad relevance and performance.

Real-Time Cross-Channel Optimization

One of PMax’s most powerful features is its ability to optimize in real time across all Google channels simultaneously. Instead of siloed optimization per channel, PMax evaluates user intent signals and context at the moment of auction to deliver the most effective ad format and creative, on the right device, at the right time.

This means a user might see a YouTube video ad first to build awareness, then later a Search ad when they are closer to purchase - all managed automatically within one campaign.

Explanation of Asset Groups and Campaign Structure

Performance Max campaigns are organized into asset groups, where advertisers upload multiple creative assets:

  • Images, logos, and videos
  • Headlines and descriptions
  • Call-to-action (CTA) texts and final URLs

Google’s AI combines these assets dynamically to create customized ads tailored for different channels and audience segments. Multiple asset groups can be created within a campaign to target distinct product lines or audience categories.

Benefits of Using Performance Max Campaigns

  • Reach Google’s Entire Advertising Inventory From One Campaign:

    With Performance Max, you gain seamless access to all Google advertising channels and formats without the hassle of managing multiple campaigns. This omnichannel reach ensures your brand is visible throughout the customer journey - from discovery to conversion.

  • Automation Saves Time and Improves Efficiency:

    PMax’s machine learning automation manages bidding, budget allocation, creative testing, and audience targeting, saving marketers valuable time. This allows you to focus on strategic tasks like creative direction and business growth, rather than micromanaging campaigns.

  • Enhanced Targeting and Audience Reach:

    By integrating first-party data and audience signals, Performance Max campaigns precisely target high-value users while expanding reach to new potential customers. Google’s AI identifies patterns and segments likely to convert, even beyond your initial inputs, optimizing ad delivery.

  • Capturing Both Upper-Funnel Awareness and Lower-Funnel Conversions:

    PMax campaigns uniquely balance upper-funnel branding activities (like video ads on YouTube and Discovery) with lower-funnel performance goals (such as search ads driving immediate conversions). This holistic approach ensures consistent brand presence and efficient conversion pathways.

  • Access to New and Exclusive Inventory Types:

    PMax unlocks inventory that traditional campaigns cannot easily reach, including the Google Discover feed and Maps ads - powerful channels for driving awareness and local intent.

Step-by-Step Setup Guide for PMax Campaigns (2025)

Looking to run your first PMax campaign and unsure where to begin?

Here’s your step-by-step guide on how to set up a Performance Max campaign that’s built to perform.

Step 1: Sign In to Google Ads and Start a New Campaign

Begin by logging into your Google Ads account. Click the “+ New Campaign” button. Google will guide you through a setup wizard.

Step 2: Choose Your Marketing Goal and Campaign Type

Select a campaign objective that aligns with your business goals, for example:

  • Sales
  • Leads
  • Website traffic
  • Local store visits

Then choose “Performance Max” as your campaign type.

Pro Tip (2025): For maximum performance, Google recommends using Performance Max for outcome-driven goals like sales or lead generation.

Step 3: Set Budget and Bidding Strategy

Input your daily budget and choose from the following bidding strategies:

  • Maximize Conversions: Ideal for businesses aiming to grow lead or order volume.
  • Maximize Conversion Value: Best if you want to prioritize high-revenue or high-margin conversions.

Set target CPA or ROAS if you want more control over cost efficiency.

Step 4: Define Locations and Languages

Specify the geographic locations and languages you want to target. You can add multiple countries, states, or custom areas depending on your audience.

In 2025, Google’s location signals are more advanced enabling hyper-local targeting and exclusion logic with higher accuracy.

Step 5: Build Asset Groups

Here’s where you assemble your creative elements. Each asset group should represent a theme, product category, or audience type.

Add:

  • Headlines & Descriptions (text-based copy)
  • Images & Logos (minimum of 3-5 high-quality creatives)
  • Videos (If you don’t add one, Google will auto-generate)
  • Final URLs (product or service landing pages)
  • CTAs (clear call-to-action messages like “Buy Now” or “Get a Quote”)

Use responsive formats for better cross-platform adaptability.

Step 6: Add Audience Signals and Extensions

Provide audience signals such as:

  • Custom segments
  • Customer match lists
  • Website visitors
  • App users

You can also add ad extensions like:

  • Sitelinks
  • Callouts
  • Structured snippets
  • Location extensions (for brick-and-mortar)

Step 7: Final Settings and Launch

Review your campaign summary, confirm tracking (via Google Tag or GA4), and click ‘Publish’. Your campaign enters the learning phase and will begin optimizing after receiving sufficient data.

Understanding Bidding Strategies in Performance Max (2025)

Performance Max campaigns thrive on automation, but at the heart of that automation lies one of the most critical decisions you’ll make: your bidding strategy.

In 2025, Google’s bidding algorithms have become more intelligent, predictive, and deeply integrated with your business objectives. Choosing the right bidding strategy isn’t just about campaign setup - it directly influences how your ads perform across channels like Search, Display, YouTube, Gmail, Maps, and Discover.

Whether your goal is to maximize sales volume, drive higher revenue per conversion, or achieve consistent profitability, understanding the nuances of PMax bidding strategies is essential for long-term success.

Main Bidding Strategies in Performance Max are as follows:

1. Maximize Conversions in PMax: Focused on Volume

The Maximize Conversions strategy is perfect when your primary goal is to drive as many conversions as possible within your budget. Powered by Google’s Smart Bidding, this strategy uses machine learning to automatically adjust bids across all channels in real time, based on the likelihood of conversion.

When to Use Maximize Conversions in PMax:

  • Lead generation campaigns
  • eCommerce campaigns with fixed-margin products
  • Businesses in growth mode looking to fill the top/mid-funnel
  • Accounts that are still gathering conversion data

You can enhance control by setting a target CPA (cost per acquisition).

You can instruct Google to target a specific CPA, helping control acquisition costs. In 2025, this is particularly effective for PMax campaigns with stable historical data.

Example: If your target CPA is ₹500 and Google finds inventory converting at ₹450, it will prioritize and scale that channel to maximize conversions.

2. Maximize Conversion Value in PMax: Focused on Revenue or Profit

For advertisers more focused on profitability or sales revenue, the Maximize Conversion Value strategy is ideal. Instead of counting conversions, Google’s algorithms look at the value behind each conversion, prioritizing high-ticket purchases or high-margin services.

2025 Insight: Google Ads now integrates deeper with CRM and backend systems, enabling better real-time tracking of LTV (lifetime value) and not just one-time sales.

When to Use Maximize Conversion Value in PMax:
  • eCommerce brands tracking order values
  • Subscription businesses optimizing for LTV (Lifetime Value)
  • Brands that want to push premium product sales
  • Mature accounts with detailed conversion tracking in place

   Set a target ROAS to guide Google’s bid decisions.

You can set a Target ROAS (e.g., 500%) to ensure you’re hitting revenue goals relative to your ad spend. Google will then bid higher on searches or placements likely to bring high-value conversions.

Example: If your target ROAS is 400%, and Google sees a $100 ad spend bringing in $400 revenue from one inventory stream, it will amplify efforts on that path.

Choosing the Right Bidding Strategy in PMax Campaigns:

Business Goal

Best Strategy

Use Case Example

Max lead volume Maximize Conversions B2B SaaS lead generation
High revenue growth Maximize Conversion Value eCommerce with high AOV
Budget control Max Conv. with target CPA Local services or startups
ROI-focused Max Conv. Value with target ROAS Online retailers
Test both strategies if unsure. Google’s A/B experiment tool supports split-testing within the same ad account.

Advanced Optimization Techniques for PMax Campaigns (2025)

Once your campaign is live, the real work begins i.e.,  OPTIMIZATON.

Here’s how to unlock full performance from your PMax campaign in 2025:

1. Monitor Asset Performance

Regularly review asset-level reporting in Google Ads to identify underperforming creatives.

Look at:

  • Ad strength rating (Low, Good, Excellent)
  • Individual asset performance (Best, Good, Low)

Replace weak assets and test fresh variations every 2-3 weeks.

2. Use Audience Signals for Refined Targeting

Google’s automation is smart, but audience signals help accelerate learning.

Use:

  • Customer Match for known users
  • Custom Segments for interest-based groups
  • First-party data from GA4, CRM, or CDPs

Layering intent-based audiences leads to improved efficiency across the funnel.

3. Exclude Irrelevant Placements

Although you can’t control placements directly in PMax, use placement reports to identify non-relevant traffic sources.

Use account-level content exclusions to block:

  • Mobile apps
  • Sensitive categories
  • Gaming sites

4. Optimize Product Feeds

For eCommerce, your product feed is the backbone.

Improve:

  • Titles and descriptions (keyword-rich, user-friendly)
  • High-quality images
  • Promotions and pricing accuracy
  • GTIN and category alignment

Use Google Merchant Center’s Feed Rules to automate transformations.

5. Enable Final URL Expansion Wisely

Google uses Final URL Expansion to send traffic to other pages on your site that may convert better.

  • Turn it on for dynamic targeting
  • Turn it off when strict landing page control is needed (e.g., lead gen)

You can exclude URLs you don’t want traffic sent to.

6. Use UTM Tracking and Analytics Integration

Track performance accurately by adding custom UTM parameters to URLs.

This ensures clean data flow into:

  • GA4
  • CRM systems
  • Marketing dashboards

7. Ad Scheduling for Peak Performance

Use historical performance data to adjust ad schedules, only show ads when conversions are most likely.

Example: Schedule higher budgets on weekends if you see more conversions on Saturdays.

8. Implement Product Bucketing and Automation Scripts

For large accounts, break down products by performance tiers (A/B/C) and create asset groups accordingly.

Also, use Google Ads scripts or external tools for:

  • Budget pacing
  • Bidding logic overrides
  • Automated alerts

9. Review Search Terms and Add Negatives

Though PMax limits keyword control, Search Term Insights (2025 update) now provide more visibility into intent signals.

Regularly:

  • Identify irrelevant queries
  • Add account-level negatives

Common Mistakes & Challenges in Performance Max Campaigns & How to Overcome Them

Performance Max (PMax) campaigns offer unprecedented automation and reach across Google’s entire inventory, but they’re not foolproof.

Many advertisers in 2025 still struggle with transparency issues, limited control, and optimization missteps.

Let’s unpack the most common pitfalls businesses face with Performance Max Google Ads campaigns and how you can proactively avoid or fix them.

1. Lack of Transparency in Reporting

The Challenge:

One of the most cited drawbacks of PMax campaigns is the limited visibility into where your ads are showing and which channels or queries are driving results. Unlike Search campaigns, you don’t get detailed keyword-level data or full control over placements.

What’s New in 2025:

Google has introduced Search Term Insights, Asset Group performance segmentation, and Audience Insights reports, but full transparency is still evolving.

How to Overcome It:
  • Use Search Term Insights (available in the Insights tab) to understand which queries triggered conversions and optimize accordingly.
  • Leverage Asset Group-level reporting to identify underperforming creatives and iterate.
  • Cross-reference Google Analytics 4 (GA4) for better attribution and user flow insights across the journey.
  • Utilize Performance Planner to predict and forecast performance across PMax vs. other campaigns

2. No Direct Negative Keyword Support (But There Are Workarounds)

The Challenge:

As of 2025, PMax campaigns still don’t allow adding traditional negative keywords directly at the campaign level unless you request Google Support or use shared lists at the account level.

Why It’s a Problem:

Your ads might appear for irrelevant or low-intent searches, wasting budget and harming ROAS.

Workarounds & Fixes:

  • Use Account-Level Negative Keyword Lists: Create and attach them across all campaigns, including PMax.
  • Leverage Brand Safety Lists: Add exclusions for competitors or unrelated queries.
  • Monitor Search Term Insights Weekly: Spot irrelevant themes and submit exclusion requests via your Google rep or API (for high-spending accounts).
  • Optimize Final URL Expansion: Disable or narrow URL expansion to avoid irrelevant landing pages being targeted.

3. Budget Misalignment and Pacing Issues

The Challenge:

Many advertisers either underfund or overfund their PMax campaigns, leading to unstable delivery, limited learnings, or budget wastage.

Typical Issues in 2025:

  • Over-inflated budgets on PMax while ignoring funnel diversification
  • Underfunding leading to machine learning stagnation
  • Seasonal surges not matched with budget adjustments

How to Overcome It:

  • Use the Performance Planner tool to get accurate forecasts before launching.
  • Start with a minimum of 15-20 conversions/week to fuel the algorithm - scale gradually from there.
  • Monitor pacing reports weekly to identify overspending or underspending trends.
  • Break budgets across multiple campaigns if targeting vastly different products or regions.

4. Low Conversion Volume: A Machine Learning Killer

The Challenge:

PMax relies on historical data and real-time conversions to function optimally. If your account lacks volume, performance may stagnate or be wildly inconsistent.

Symptoms:

  • Fluctuating CPA or ROAS
  • Unstable ad placements
  • Limited asset testing

Solutions:

  • Warm Up with Search or Standard Shopping: Run these for 2-3 weeks to build up conversion data, then layer into PMax.
  • Consolidate Conversions: Combine multiple events into one primary goal (e.g., “Purchase + Add to Cart”) to boost signal density.
  • Use Audience Signals Strategically: Feed Google strong intent-based audiences (site visitors, converters, CRM lists) from day one.
  • Revisit Attribution Models: In GA4, ensure your model isn’t ignoring upper-funnel contributions that PMax often drives.

Mastering the nuances of PMax in 2025 can be the competitive edge that elevates your Google Ads performance above the rest.

Summary Table: Pitfalls vs Fixes in PMax Campaign

Challenge

Fix

Limited visibility Leverage Search Term Insights & GA4
No native negative keywords Use account-level lists & exclusions via reps
Poor budget pacing Use Performance Planner & pacing reports
Low conversions Warm-up campaigns, consolidate goals, use 1P audience signals

Future of Performance Max (PMax) Campaigns (2025 & Beyond)

As we navigate the second half of 2025, Performance Max campaigns have established themselves as a cornerstone of Google Ads strategy. But this is just the beginning. Google’s investment in AI-first advertising solutions is accelerating, and PMax campaigns are set to become even more intelligent, predictive, and customizable in the near future.

In this section, we dive into what’s next for Performance Max Google Ads, how automation will evolve, and how savvy advertisers should prepare.

Google’s Roadmap for PMax Campaigns

Google has publicly signaled that Performance Max is the future of paid ads, eventually replacing many legacy campaign types.

Here’s what you can expect in the product roadmap of PMax Campaigns:

1. Deeper AI Customization Options (Coming 2025-2026)

While PMax is already powered by machine learning, expect to see:

  • More granular control over asset-level optimizations
  • Custom AI models that learn from individual advertiser data
  • Expansion of Conversion Value Rules with more inputs like lifetime value, product margin, and CRM integration

2. Expanded Inventory & Ad Formats

Expect PMax campaigns to access:

  • Connected TV (YouTube TV) and streaming placements
  • Google Maps Sponsored Experiences with AI-personalized content
  • AI-generated video ads directly within Google Ads (already in beta)

3. Enhanced Transparency Tools

In response to advertiser feedback, Google is building:

  • More robust Search Term Insights dashboards
  • Asset-level engagement breakdowns (CTR, views, interactions by format)
  • Real-time attribution mapping across Google properties

2025 Insight: PMax campaigns are gradually integrating with Google’s Gemini AI ecosystem, meaning future iterations may offer near real-time content testing, budget reallocation, and multivariate creative suggestions.

Evolution of Automation and AI in Paid Marketing

Automation is no longer just a feature, it’s the foundation.

Here’s how AI is transforming the Performance Max ecosystem in 2025 and what’s next:

AI Area

2025 Capabilities

Future Outlook

Smart Bidding Adjusts bids in real time for conversions or value Bids will soon factor in marginal ROI and multi-session behavior
Creative Automation Auto-generates headlines, images, and even short-form video Gemini-powered tools will build entire brand-specific ad journeys
Audience Targeting Uses signals from website, GA4, CRM lists Will integrate with external AI systems like CDPs and LLMs
Attribution Modeling Cross-channel conversions tracked in GA4 Moving toward predictive attribution and journey simulation

As AI matures, it will do more than optimize, it will simulate scenarios, proactively test variations, and offer prescriptive actions for budget reallocation, creative refreshes, or targeting changes.

How Advertisers Should Prepare for the Future of PMax Campaigns

To stay ahead of the curve, marketers must stop thinking of PMax as just another campaign type and start treating it as a living, learning AI system that requires high-quality inputs and continuous refinement.

Here are future-proofing strategies you should adopt in 2025:

1. First-Party Data Readiness

Google’s AI thrives on signal-rich environments.

Ensure:

  • You’re using Consent Mode v2 and Enhanced Conversions
  • GA4 is fully integrated and tracking across the funnel
  • CRM and offline data are being uploaded and mapped back to campaigns

2. Creative Strategy as a Differentiator

The creative layer is now the most controllable aspect of PMax.

Focus on:

  • Feeding the system with diverse, brand-aligned assets
  • Testing AI-generated video, but pairing it with human storytelling
  • Rotating assets every 30-45 days to prevent fatigue

3. Strategic Automation Supervision

Don’t set and forget. Instead:

  • Monitor AI’s decisions like a strategist oversees a chess match
  • Use rules and scripts (e.g., product feed bucketing) to guide the system
  • Conduct quarterly PMax audits to align business goals with performance

4. Invest in AI Fluency

Marketers who understand how AI models work - inputs, outputs, limitations will outperform those who treat it like a black box.

Upskill your team in:

  • AI prompt engineering
  • Attribution modeling
  • GA4 event strategy

Conclusion: Why PMax Campaigns Are Non-Negotiable in 2025

In 2025, Performance Max campaigns have moved beyond being just another Google Ads feature-they’ve become an essential pillar of modern digital advertising. Powered by advanced AI, real-time data, and holistic cross-channel integration, PMax campaigns enable brands to connect with their audiences wherever they are in the customer journey from discovery to conversion.

By harnessing automation, audience signals, and rich creatives within a single campaign type, PMax campaigns streamline execution while unlocking unparalleled performance potential. Whether you’re a direct-to-consumer brand, a B2B marketer, or an eCommerce retailer, Performance Max gives you the tools to compete and scale effectively across Google’s entire ecosystem: Search, YouTube, Display, Maps, Gmail, and Discover.

>> Get in Touch with our Media Soultions Experts to Leverage PMax Campaigns for Your Business

Discover the Power of Looker BI: A Comprehensive Guide to the Looker BI Tool

Discover the Power of Looker BI A Comprehensive Guide to the Looker BI Tool - Tatvic

In the era of data-driven transformation, Looker BI stands out as a modern business intelligence platform designed to turn raw data into actionable insights.

Unlock the full potential of Looker BI with this in-depth 2025 guide designed to help businesses harness data intelligently.

As a powerful Looker BI tool under Google Cloud, Looker empowers teams to explore, visualize, and act on real-time data without relying heavily on engineering support.

This guide covers everything you need to know from core features like LookML and embedded analytics to seamless integrations with BigQuery, Google Workspace, and third-party tools.

Whether you’re evaluating Looker software for your organization or looking to scale data-driven decision-making, this comprehensive resource offers practical insights, use cases, and updated pricing models to help you stay ahead.

Dive in to discover why Looker continues to lead the BI landscape in 2025 ->>

What Is Looker Business Intelligence (Looker BI)?

Looker BI Tool: The Future of Data-Driven Decision Making

Looker BI is a cutting-edge business intelligence (BI) platform developed by Google Cloud, purpose-built to help organizations unlock actionable insights from their data. In 2025, as data becomes increasingly central to strategic decision-making, Looker software stands out for its modern, cloud-native architecture, scalable infrastructure, and advanced analytics capabilities.

At its core, Looker BI Tool empowers businesses to explore, visualize, and operationalize data in real time. By leveraging LookML-Looker’s proprietary modeling language-teams can define consistent data metrics and business logic across the organization. This ensures accuracy, transparency, and trust in every report or dashboard.

Unlike traditional BI platforms, Looker integrates effortlessly with popular cloud data warehouses such as Google BigQuery, Snowflake, Amazon Redshift, and Azure Synapse, enabling faster queries, minimal data duplication, and improved performance.

Key Strengths of Looker Software Include:

  • Interactive dashboards with real-time drill-down capabilities
  • Embedded analytics directly within business apps and workflows
  • AI-powered insights through Google Cloud’s Vertex AI integration
  • Seamless collaboration across teams with scheduled reports and alerts

Whether you’re a startup looking for agile data tools or an enterprise managing vast data ecosystems, Looker BI delivers the flexibility, security  and intelligence needed to drive better business outcomes in 2025.

Is Looker BI a Tool or a Full-Fledged Data Platform?

Yes, Looker Business Intelligence (Looker BI) is much more than just a traditional business intelligence tool, it’s a robust, cloud-native data platform built on Google Cloud that empowers organizations to explore, analyze, and act on data with unmatched flexibility and scalability.

As of 2025, Looker software enables businesses of all sizes to transform raw datasets into clear, actionable insights through intuitive dashboards, real-time visualizations, and self-service analytics. Unlike legacy BI tools, Looker BI Tool is built for the modern data stack, allowing seamless integration with top cloud data warehouses like BigQuery, Snowflake, and Redshift.

But Looker goes beyond data visualization. It combines powerful analytics, embedded BI capabilities, and application development features into one unified platform.

With Looker BI Tool, you can:

  • Build custom data applications
  • Operationalize insights across business tools
  • Empower non-technical users with self-service access
  • Schedule reports and set intelligent alerts
  • Leverage built-in security and governance at scale

Moreover, Looker software offers access to professional services, industry-specific analytics blocks, and Google Cloud’s AI/ML capabilities-making it a comprehensive solution for data-driven enterprises in 2025.

In short, Looker BI is not just a tool, it’s an intelligent ecosystem designed to help you turn data into growth-driving action.

Features of Looker BI That Redefine Business Intelligence in 2025

An In-Depth Look at What Sets the Looker BI Tool Apart

As businesses in 2025 face mounting pressure to become more data-driven and agile, Looker BI stands out as a next-generation business intelligence platform. Built on the Google Cloud Platform, Looker software offers far more than just dashboards-it’s an intelligent, flexible, and secure platform that unifies analytics, decision-making, and operational workflows.

Top Looker BI Features Redefining Modern Business Intelligence

1. Browser-Based Access for Global Collaboration

One of the biggest advantages of Looker BI is its 100% browser-based architecture. Users can access data and dashboards from any device with a web browser-no software installations or VPNs required.

Use Case: A global retail company with teams in five countries used Looker’s browser-based interface to share unified dashboards across regions. This streamlined cross-border operations and ensured real-time alignment on performance metrics.

2. LookML: Modular, Reusable Data Modeling Language

LookML, the modeling language built into Looker, is one of its most powerful differentiators. It allows data teams to define centralized business logic that’s consistent, reusable, and easy to govern. With LookML, developers and analysts can model complex relationships and metrics with minimal duplication of effort.

Use Case: A fintech startup standardized all financial reporting with LookML, reducing redundant SQL queries by 60% and increasing reporting accuracy.

3. Embedded Analytics: Insights Where You Work

Looker BI Tool allows dashboards, charts, and entire data experiences to be embedded directly into other applications, customer portals, or internal tools. This ensures decision-makers access the right data, right where they need it.

Use Case: A manufacturing firm embedded Looker BI into their ERP system, enabling production managers to view real-time inventory and workflow stats without switching systems-leading to faster decisions and fewer bottlenecks.

4. Augmented Analytics with AI & Machine Learning

In 2025, Looker software integrates Google’s AI/ML capabilities to offer augmented analytics. This includes automated anomaly detection, predictive insights, and smart data recommendations-helping users move from descriptive to prescriptive analytics.

Use Case: A financial institution used Looker to predict market fluctuations and risk exposure. The built-in ML models flagged anomalies in trading patterns-helping the risk team avoid potential losses.

5. Self-Service BI for Everyone

Looker empowers non-technical users with drag-and-drop interfaces, dynamic filters, and intuitive visualizations. Employees across departments can generate insights without needing SQL knowledge, reducing dependency on IT.

Use Case: A media agency gave their client services team direct access to campaign performance data via Looker’s self-service tools, cutting down request backlogs by 40%.

6. Multi-Platform Data Integration for Unified Insights

Looker BI integrates seamlessly with Google Cloud, AWS, Azure, and a host of other cloud and on-premise databases. This multi-cloud support allows businesses to create a single source of truth from scattered data.

Use Case: A multinational corporation connected its Salesforce CRM, Snowflake data warehouse, and on-prem SAP database to Looker-achieving a 360-degree view of customer interactions.

7. Embedded Data Applications & Workflows

Beyond static reports, Looker enables the creation of custom data applications and dynamic workflows. Whether it’s launching a model-triggered campaign or triggering alerts based on metrics, Looker allows data to do the work.

Use Case: An HR platform used Looker to build a real-time attrition risk dashboard and trigger automated alerts to managers when engagement scores dropped below a threshold.

8. Built-In Scheduling, Alerts & Actions

With Looker’s scheduling and alerting tools, users can automate recurring reports, trigger notifications based on thresholds, and integrate with tools like Slack, Sheets, and email for real-time data distribution.

Use Case: A logistics company used Looker to send automated performance reports to regional managers every Monday morning cutting manual prep time by 5+ hours per week.

9. Activations & Remarketing Integrations

Looker’s native integration with Google Ads, Facebook Ads, and marketing platforms bridges the gap between insights and action. Marketers can segment audiences, activate campaigns, and run targeted experiments directly from Looker.

Use Case: An e-commerce brand leveraged Looker to analyze shopping cart abandonment and automatically sync audiences with Google Ads for remarketing resulting in a 20% lift in conversions.

10. Advanced Data Governance & Compliance

From row-level security to version control and audit trails, Looker BI Tool offers enterprise-grade governance. It supports compliance with HIPAA, GDPR, and SOC 2, making it ideal for regulated industries.

Use Case: A healthcare analytics firm used Looker’s granular permissions and audit logs to pass compliance audits with zero security flags.

11. Looker Marketplace & Extensions

The Looker Marketplace offers pre-built blocks, templates, and extensions to accelerate analytics development. This allows businesses to quickly deploy vertical-specific dashboards and industry KPIs.

Use Case: A retail brand deployed a pre-built retail analytics dashboard from Looker Marketplace and had it live in under two days.

These features make Looker software more than just a reporting solution, it’s an enterprise-grade, cloud-native analytics platform that turns data into a strategic business asset.

Core Values That Define Looker BI in 2025

Why Looker Software Is More Than Just a BI Tool

Before diving into the functionalities and features of Looker BI, it’s important to understand the foundational principles that set this modern business intelligence platform apart. As a part of the Google Cloud ecosystem, Looker software is built with a forward-thinking vision bridging the gap between data, people, and action.

Looker BI - Embedded BI for Seamless Integration

Let’s Dive Into The Core Values of Looker BI Fueling Smarter Analytics

1. API-First & Cloud-Native by Design

Looker BI was engineered from the ground up to be API-first and fully cloud-native. This means businesses can easily integrate Looker into any data stack, workflow, or app using RESTful APIs-without traditional on-prem setup hassles. It thrives on cloud platforms like Google Cloud, AWS, and Azure, offering unmatched scalability and agility.

Why it matters: In 2025, organizations demand flexibility. Looker BI delivers it by seamlessly fitting into microservices, CI/CD pipelines, and modern DevOps ecosystems.

2. Semantic Modeling for Consistent Governance

At the heart of Looker lies LookML, a powerful semantic modeling layer that centralizes data logic and definitions. This ensures standardized metrics, reusable models, and robust data governance across the enterprise.

Why it matters: Inconsistent definitions often lead to “multiple versions of the truth.” With Looker BI Tool, your finance team, marketing, and operations can all trust the same numbers.

3. In-Database Architecture for Real-Time Analytics

Unlike legacy BI tools that extract and store data elsewhere, Looker operates directly on live data in your database. Whether it’s BigQuery, Redshift, Snowflake, or others Looker queries the data where it lives.

Why it matters: Businesses in 2025 cannot afford latency. Looker’s in-database architecture ensures real-time insights and zero data duplication.

4. Unified Dashboards, Multiple User Experiences

Looker BI’s flexible front-end supports multiple user experiences from a single dashboard-whether it’s for executives, analysts, or operational users. Personalized filters, drill-down paths, and custom visualizations empower every team member to make sense of data in their own way.

Why it matters: One dashboard, multiple perspectives. That’s collaboration powered by data.

5. Rich, Governed Data Without the Learning Curve

Looker software allows non-technical users to explore rich, governed data sets using a clean, intuitive interface. There’s no need to learn SQL or new tools users can trust the data and explore insights freely.

Why it matters: Democratizing data means everyone-from interns to CXOs-can extract value without compromising governance.

6. Standardized Metrics Across the Organization

Looker BI Tool enforces consistent business logic and KPIs across departments. No more debating over which revenue number is correct-because the platform ensures everyone is speaking the same data language.

Why it matters: Reliable, standardized metrics drive alignment, accountability, and better decisions at scale.

7. Integrated Insights with External APIs & AI/ML

Looker supports third-party API integrations, enabling businesses to blend analytics with AI/ML models and external data. You can push predictive insights into workflows or apps, enabling next-gen data experiences.

Why it matters: Whether it’s combining customer data with ML models or injecting insights into a CRM, Looker turns your BI into an intelligent business engine.

8. Tailored Customization & Personalization

Looker BI supports custom themes, dashboards, extensions, and developer tools to create personalized data experiences. Teams can build what they need from white-labeled reports to interactive apps on top of Looker.

Why it matters: One size doesn’t fit all. Looker lets you adapt the platform to fit your brand and business logic.

9. Embedded BI for Seamless Integration

With embedded analytics, Looker allows you to integrate dashboards and insights directly into your products, websites, portals, or internal tools. Your users or clients never need to leave the platform they already use.

Why it matters: Embedding Looker enhances UX, drives product stickiness, and turns data into a monetizable asset.

In 2025, Looker BI Tool stands tall not just because of its features but because of the values that drive its innovation.

It’s a platform that doesn’t just present data, it connects, governs, empowers, and activates it.

Top Use Cases of Looker BI Tool: 2025 Version

How Looker Software Is Powering Data-Driven Business Transformation Across Industries

In 2025, Looker BI has evolved into a strategic data analytics powerhouse used by global organizations across industries from e-commerce to finance, retail and healthcare.

As part of the Google Cloud ecosystem, Looker BI Tool unlocks data storytelling and predictive intelligence at every level of the business.

Here are the top, real-world use cases where Looker software is delivering measurable value:

1. Marketing Channel Performance Optimization

Unifying Data for Holistic Marketing Insights

With Looker BI, marketing teams can centralize data from Google Analytics 4 (GA4), Google Marketing Platform (GMP), YouTube Ads, Meta Ads, and other platforms into BigQuery. Looker then visualizes this performance data across all channels in real time giving marketers a single source of truth to track engagement, optimize campaigns, and reduce wasted ad spend.

Example: A digital-first retail brand used Looker to analyze cross-channel performance and reduced customer acquisition cost (CAC) by 18% in three quarters.

2. Predicting Customer Lifetime Value (CLV)

Personalized Campaigns Powered by Predictive Insights

Using Looker BI Tool combined with BigQuery ML or AutoML, brands can develop customer lifetime value models to segment and prioritize high-value customers. These insights can be activated in real-time within platforms like Google Ads or CRM systems for precision targeting and personalization.

Example: A fintech firm used Looker software to target customers with high predicted CLV, increasing upsell conversion rates by over 25%.

3. Propensity Modeling for Smarter Targeting

Predicting Customer Behavior with AI-Powered Analytics

Looker BI enables businesses to identify users most likely to perform desired actions-purchase, churn, sign-up, or upgrade-by integrating with Vertex AI Pipelines and BigQuery ML. These models can be seamlessly operationalized into marketing or sales workflows.

Example: An online education provider used Looker to create churn-propensity segments, reducing student dropout rates by 19% using proactive engagement.

4. Revenue Contribution Analysis

Understanding What Drives Revenue Growth

Looker BI Tool empowers organizations to perform granular revenue breakdowns by channel, region, product, customer cohort, and device. Users can drill into real-time dashboards to understand how changes in average order value (AOV), conversion rate, or inventory affect total revenue.

Example: A D2C fashion brand used Looker to identify its most profitable geographies and reallocated ad budgets accordingly-boosting ROI by 22%.

5. Advanced Product Analytics

Driving Innovation and Reducing Churn with Deep Usage Insights

With Looker software, product teams can analyze user interactions across platforms, identify feature adoption rates, and spot friction points in onboarding or checkout processes. This leads to better-informed product roadmaps and fewer assumptions.

Example: A SaaS platform used Looker BI to identify a feature bottleneck that was causing user churn, resulting in a 30% improvement in retention post-fix.

6. Inventory and Supply Chain Intelligence

Streamlining Operations with Unified Data Views

Retailers and manufacturers use Looker BI to combine data from POS systems, warehouse management tools, and external demand forecasts. This ensures timely replenishments, minimizes stockouts, and improves vendor negotiations.

Example:A global CPG company used Looker to reduce overstock by 15% and improve order accuracy using a predictive inventory dashboard.

7. Embedded Analytics for Partner and Customer Portals

Delivering Data as a Service

With Looker’s embedded analytics capabilities, businesses can provide partners, suppliers, or even customers with interactive dashboards-without needing to log into Looker itself. These embedded views can be fully branded and tailored to the audience.

Example: A telecom giant embedded Looker dashboards into their client portal, enabling B2B customers to view usage trends and billing insights.

8. AI-Augmented Decision-Making

Looker + Vertex AI for Smarter Business

In 2025, Looker software integrates deeply with Vertex AI and GenAI APIs, enabling automatic surfacing of anomalies, trend prediction, and even natural language summaries of data insights. Users can ask questions in plain English and receive AI-generated visualizations.

Example: A logistics firm reduced decision latency by using AI-powered Looker insights that highlighted route inefficiencies before they caused delivery delays.

9. Unified Executive Dashboards

Aligning Leadership with Real-Time, Cross-Functional KPIs

Executive teams use Looker BI Tool to monitor critical KPIs across sales, marketing, operations, and finance-all from a unified dashboard. These dashboards are drillable, shareable, and auto-refreshing-ensuring leaders are always one step ahead.

Example: A Fortune 500 CEO receives a daily Looker briefing via Slack showing real-time revenue trends, churn rates and NPS scores.

10. Data Governance & Access Control at Scale

Secure, Role-Based Access for Distributed Teams

Looker’s governance model enables data admins to enforce fine-grained access controls while allowing business users the freedom to explore within their bounds. Whether it’s GDPR, HIPAA, or internal compliance, Looker makes secure data exploration a reality.

Example: A healthcare provider used Looker to provide HIPAA-compliant dashboards to internal teams without exposing sensitive patient data.

Looker BI isn’t just a tool, it’s a strategic intelligence platform that powers smarter decisions at every level of the enterprise.

Whether you’re looking to drive revenue, reduce churn, optimize marketing, or predict future trends Looker software has you covered.

Key Pain Points Addressed by Looker BI Tool

How Looker Software Resolves Modern Data Challenges Across Enterprises

In 2025, businesses face increasing pressure to unlock value from vast and fragmented data. Traditional BI tools often fall short-either due to data silos, slow performance, steep learning curves, or lack of flexibility. This is where Looker BI Tool stands apart.

As part of the Google Cloud ecosystem, Looker software is designed to eliminate these barriers, empowering users with real-time, governed, and actionable insights.

Below are the top pain points Looker BI solves for enterprises today:

1. Breaking Down Data Silos

Unified Data Access for Organization-Wide Consistency

One of the biggest challenges enterprises face is data fragmentation-where marketing, sales, operations and finance use different tools, leading to inconsistent metrics and decision paralysis.

Looker BI solves this by offering a semantic modelling layer that connects disparate data sources into a single source of truth. This means every stakeholder-from analysts to CXOs can rely on consistent, governed metrics across the board.

Example:A multinational corporation operating in 20+ countries unified its regional databases using Looker’s semantic layer. The result? Aligned reporting and 30% faster cross-departmental decision-making.

2. Reducing Dashboard Overhead

One Platform, Multiple Use Cases

Managing multiple dashboards for different departments can quickly spiral into confusion, duplication, and increased overhead. Looker BI Tool addresses this with its modular, reusable data blocks and single-dashboard approach allowing stakeholders to customize views without recreating data logic.

Example: A hospital network eliminated over 40 redundant dashboards by consolidating patient, finance, and operations data into one Looker interface-leading to faster diagnosis decisions and improved care coordination.

3. Minimizing Learning Curve & Encouraging Adoption

Empowering Users with Simplicity and Self-Service

Many BI platforms promise self-service but deliver complexity. Looker BI flips the script by offering a user-friendly interface, embedded data exploration, and training support all backed by intuitive natural language query features and Google AI integration.

Example: An educational institution previously stuck with legacy BI tools saw a 60% increase in analytics adoption across faculty and administration after switching to Looker software, thanks to its minimal learning curve and easy data exploration.

4. Seamless Multi-Cloud & Marketing Integrations

Unified Data from Google Cloud, AWS, Azure, and Ad Platforms

In 2025, flexibility is critical. Businesses are increasingly adopting hybrid and multi-cloud architectures. Looker BI Tool supports out-of-the-box integrations with Google Cloud, AWS, Azure, and on-prem systems. Moreover, its native connections to Google Ads, Facebook Ads, and Google Analytics 4 (GA4) allow marketers to analyze and activate campaigns in one place.

Example: An e-commerce brand connected Looker with GA4, Google Ads, and BigQuery to monitor real-time ad performance. The result was a 25% increase in ROI from more efficient remarketing strategies, directly informed by Looker insights.

5. Ensuring Governed, Accurate, and Scalable Insights

No More Conflicting Reports Across Teams

One of the silent killers in organizations is metric inconsistency. Two teams report different KPIs from the same dataset due to disconnected tools or lack of data governance. Looker software solves this with its centralized data modelling (LookML) and version-controlled logic, ensuring teams always operate with trusted data.

Example: A SaaS company saw a 35% reduction in reporting errors and a 50% improvement in report generation speed after implementing centralized governance using LookML in Looker.

6. Customization Without Compromise

Personalized Experiences for Every Role

Whether you’re a CMO, product manager, or data scientist, Looker BI Tool allows for a tailored experience. Dashboards, alerts, and reports can be customized per role, and insights can be embedded into apps, CRMs, or shared via Slack, email, or Google Workspace integrations.

Example: A logistics company embedded Looker dashboards into their internal app, allowing delivery managers to view fleet KPIs in real time improving on-time deliveries by 22%.

7. Security, Compliance, and Granular Access Control

Enterprise-Grade Data Protection

From GDPR to HIPAA, enterprises today demand secure BI tools. Looker BI supports row-level access control, user-based permissions, and auditing features. It ensures that data access is always appropriate, traceable, and compliant.

Example: A healthcare organization using Looker ensured HIPAA-compliant dashboards for its analysts-reducing data leakage risk while expanding analytics usage.

In 2025, the success of modern BI isn’t just about visualizing data-it’s about solving real problems, unifying teams, and empowering faster, more confident decisions.

Looker BI Tool delivers on this promise by systematically addressing the core pain points that have historically held back organizations from becoming truly data-driven. Whether it’s integration, adoption, security, or performance Looker software ensures your teams have the right data, at the right time, in the right context.

Target Personas for Looker BI Tool

Who Benefits the Most from Looker Software and Why It Matters

As the demand for data-driven decision-making accelerates in 2025, the success of any BI platform hinges on how well it caters to diverse user personas across an organization. Looker BI Tool, part of the Google Cloud ecosystem, is designed to be more than just a data visualization tool-it’s a collaborative, governed, and scalable analytics solution built for every stakeholder, not just data teams.

Targeted Personas for Looker BI

Here’s a deep dive into the top personas that gain the most value from Looker software:

1. Data Analysts

Empowering Analysts with Real-Time Exploration and Advanced Analytics

Looker BI serves as a powerful playground for data analysts who need quick, accurate, and customizable access to business data. With its semantic modelling (LookML), custom metrics, and in-database architecture, analysts can skip the bottlenecks of traditional BI workflows and directly query cloud databases like BigQuery, Snowflake, or Redshift.

Real-World Example:
A data analyst at a national retail chain used Looker software to track in-store vs. online performance across thousands of SKUs. By leveraging Looker’s real-time dashboards, they optimized inventory in high-velocity locations-leading to a 15% reduction in stockouts.

Why Looker BI Works for Data Analysts:
  • Faster querying with Looker’s in-database approach
  • Reusable data logic with LookML
  • Rich visualization tools and drill-down features
  • Ability to build, share, and schedule reports across teams

2. Business Intelligence (BI) Professionals

Orchestrating Unified Insights Across Systems and Teams

For BI managers and engineers, Looker BI Tool offers seamless integrations, advanced governance, and reusable models that simplify the development of analytics ecosystems at scale. Its API-first design and native compatibility with Google Cloud, AWS, Azure, and third-party platforms make it a versatile choice for modern data stacks.

Real-World Example:
In a fintech company, BI professionals leveraged Looker to streamline regulatory reporting across global markets. By connecting Looker to operational and compliance datasets, the team ensured audit-ready dashboards while reducing manual reporting time by 60%.

Why Looker BI Works for Business Intelligence (BI) Professionals:
  • Centralized governance of metrics across business units
  • Pre-built Looker Blocks for faster implementation
  • Integration with data pipelines and ML models
  • Version control and documentation via Git integration

3. Business Executives & Decision Makers

Real-Time Visibility into KPIs That Drive Strategic Action

For C-suite leaders and operational heads, Looker software delivers clear, real-time, decision-ready dashboards. Whether it’s forecasting revenue, monitoring supply chains, or analyzing marketing ROI, executives benefit from a single source of truth that consolidates insights across departments.

Real-World Example:
A global manufacturing company’s COO used Looker BI dashboards to monitor production line performance across multiple factories. Real-time visibility led to a 20% increase in throughput by identifying bottlenecks and allocating resources proactively.

Why Looker BI Works for Business Executives & Decision Makers:
  • Role-based dashboards with executive summaries
  • Real-time alerts for anomalies and KPIs
  • Collaboration via Slack, Google Workspace, and embedded apps
  • Drill-down capability for root-cause analysis

4. Product Managers

Driving Data-Backed Product Development and Optimization

Product managers often struggle with fragmented feedback loops and incomplete user behavior insights. Looker BI Tool empowers them with real-time product analytics, usage metrics, and cohort analysis-critical for refining features and driving engagement.

Real-World Example:
A SaaS product team used Looker software to analyze feature adoption across customer segments. They identified underutilized workflows and collaborated with UX to boost feature usage by 28% in three months.

Why Looker BI Tool Works for Product Managers:
  • Behavioral analytics from app logs and event data
  • A/B testing and conversion tracking via integrated dashboards
  • Integration with Jira, Slack, or internal tools
  • User cohort creation for lifecycle optimization

5. Marketing Teams

Activating Customer Data Across Campaigns and Channels

Today’s marketers are expected to deliver personalized, data-backed campaigns. With Looker’s integration with Google Ads, GA4, Facebook Ads, and BigQuery, marketers can segment audiences, measure ROI, and trigger automated actions from one console.

Real-World Example:
A D2C brand connected Looker BI Tool with their CRM and ad platforms to monitor CLTV, churn risk, and campaign performance. Using Looker dashboards, they optimized their spend and improved return on ad spend (ROAS) by 32%.

Why Looker BI Works for Marketing Teams:
  • Integration with GA4, GMP, Meta Ads, and more
  • Visual funnel tracking and attribution modeling
  • CLTV and propensity modelling using BQML
  • Real-time campaign and channel insights

6. Non-Technical Users (HR, Finance, Operations)

Self-Service Analytics Without the Complexity

Looker makes it possible for non-technical users to become data champions. With self-service dashboards, intuitive UI, and embedded BI capabilities, anyone from HR to finance can explore trends, run queries, and export actionable reports-without writing SQL.

Real-World Example:
An HR director used Looker software to analyze employee retention and hiring trends across departments. They quickly identified high-risk attrition areas and implemented retention policies, reducing turnover by 12%.

Why Looker BI Works for Non-Technical Users (HR, Finance, Operations):
  • Drag-and-drop reporting
  • Natural language query interface
  • Embedded reports in tools like Google Sheets or internal HR portals
  • Scheduled data alerts and role-based views

The beauty of Looker BI Tool lies in its adaptability as it is built for for Every Role, Scaled for Every Business. Whether you’re a data scientist building machine learning pipelines or an operations manager reviewing daily KPIs, Looker software ensures that the right people get the right insights, at the right time, in the right format.

Integration of Looker BI in Your Existing Data Analytics Strategy

In 2025, organizations are moving toward real-time, data-driven decision-making. To stay competitive, integrating the right business intelligence tool is no longer optional-it’s a strategic necessity. Looker BI, a modern enterprise-grade analytics platform from Google Cloud, is designed to bridge the gap between raw data and actionable insights by seamlessly fitting into your existing data ecosystem.

Here’s a step-by-step guide to successfully integrate Looker BI Tool into your current data analytics infrastructure:

1. Assess Your Business Needs and Data Goals

Before diving into implementation, clearly define what you want to achieve with Looker software. Are you aiming to improve operational efficiency, enhance customer insights, streamline reporting, or unify data from various departments?

Ask the following:

  • What KPIs are crucial to track?
  • Which teams will use Looker BI, and for what decisions?
  • What gaps exist in your current reporting and analytics processes?

Pro Tip: Involve both technical teams and business users to align expectations and create a use-case-driven integration roadmap.

2. Identify and Connect Your Data Sources

One of the biggest advantages of Looker BI Tool is its ability to connect directly to your cloud data warehouse or database without requiring data extraction.

Supported platforms include:

  • Google BigQuery (best for native integration)
  • Snowflake, Redshift, Azure SQL, MySQL, and more
  • Third-party apps like Salesforce, Google Analytics 4 (GA4), and Facebook Ads

Looker software acts as a data layer sitting on top of your data warehouse, querying live data to ensure real-time accuracy and scalability.

3. Prepare and Clean Your Data

Data quality is foundational to effective analytics.

Before modeling in Looker, invest time in:

  • Cleaning and de-duplicating records
  • Standardizing formats and terminologies
  • Establishing data governance frameworks

Clean data = Reliable dashboards + Confident decisions.

4. Choose Your Looker Deployment Model

Decide whether you want to run Looker:

  • As a fully managed cloud SaaS (recommended for most organizations)
  • Or deploy it on on-premise or private cloud infrastructure if compliance or data sovereignty is a concern

For enterprises deeply invested in Google Cloud, the cloud-native deployment ensures faster performance, integrated identity management, and tighter security controls.

5. Build LookML Models: Define Your Data Logic

What makes Looker software stand out from traditional BI tools is LookML, a unique data modeling language that defines:

  • How data is structured
  • Relationships between datasets
  • Business metrics and dimensions

Rather than rewriting SQL repeatedly, LookML allows for centralized logic, reusable data models, and governed metrics across teams ensuring consistency and trust in the data.

Quick Comparison:
When comparing Google Looker vs Power BI, Looker excels in enterprise-wide scalability and governed data modeling (via LookML), while Power BI stands out for individual analysis and deep integration with Microsoft tools.

6. Create Custom Dashboards and Embed Insights into Workflows

With Looker BI Tool, business users can build interactive dashboards without writing code.

These dashboards can:

  • Display KPIs and trends in real time
  • Include filters, drill-downs, and data alerts
  • Be embedded directly into your existing platforms (CRM, ERP, intranet, or custom apps)

Example: A sales manager can view real-time pipeline status directly inside Salesforce using an embedded Looker dashboard-no app-switching required.

7. Set Up Role-Based Access and Data Governance

Data security and compliance are critical in today’s environment.

Looker BI provides:

  • Role-based access controls (RBAC)
  • Row-level security policies
  • Audit logs and permissions monitoring

These controls ensure that every user sees only the data they are authorized to access protecting sensitive information while enabling self-service analytics.

Final Thoughts: Unlocking Scalable Insights with Looker BI in 2025

Integrating Looker BI Tool into your data strategy isn’t just a technical upgrade, it’s a shift toward smarter, collaborative and real-time decision-making.

Whether you’re running advanced ML models on BigQuery or simply need reliable sales dashboards, Looker software empowers every user in your organization with trusted, governed, and actionable insights.

By following the steps above, you can ensure that your Looker integration is strategic, scalable, and aligned with business outcomes.

Ready to Transform Your Data Strategy with Looker?

If you’re evaluating Looker BI or considering migrating from tools like Power BI or Tableau, we can help tailor a deployment roadmap aligned with your business goals.

Contact Us >>


Google Analytics vs Adobe Analytics: Which Analytics Tool Is Right for You in 2025?

Google Analytics vs. Adobe Analytics: Which One is Right for You?

Do you really know what your customers are doing across your website and app? In 2025, with digital behavior becoming more fragmented and privacy regulations tightening, choosing the right analytics platform is more than a tactical decision, it’s a strategic imperative. And when it comes to enterprise-grade digital analytics tools, the most common comparison marketers face is Google Analytics vs Adobe Analytics.

Understanding user behavior across digital touchpoints is no longer just an edge, it’s essential for performance-driven marketers looking to improve conversion rates, reduce wasteful ad spend, and drive measurable ROI. At the heart of every effective, data-driven marketing strategy lies a powerful analytics engine, one that not only tracks activity but transforms raw data into actionable insights.

Two of the most widely used and robust analytics tools in 2025 are Google Analytics 4 (GA4) and Adobe Analytics.

Both platforms offer cutting-edge capabilities, but they serve different needs depending on your organization’s size, goals, and data maturity.

  • Google Analytics 4 has cemented itself as the go-to tool for businesses embedded in the Google ecosystem. It’s renowned for its event-driven model, AI-powered insights, privacy-first tracking, and seamless Google Ads integration, making it an ideal solution for SMBs and mid-sized enterprises focused on marketing performance.
  • On the other hand, Adobe Analytics is the powerhouse of enterprise analytics, preferred by data-savvy teams that demand advanced segmentation, custom dashboards, real-time processing, and rich integration with the Adobe Experience Cloud. Its proprietary AI engine, Adobe Sensei, takes predictive analytics to the next level giving businesses deeper visibility into customer journeys and micro-conversions.

But here’s the real challenge: Which platform aligns better with your current tech stack, marketing goals, and the level of data control you require? It’s not just about comparing features-it’s about understanding which platform empowers your team to make better, faster, and more profitable decisions.

In this comprehensive guide, we’ll break down the key differences between Google Analytics and Adobe Analytics, including setup, customization, pricing, attribution modeling, integrations, data export capabilities, and more-so you can choose the right analytics engine to future-proof your strategy in 2025 and beyond.

Google Analytics vs Adobe Analytics: Quick Comparison Table (2025)

Trying to decide between Google Analytics vs Adobe Analytics?

Whether you’re a data-driven marketer or a tech-savvy analyst, this side-by-side comparison chart breaks down the core differences between the two leading digital analytics tools. From pricing and setup to AI capabilities and customization, here’s a clear overview to guide your decision-making in 2025:

Tip: Bookmark this sticky comparison table for quick reference-it’s your go-to guide for choosing between GA4 vs Adobe for your enterprise analytics strategy.

Feature

Google Analytics 4 (GA4)

Adobe Analytics (2025)

Ideal For SMBs, startups, marketing teams within the Google ecosystem Enterprises, agencies, data teams needing high customization
Pricing Free (GA4 Standard); GA4 360 starts at ~$50,000/year (varies by usage) Premium only; Adobe Experience Cloud-based; custom enterprise pricing
Setup & Implementation Faster setup, intuitive UI, seamless Google Tag Manager integration Complex setup; typically requires Adobe-certified implementation partner
Data Model Event-based, cross-platform (web + app), privacy-focused Hit-based, customizable schemas, allows full control over variables
Real-Time Data Available with slight delay (up to 1 min); basic real-time reporting True real-time analytics with granular event-level visibility
Customization & Flexibility Limited customization; mostly template-based Highly customizable reports, dashboards, and data views
Reporting Interface Simplified, uses Explorations for custom reports Advanced workspace with drag-drop, cohort analysis, and pathing reports
Predictive Insights / AI Built-in with Google AI; predictive metrics (churn, revenue) Powered by Adobe Sensei for advanced AI, predictive modeling, and ML
Attribution Models Last-click by default; supports DDA, data-driven attribution Custom attribution models with multi-touch and rules-based options
Integrations Deep integration with Google Ads, BigQuery, Looker Studio Native integration with Adobe Experience Platform, Target, Campaign
Data Retention & Export GA4 Free: 14 months (default); GA4 360: up to 50 months; export via BigQuery Full raw data access; feeds into Data Lake/Cloud Storage natively
Data Sampling Applies to free GA4 under high traffic; GA4 360 reduces sampling No sampling in most reports; high accuracy even at scale
User Permissions & Roles Standard roles; limited granularity Granular role-based access controls and user segmentation
Compliance & Privacy GDPR & CCPA ready; modeled data for consented-only tracking Enterprise-grade data governance, privacy controls, audit logs
Learning Curve Moderate; easier for marketers familiar with Google tools Steeper learning curve; suited for analysts and technical users

Google Analytics vs Adobe Analytics: Overview of Each Tool

Overview of Google Analytics 4 (GA4)

Launched as the next generation of Google Analytics, GA4 is now the default analytics solution from Google as of 2025.

It represents a major shift from traditional session-based tracking to a more flexible event-driven data model designed to align with modern user behaviors across devices and platforms.

  • Event-Driven Model for Flexible Tracking

    GA4 tracks every user interaction-such as clicks, video views, scrolls, and transactions-as discrete events. This model enables marketers to build a more accurate and granular picture of the customer journey, especially in today’s multi-device world.

  • AI-Powered Insights with Google Intelligence

    With built-in machine learning, GA4 automatically surfaces predictive metrics like potential revenue from user segments or churn probability. These insights are powered by Google’s AI engine, enabling proactive decision-making rather than reactive analysis.

  • Cross-Platform & App + Web Tracking

    One of GA4’s standout capabilities is seamless tracking across websites, iOS, and Android apps under a single property. This unified measurement model provides a clearer, more complete view of user engagement across all touchpoints.

  • Native Integrations with Google Ecosystem

    GA4 tightly integrates with Google Ads, BigQuery, Looker Studio, and the broader marketing stack-making it a natural choice for advertisers already invested in Google’s ad ecosystem.

If you’re prioritizing speed, simplicity, and automation, GA4 is a powerful choice, especially for small to mid-sized teams looking for digital analytics tools with built-in AI.

Overview of Adobe Analytics

Positioned as a premium enterprise analytics platform, Adobe Analytics continues to be the tool of choice for large organizations that require deep customization, advanced segmentation, and unified data across diverse customer touchpoints.

  • Enterprise-Grade Customization

    Adobe’s platform architecture allows for completely tailored data schemas, custom variables (eVars, props), and calculated metrics-making it ideal for complex organizations with diverse KPIs and reporting needs.

  • Adobe Sensei AI Engine

    At the heart of Adobe Analytics is Adobe Sensei, the brand’s proprietary AI and machine learning framework. It powers features like anomaly detection, predictive modeling, customer journey analytics, and intelligent alerting-helping teams move from data analysis to automated action.

  • Real-Time Data & Segmentation

    Unlike GA4, Adobe Analytics delivers real-time reporting and segmentation, enabling marketers to create hyper-targeted audiences on the fly. These can then be activated across Adobe Experience Cloud products like Adobe Target and Adobe Campaign for personalization and marketing automation.

  • Integrations Across Adobe Experience Platform

    Adobe Analytics functions as a hub within the Adobe Experience Platform, integrating seamlessly with tools for testing, targeting, content management, and audience activation-creating a powerful closed-loop marketing system.

If your team needs deep customization, real-time streaming analytics, and machine-learning-powered segmentation, Adobe Analytics is a top-tier platform built for high-scale enterprises.

TL;DR: Choosing the Right Tool Based on Your Needs

Use Case

Go With GA4 If…

Choose Adobe Analytics If…

Speed of Setup You need fast, plug-and-play setup You have the resources for custom implementation
Budget You’re budget-conscious or scaling You’re an enterprise with budget for premium tools
AI & Predictive Modeling You want predictive metrics with Google AI You need deep learning models via Adobe Sensei
Customization You’re okay with limited templates You need full control over metrics and variables
Real-Time Use Cases You can tolerate slight data latency You require real-time user-level data and actions

Google Analytics (GA4) vs Adobe Analytics: Detailed Feature-by-Feature Comparison

Let’s explore detailed comparison between Google Analytics & Adobe Analytics:  

1. Ease of Setup & Implementation

  • Google Analytics 4 (GA4): Fast, Flexible, and User-Friendly

    GA4 is built for quick deployment-especially via Google Tag Manager-making it easy for marketers to track events and set goals without touching code. Its event-based model and guided setup make it ideal for startups, SMBs, and non-technical teams. Seamless integrations with Google Ads, BigQuery, and Looker Studio further simplify implementation.

Best for teams looking for quick setup, low-code customization, and instant value.

  • Adobe Analytics: Enterprise-Grade, But Tech-Heavy

    Adobe Analytics offers deep customization but requires a more technical setup, often involving developers and data engineers. Implemented through Adobe Experience Platform Tags, it supports custom schemas, complex data layers, and advanced segmentation powered by Adobe Sensei.

Best suited for large enterprises with complex data needs and dedicated tech teams.

2. Pricing & Scalability (GA4 vs Adobe Analytics)

  • Google Analytics 4 (GA4): Budget-Friendly to Enterprise-Ready

    GA4 offers a robust free tier ideal for startups and mid-sized businesses looking to leverage advanced digital analytics tools without upfront costs. For larger organizations, GA4 360 unlocks enterprise-grade features-including BigQuery integration, elevated data limits, and SLA-backed support-starting at $50,000/year for up to 25 million events/month. Pricing scales with event volume, making it a scalable solution for fast-growing eCommerce brands, SaaS platforms, and digital-first enterprises.

Curious about GA4 360 pricing? Get a personalized quote based on your monthly event volume.

  • Adobe Analytics: Premium Pricing for Enterprise Power

    Adobe Analytics operates on a tiered, subscription-based pricing model starting at $2,000-$2,500/month, with costs increasing based on data volume, user seats, and Adobe Experience Cloud integrations. Enterprise deployments especially those requiring advanced segmentation, real-time personalization, or AI-powered insights via Adobe Sensei can easily exceed $100,000/year. It’s best suited for global enterprises, media conglomerates, and financial institutions with complex data needs and mature marketing stacks.

When comparing Google Analytics vs Adobe Analytics on cost, GA4 offers greater accessibility and flexibility. Adobe Analytics, while more expensive, provides a premium, customizable analytics experience built for enterprise-scale performance and depth.

3. Real-Time Data Processing

When evaluating digital analytics tools, one critical factor is how fast user interaction data-such as clicks, scrolls, purchases, and page views-is processed and made available in your reports. The faster your analytics platform surfaces insights, the quicker you can act on them. Here’s how GA4 vs Adobe compares on real-time performance:

  • Google Analytics 4 (GA4): Near Real-Time Visibility

    GA4 delivers real-time reports that update within 5-10 minutes, offering marketers a quick pulse on active users, traffic sources, and on-site behavior. This is highly valuable for monitoring campaign launches or on-site events as they happen. However, complete data processing for in-depth reports-like conversion paths, audience segments, and custom dimensions may take up to 4-6 hours, depending on data volume and complexity.

Best for: Businesses that need quick visibility into high-level metrics but can afford a short delay for full analytical depth.

  • Adobe Analytics: Lightning-Fast Insights for Enterprise Decisions

    Adobe Analytics leads the way in enterprise analytics with near-instant data updates. It offers streaming data with latency as low as 30-90 seconds, making it ideal for organizations that rely on real-time dashboards, personalization engines, or time-sensitive decisions. Deeper reports-encompassing segmentation, attribution, and cohort analysis-are typically processed within 15-30 minutes, backed by Adobe Sensei’s AI capabilities for smarter insights at speed.

Best for: Enterprises with dynamic content strategies, personalization needs, or real-time optimization goals.

 In the Google Analytics vs Adobe Analytics comparison for real-time data processing, Adobe Analytics outpaces GA4-especially for businesses that demand instant, AI-enhanced insights. GA4 still offers sufficient speed for most mid-sized companies but lags slightly when seconds count.

4. Customization & Reporting Tools

When comparing digital analytics tools like Google Analytics vs Adobe Analytics, the ability to customize reports and dive deep into user behavior is a crucial differentiator especially for data-driven marketing teams and enterprise strategists.

  • Google Analytics 4 (GA4): Streamlined Reports with SQL-Powered Depth

    GA4 offers a clean, intuitive reporting interface with default dashboards across key performance areas like Audience demographics, Traffic Acquisition, Engagement trends, and E-commerce performance. For marketers needing deeper analysis, GA4 integrates seamlessly with Google BigQuery, enabling SQL-based custom queries for multi-dimensional insights.While GA4’s built-in reports are easy to navigate, advanced customization requires technical skills or support from data analysts-particularly when building cross-platform funnel visualizations or predictive models.

Best for: Businesses that need straightforward insights but have access to technical resources for deeper analysis via BigQuery.

  • Adobe Analytics: Enterprise-Grade Flexibility with Analysis Workspace

    Adobe Analytics excels in reporting flexibility. Its Analysis Workspace is a robust, drag-and-drop environment that empowers marketers and analysts to build highly tailored dashboards, visualize customer journeys, model attribution, and segment users in real-time-all without writing code. Adobe’s native integration with Adobe Sensei adds AI-powered features like anomaly detection, contribution analysis, and predictive scoring.With support for complex calculated metrics, cohort analysis, and dynamic filtering, Adobe Analytics is built for enterprises with mature analytics practices and nuanced KPI tracking.

Best for: Enterprises that require granular, customizable reporting across omnichannel data sources and real-time personalization strategies.

In the debate of GA4 vs Adobe Analytics for reporting, GA4 offers simplicity and scalability, while Adobe Analytics leads in customization, flexibility, and depth-especially for large teams working across multi-touchpoint user journeys. If you’re an enterprise looking for AI-driven, tailor-made reporting tools, Adobe Analytics is the powerhouse you need.

5. Attribution Models & Accuracy

In today’s omnichannel world, attribution isn’t just about credit-it’s about clarity. Understanding which touchpoints influence customer decisions is vital for allocating budgets, improving campaigns, and refining strategy. Whether you’re a DTC brand, SaaS provider, or digital-first enterprise, choosing the right attribution model is key to unlocking performance.

  • Google Analytics 4 (GA4): Smarter Attribution with Machine Learning

    GA4 offers a suite of cross-channel attribution models, including Last Click, First Click, Linear, Time Decay, Position-Based, and its default Data-Driven Attribution (DDA)-powered by Google’s advanced machine learning algorithms. DDA dynamically analyzes how each channel contributes to conversions based on real-time behavior patterns across devices and sessions.Marketers can leverage GA4’s attribution insights to fine-tune their paid media, SEO, and content strategies-especially beneficial in fast-paced industries like eCommerce where campaign agility directly impacts ROI.

Bonus: GA4 now includes conversion path visualization tools that make it easier to track user journeys and channel contributions.

Best for: Businesses that want automated, ML-powered attribution with actionable insights baked into their analytics dashboard.

  • Adobe Analytics: Precision Attribution for Power Users

    Adobe Analytics takes attribution a step further with its customizable Attribution IQ in Analysis Workspace. It supports a wide range of models-including First Touch, Last Touch, Linear, U-Shaped, Time Decay, and custom rules. Users can layer segmentation, apply filters, and compare models side-by-side, making it an invaluable tool for teams needing granular control over attribution logic.What sets Adobe apart is the integration of Adobe Sensei, Adobe’s AI engine, which enhances attribution accuracy through predictive modeling, anomaly detection, and deep funnel analysis.

Best for: Enterprises with complex user journeys, large datasets, and a need for highly customized attribution frameworks.

In the Google Analytics vs Adobe Analytics matchup, GA4 excels with its automated, data-driven attribution for scalability, while Adobe Analytics stands out for precision, flexibility, and AI-powered insights. If you’re looking for enterprise-level attribution tailored to unique marketing goals, Adobe is hard to beat. But if speed, simplicity, and ML-driven attribution are your top priorities, GA4 delivers value out of the box.

6. Cross-Device & Cross-Platform Tracking

In today’s multi-device world, a customer journey rarely starts and ends on the same screen. From mobile research to desktop purchases and tablet re-engagement, cross-device and cross-platform tracking is essential for delivering a seamless and personalized user experience.

  • Google Analytics 4 (GA4): Unified Tracking with Google Signals & User-ID

    GA4 leverages Google Signals-Google’s anonymized data from signed-in users-and the User-ID feature to stitch together sessions across devices. This enables marketers to build a single, unified view of user behavior, even as users switch from mobile to desktop or browse across multiple sessions.By combining device data with machine learning, GA4 offers improved insight into conversion paths, behavioral patterns, and drop-off points-empowering businesses to optimize omnichannel strategies and personalized retargeting efforts.

Best for: Brands seeking plug-and-play cross-device insights with Google’s ecosystem advantages and built-in identity resolution tools.

  • Adobe Analytics: Advanced Identity Resolution for True Omnichannel Insight

    Adobe Analytics uses a Visitor ID Service with Experience Cloud ID (ECID) to unify user interactions across devices, channels, and even offline data points. With its device graphing capabilities, Adobe Analytics offers a robust, real-time view of the entire customer journey. Additionally, Adobe’s Profile Merge Rules and integrations with Adobe Sensei allow marketers to create persistent, identity-based profiles that power dynamic personalization, cross-device remarketing, and deeper customer intelligence.

Best for: Enterprises requiring granular identity stitching, advanced segmentation, and real-time cross-platform attribution within a larger experience ecosystem.

In the battle of GA4 vs Adobe Analytics, GA4 provides efficient, accessible cross-device tracking through Google Signals and User-ID-ideal for teams leveraging Google’s marketing stack. Meanwhile, Adobe Analytics excels with its enterprise-grade identity resolution and deeper integration with Adobe Sensei, making it the preferred choice for organizations needing highly personalized, real-time omnichannel analytics.

7. Privacy Compliance & Personally Identifiable Information (PII) Handling

With data privacy at the forefront of digital strategy in 2025, businesses must prioritize compliance with global standards like GDPR, CCPA, and India’s DPDP Act. Protecting Personally Identifiable Information (PII) such as names, emails  and phone numbers is no longer optional; it’s mission-critical for maintaining user trust and avoiding legal consequences.

  • Google Analytics 4 (GA4): Privacy-First by Design

    GA4 is built with privacy-by-default principles, restricting the collection of directly identifiable information to stay compliant with international data laws. While GA4 does not support storing PII, it allows secure, anonymized data enrichment via BigQuery for deeper behavioral analysis without compromising user privacy.Additionally, features like Consent Mode, IP anonymization and region-specific data controls empower businesses to align their analytics practices with user consent and regulatory requirements.

Best for: Organizations seeking a privacy-centric digital analytics tool that minimizes compliance risk and aligns closely with Google’s evolving privacy ecosystem.

  • Adobe Analytics: Flexible, Enterprise-Grade Data Governance

    Adobe Analytics provides greater flexibility for handling PII, enabling businesses to collect and store identifiable information when done in compliance with privacy laws. It offers advanced data governance features, such as field-level encryption, access control, and customizable data retention policies, making it ideal for enterprises with complex legal, security, and regulatory needs.Integrated with the Adobe Experience Platform, Adobe also supports secure identity resolution and audience segmentation while adhering to stringent global compliance protocols.

Best for: Enterprises in regulated industries (e.g., finance, healthcare, media) that require customized, privacy-compliant data strategies while maintaining rich user profiles.

In the comparison of Google Analytics vs Adobe Analytics on privacy and PII handling, GA4 is a strong choice for businesses that prioritize built-in compliance and anonymized insights. In contrast, Adobe Analytics offers more enterprise-level control and customization for companies that need to securely handle PII within their digital analytics tools.

8. Integration Ecosystem

In 2025, a robust integration ecosystem is no longer a “nice-to-have”, it’s a necessity for modern businesses navigating a complex digital landscape. Connecting your analytics platform with your marketing stack ensures real-time data flow, informed decisions, and seamless collaboration across marketing, sales, and customer experience functions. The deeper the integrations, the more actionable and unified your customer intelligence becomes.

  • Google Analytics 4 (GA4): Built for Google’s Digital Marketing Suite

    GA4 is natively designed to integrate with the broader Google Marketing Platform, making it a go-to solution for brands heavily invested in Google’s ecosystem. Key integrations include:

      • Google Ads - Optimize paid campaign performance with real-time attribution.
      • Search Console - Understand organic search impact alongside user behavior.
      • Display & Video 360 (DV360) - Track performance of programmatic display ads.
      • Google Ad Manager - Align ad monetization with user engagement.
      • BigQuery - Unlock powerful, SQL-based custom analysis at scale.
      • eCommerce platforms - Plug into Shopify, WooCommerce, and Magento for unified conversion tracking.
      • CRM tools - GA4 supports integrations via GTM, API, or connectors with platforms like Salesforce and HubSpot.

Best For: Businesses looking for tight integration with Google’s ad and analytics stack, especially in eCommerce, SaaS, and D2C environments where real-time optimization is key.

  • Adobe Analytics: The Ultimate Enterprise Connector

    Adobe Analytics delivers a powerhouse integration ecosystem through the Adobe Experience Platform, enabling seamless data exchange across Adobe’s suite and third-party tools. Highlights include:

      • Adobe Experience Cloud - Native integrations with Target, Campaign, Audience Manager, and Customer Journey Analytics for end-to-end personalization.
      • CRM & ERP - Deep integrations with Salesforce, Microsoft Dynamics, SAP, and more for customer lifecycle visibility.
      • Data Lakes & Warehouses - Supports Snowflake, AWS, Azure, and Google Cloud for unified enterprise data architecture.
      • Marketing Automation - Connects effortlessly with tools like Marketo, Eloqua, and Braze.
      • AI/ML Layer (Adobe Sensei) - Auto-enriches insights and enables predictive analytics across connected touchpoints.

Best For: Large enterprises and global organizations needing a scalable, API-rich solution with enterprise-grade integrations across marketing, sales, data science, and IT infrastructure.

In the Google Analytics vs Adobe Analytics integration showdown, GA4 is unbeatable for businesses already immersed in Google’s advertising and analytics ecosystem. Adobe Analytics, on the other hand, dominates in complex, enterprise analytics environments where deep customization, omnichannel orchestration, and advanced AI (powered by Adobe Sensei) are critical to success.

9. Data Export Capabilities

When it comes to digital analytics, raw data access and flexible export options are key for advanced reporting, BI integration, and deeper data modeling. Whether you’re generating executive-ready dashboards or performing SQL-based custom analysis, how an analytics platform handles data exports can define its usefulness in enterprise environments.

  • Google Analytics 4 (GA4): Flexible & Developer-Friendly

    GA4 makes data export simple and powerful, supporting a range of formats ideal for quick reporting, ad-hoc analysis, and advanced machine learning projects.Export capabilities include:

      • Standard Reports - Export data to CSV, Excel, Google Sheets, and PDF for lightweight reporting.
      • Google BigQuery Integration - Export raw, event-level data seamlessly to BigQuery for custom queries, AI/ML modeling, and joining with external datasets.
      • Google Looker Studio - Visualize GA4 data in real-time dashboards with native connectors.
      • API Access - Retrieve data programmatically for integration into third-party platforms or in-house BI tools.

Best For: Analysts, marketers, and developers who want granular control over analytics data, especially within Google’s cloud ecosystem.

  • Adobe Analytics: Enterprise-Grade Exports with Cloud Integration

    Adobe Analytics provides advanced data export options designed for enterprise-scale operations. In 2025, it supports:

      • Cloud Storage Destinations - Export datasets to Amazon S3, Microsoft Azure, Google Cloud Platform, and Snowflake for centralized storage and analysis.
      • Automated Spreadsheet Exports - Send scheduled reports via email (up to 10MB), ideal for recurring executive reporting.
      • Analysis Workspace - Download visualizations and reports in multiple formats, or schedule automatic deliveries to key stakeholders.
      • Data Feeds - Bulk data exports in near real-time to external environments for advanced data science and visualization workflows.

Best For: Large enterprises needing scalable, automated exports to multi-cloud environments and deep integration with internal data lakes or AI models powered by Adobe Sensei.

In the GA4 vs Adobe Analytics data export face-off, GA4 offers excellent flexibility and integration within the Google Cloud ecosystem, making it a favorite for data-savvy teams and startups. Meanwhile, Adobe Analytics excels in large-scale, enterprise analytics setups where complex multi-cloud pipelines, scheduled data feeds, and deeper control over raw data delivery are essential.

Conclusion: Choosing the Right Digital Analytics Platform in 2025

In today’s data-driven economy, selecting the right analytics platform is more than a technical decision-it’s a strategic investment in how your business understands, engages, and grows with its audience. Both Google Analytics 4 (GA4) and Adobe Analytics are industry-leading digital analytics tools, but they cater to different use cases, budgets, and operational complexities.

  • Choose Google Analytics (GA4) if:

      • You’re a small to mid-sized business or scaling startup that needs cost-effective analytics with rich features.
      • You want tight integration with Google’s advertising stack, including Google Ads, Search Console, and Display & Video 360.
      • You prefer a user-friendly interface with AI-powered insights and flexible event-based tracking.
      • You want the flexibility to export raw data via BigQuery for custom modeling and reporting.

GA4, especially in its free tier, delivers remarkable value for marketers and analysts alike, while GA4 360 caters to enterprises needing higher data thresholds, SLAs, and broader scalability making it ideal for digital-first brands and data-savvy organizations.

  • Choose Adobe Analytics if:

      • You’re a large enterprise requiring highly customizable reporting, real-time segmentation, and advanced attribution models.
      • You rely on enterprise analytics for complex customer journeys across multiple platforms and channels.
      • Your team uses the Adobe Experience Cloud and wants to leverage Adobe Sensei for predictive analytics, personalization, and AI-driven decision-making.
      • You need cloud-based data exports and deeper integration with enterprise data warehouses like Azure, AWS, and GCP.

Adobe Analytics is built for enterprise-grade performance. It excels in environments where marketing, sales and IT teams collaborate deeply, demanding flexible infrastructure, custom data modeling, and rich, actionable insights.

Book a Call Today and Get the Advanced GA4 Implementation Done for your Business


Mappls (MapMyIndia) vs Google Maps vs OpenStreetMap: Which Mapping Platform Is Best in 2025?

Mappls (MapMyIndia) vs Google Maps vs OpenStreetMap Which Mapping Platform Is Best in 2025 - Tatvic

What do you think “Which Mapping Platform Is Best in 2025: Mappls (MapMyIndia) or Google Maps or OpenStreetMap?”

In the automotive OEM (Original Equipment Manufacturer) space, MapmyIndia dominates with a market share of around 80-90%.  However, for consumer-end navigation, Google Maps is the dominant player, especially among Android users.

~The Hindu Business Line

In today’s competitive business landscape, where efficiency, visibility, and real-time data drive success, digital maps have evolved from simple navigation tools to essential business enablers. Whether you’re managing last-mile deliveries, tracking on-ground field agents, or helping customers find your nearest store, selecting the right digital map platform can dramatically enhance your operational precision.

Navigating business challenges often requires innovative solutions, and more often than not, maps emerge as powerful tools to chart success. Whether it’s listing store locations or monitoring the on-ground activities of your sales force, maps offer a plethora of solutions that can elevate your business to new heights. In this blog, we deep dive into MapmyIndia vs Google Maps vs OpenStreetMap and help you select the best digital map vendors based on their features, accuracy, and use case fit.

In this detailed 2025 guide, we compare MapMyIndia, Google Maps and OpenStreetMap, three leading digital mapping providers, to help you choose the best-fit solution for your business needs based on features, cost, data accuracy, interface, API support and user trust.

Overview of the Best & Leading Mapping Platforms in 2025:
Mappls (MapMyIndia) vs Google Maps vs OpenStreetMap

In the ever-evolving world of digital infrastructure, mapping technologies have become mission-critical for everything from logistics and mobility to smart cities and emergency services. Whether you’re building an app, optimizing delivery routes or integrating geospatial analytics into your operations, the right mapping platform can significantly impact your success.

Let’s explore the three most prominent players in the mapping space in 2025:

MapMyIndia (Mappls), Google Maps Platform and OpenStreetMap (OSM) each catering to unique business needs and market preferences.

1. MapMyIndia (Now Mappls): India’s Indigenous Mapping Leader

Founded in 1995, MapMyIndia, rebranded as Mappls, has emerged as India’s foremost homegrown digital mapping and geospatial data platform. Over nearly three decades, it has built a comprehensive stack of technologies tailored specifically for Indian terrain, infrastructure, and regulatory needs.

As of 2025, Mappls offers:

  • Highly detailed and hyperlocal maps of India’s urban and rural areas, including 3D landmarks, speed breakers, tolls, potholes, and safety zones
  • Real-time navigation and telematics services used extensively in electric vehicles, logistics fleets, and law enforcement
  • Developer-friendly APIs and SDKs for Maps, Routing, Geofencing, Geotagging, Navigation, and Live Tracking
  • AI-powered spatial analytics integrated with satellite imagery, IoT sensors, and drone data

With strategic collaborations across automotive, fintech, retail, and government sectors, Mappls has become the go-to choice for India-first enterprises seeking precision, compliance, and localization.

MapMyIndia (Now Mappls) Best suited for:

Businesses operating primarily in India that need granular, regulation-friendly, and hyperlocal mapping intelligence.

2. Google Maps Platform: Global Giant with Scalable Intelligence

As of 2025, Google Maps Platform powers over 5 million active apps and websites and maintains its dominance with a presence in 220+ countries and territories. With more than a billion monthly users, it remains the most familiar and widely trusted digital mapping solution globally.

Key highlights of Google Maps in 2025:

  • Maps, Routes, Places, and Environment APIs, now enhanced with Gen AI-powered contextual search and augmented reality (AR) overlays
  • New environmental datasets such as air quality forecasts, solar potential, tree canopy coverage, and flood zone prediction
  • Seamless integration with Google Cloud, Android Automotive, and major CRMs, enabling deep product and user experience personalization
  • Updated pricing structure in India with up to 70% cost reduction and ONDC-focused subsidies for government-linked platforms

Its intuitive UI, robust reliability, and deep developer support make it the top choice for businesses scaling globally or requiring premium features like dynamic routing, immersive street view, and predictive traffic analysis.

Google Maps Best suited for:

Enterprises needing global scalability, real-time precision, and integration with Google’s broader ecosystem.

3. OpenStreetMap (OSM): The Open-Source Backbone of Global Mapping

Created in 2004, OpenStreetMap (OSM) is a crowdsourced, community-driven mapping project known for its transparency, accessibility, and customization capabilities. It thrives on the contributions of millions of mappers worldwide who collect and upload data daily.

In 2025, OpenStreetMap stands out with:

  • Editable, raw geographic data ideal for building bespoke geospatial applications
  • Complete freedom from commercial licenses, making it a powerful option for startups, research institutions, and humanitarian agencies
  • Compatibility with open-source mapping libraries and visualization tools like Leaflet.js, Mapbox, OSMnx, and QGIS
  • Used by organizations like Meta, Microsoft, Amazon, and Humanitarian OpenStreetMap Team (HOTOSM) to build internal tools, humanitarian maps, and offline applications

While OSM’s base platform lacks the polish of commercial competitors, its strength lies in flexibility, cost-efficiency and the power of global collaboration. It’s especially useful for remote or underserved areas where major providers may lag.

OpenStreetMap Best suited for:

Tech-savvy teams looking for full control, budget-conscious projects, and open-source-centric geospatial development.

Tatvic’s Case Snippet: Optimizing Delivery Routes for a Hyperlocal Grocery Brand using Google Maps API

Client: Leading Hyperlocal Grocery Chain in Tier 1 & Tier 2 Cities
Challenge: Inefficient last-mile delivery due to inaccurate location clustering and lack of real-time traffic insights.

Tatvic’s Solution:

  • Implemented Google Maps Directions API with live traffic overlays
  • Integrated Geocoding API for accurate pin-to-door navigation
  • Built a custom dashboard to monitor delivery ETAs and rerouting triggers

Outcome:

  • 23% reduction in delivery time
  • 17% improvement in customer satisfaction score (CSAT)
  • ₹8.6L annual cost savings via route optimization

Mappls (MapMyIndia) vs Google Maps vs OpenStreetMap: 2025 Detailed Comparison Table

Choosing the right mapping platform can significantly influence your product performance, cost-efficiency, and user experience.

This side-by-side comparison evaluates MapMyIndia (Mappls), Google Maps, and OpenStreetMap (OSM) across critical parameters to help you decide the best fit for your business in 2025.

The Major Differences: MapMyIndia vs Google Maps vs OpenStreetMap

Feature

MapMyIndia (Mappls)

Google Maps Platform

OpenStreetMap (OSM)

Map Data Updates
Updates every 6 months with a focus on local details like road conditions, real-time traffic monitoring updates, and unsafe road information. Real-time global updates powered by AI, user feedback, and satellite data. Relies on community updates, leading to frequent and agile changes. However, updates can be uneven globally due to reliance on users.
User Interface (UI)
Busy interface with rich local details, similar in look and feel to Google Maps. Ideal for operations requiring detailed information in India. Clean, precise, and user-friendly. Two different map types with details like terrain, transit, and traffic. Best suited for a diverse audience and various use cases worldwide. A simpler interface is less granular compared to others and is more suited for basic navigation needs.
APIs & SDKs
Mapping APIs: Includes API’s for Maps, Search and geocoding, Routes and navigation, Route planning and optimization.

Analytics APIs: Includes APIs for GIS and Analytics APIs

Telematics APIs: Includes API’s for Mobility and tracking, Workmate APIs.

Maps: Includes APIs for Aerial view, Dynamic maps, Dynamic street maps, Elevation, Map tiles, Map Datasets, Maps Embed, and Static Street View.

Routes: Includes APIs for Directions, Direction matrix, Roads, Compute routes, and Compute routes matrix.

Places: Includes APIs for Address validation, Autocomplete (automatic suggestion of places), Current place, Geocoding, Geolocation, Nearby search,  Place details, Place photos, Text search, and Time zone.

Environment: Includes APIs for Air quality mapping, Pollen mapping, Solar mapping

Overpass API: Powerful query language for retrieving OpenStreetMap data based on geographical criteria and custom filters. Used for downloading map data, finding specific features, and analyzing spatial relationships.

Nominatim API: Geocoding service that converts addresses into geographical coordinates (latitude and longitude) and vice versa.

Others: Several community-developed APIs exist for specific purposes like rendering maps (Leaflet,
Mapbox), editing OpenStreetMap data (JOSM), and routing (OSMnx).

~Cost (As in 2025)
Offers a free tier for individual users with limited features. Paid plans range from $302/month for 10,000 API calls to $605/month for 50,000 API calls (as per one source). In July 2024, Google has announced a 70% reduction in cost for Maps for India. Additionally, for ONDC projects, up to 90% discounts are available on selected APIs. This makes Google Maps the most competitive in terms of price against the features it offers. Free to use as it’s community-driven. Costs may be associated with third-party APIs built on top of OpenStreetMaps.
Notable Users
Notable brands like McDonald’s India, Maruti Suzuki, Mahindra, Ather Energy and PhonePe. Ideal for companies focusing on the Indian market. Used by a range of businesses globally, including Swiggy, Zomato, Uber, Amazon, Ola, Dunzo and MakeMyTrip in India.
Suitable for businesses with global presence or high-volume usage.
Employed by Meta, Red Cross, HOTOSM, Craigslist. Popular among cyclists, hikers, and mountaineers for specialized maps (e.g., OpenCycleMap).
Developer Support
Localized documentation and onboarding, India-based tech support. Robust SDKs, forums, and documentation via Google Cloud Console. Community-powered support via forums, wikis, and GitHub repos.
Best Suited For
Best suited for operations that focus solely on Indian map applications and need rich local details.

India-focused companies needing hyperlocal intelligence and regulatory alignment.

Not ideal for global expansion in the short term.


Industry leader with a global reach and comprehensive functionality. Ideal for new-age or traditional businesses seeking an easy-to-adapt platform with global adaptability.


Suitable for businesses with stringent budget considerations or proponents of open-source technology, but requires more development efforts for complete functionality.

We have seen a quick comparison among of the Best & Leading Mapping Platforms in 2025 in tabular format. Now Let’s see the comparison in depth->>

Mappls (MapMyIndia) vs Google Maps vs OpenStreetMap: Feature by Feature Detailed Comparison

In 2025, businesses have multiple mapping platforms to choose from, each catering to different needs, be it local accuracy, global scalability or open-source flexibility.

This feature-by-feature comparison dives deep into critical aspects such as map updates, UI, pricing, APIs and best-use cases.

Whether you’re a logistics startup, a global enterprise, or a tech-savvy NGO, this guide helps you make an informed decision based on your unique operational requirement

1. Map Data Accuracy and Updates

Map Data Accuracy and Updates refer to how frequently and precisely a mapping platform refreshes its geographic data to reflect real-world changes. High accuracy ensures reliable navigation, optimized routing, and better user experiences, especially in dynamic or high-growth regions

Why It Matters:

Accurate and up-to-date mapping data is non-negotiable in today’s fast-paced, hyperconnected economy. Whether you’re navigating urban traffic, planning last-mile deliveries, or deploying on-ground teams, outdated maps can lead to costly detours, missed SLAs, and dissatisfied customers. In 2025, where digital maps power everything from EV routing to drone logistics, the frequency and precision of updates are mission-critical.

MapMyIndia (Mappls): Hyperlocal Accuracy for India:

MapMyIndia, now branded as Mappls, stands out for its deep focus on Indian geospatial nuances. Updated twice a year, the platform offers hyperlocal intelligence including:

  • Real-time road hazard alerts (potholes, speed breakers, waterlogging)
  • Safety markers like accident-prone zones and illegal U-turns
  • Granular address-level data with detailed landmark tagging
  • Integration with government sources like MoRTH and Smart City initiatives

In 2025, Mappls also supports EV route optimization and detailed village-level mapping under the Digital India initiative. It’s a go-to for logistics firms, delivery apps, and fleet operators who need precision in Tier 2/3 cities and rural belts.

MapMyIndia (Mappls) is Best for:

India-focused businesses that need regulatory-compliant, real-world mapping fidelity.

Google Maps: Global Data, Real-Time Intelligence

Google Maps continues to dominate on a global scale with daily updates derived from:

  • High-resolution satellite imagery
  • Street View fleets and drones
  • Crowdsourced data from 1B+ Android devices
  • AI-powered traffic and construction detection

As of 2025, Google Maps also integrates AI-generated 3D maps, climate overlays (like air quality, pollen, solar energy zones), and environmental impact data, making it invaluable for businesses operating across geographies.

Google Maps is Best for:

Scalable global operations, ride-hailing platforms, and companies needing up-to-the-minute data across multiple regions.

OpenStreetMap (OSM): Open-Source Mapping With Grassroots Power

OpenStreetMap thrives on its volunteer-driven model, offering highly frequent updates in areas with active contributors. It supports:

  • Editable map layers for custom deployments
  • Community-verified POIs and trails
  • Extensive tagging options for niche use cases (e.g., wheelchair access, hiking paths)

While it shines in urban centers with engaged mappers, data consistency can vary in remote or underdeveloped regions. However, in 2025, the rise of humanitarian organizations and open-data initiatives has greatly improved coverage in Africa, Southeast Asia, and remote India.

OpenStreetMap (OSM) is Best for:

Nonprofits, civic tech developers, GIS researchers, and startups favoring low-cost, customizable, and ethical solutions.
Tatvic Case Study 2: MapMyIndia Integration for an Indian EV Manufacturer

Client: Fast-growing EV two-wheeler brand in India
Challenge: Google Maps failed to provide detailed POI data in non-metro towns where charging stations were placed.

Tatvic’s Solution:
  • Switched to MapMyIndia’s location APIs with rural coverage
  • Deployed reverse geocoding to align location tags with charging infrastructure
  • Enabled real-time tracking with MapMyIndia Telematics API
Outcome:
  • 32% increase in charging station visibility
  • 41% reduction in customer support tickets related to location errors
  • Enhanced brand credibility in under-served regions

2. User Interface and Experience

A mapping platform’s interface isn’t just about looks-it directly impacts usability, decision-making, and operational efficiency. In 2025, businesses need intuitive, responsive, and context-rich UIs that support both customers and internal teams. The right experience can streamline workflows, reduce errors, and enhance overall satisfaction.

Why It Matters:

In 2025, the user interface (UI) and overall experience (UX) of a mapping platform aren’t just cosmetic-they’re strategic. A well-designed UI enhances productivity, reduces training time for internal teams, and creates a seamless experience for end-users across logistics, e-commerce, real estate, mobility, and field operations. As maps become embedded into core business workflows, a platform’s usability directly influences adoption rates, decision-making speed, and customer satisfaction.

Google Maps Platform: Enterprise-Grade UI with Consumer Simplicity

Google Maps remains the gold standard in UI/UX. With a clean, clutter-free interface and lightning-fast load times, it provides fluid zooming, dynamic layer toggling, and intuitive controls across devices.

With over 3.6 billion Android smartphones worldwide, GoogleMaps stands out as having the best interface. The extensive user base gives Google the credibility of having an interface that is well-received by a diverse audience with various use cases. At first glance, the interface of Google Maps is clean, precise, and user-friendly. Featuring two different map types, with multiple map details like terrain, transit, traffic, and more, it allows a user to navigate based on their requirements.

As of 2025, its advanced rendering includes:

  • Immersive View: Realistic 3D environments for key landmarks and urban areas
  • Live Transit & Traffic Layers: Real-time overlays for buses, metros, traffic congestion, and alternate routes
  • Personalized Maps: AI-curated suggestions based on user behavior and preferences
  • Responsive Design: Optimized for mobile, desktop, AR, and even in-car navigation units

This makes Google Maps a go-to choice for B2C and B2B applications where aesthetics, real-time accuracy, and frictionless UX matter most.

This is how Google Maps looks like - Tatvic

Google Maps is Best For:

Businesses prioritizing a polished, ready-to-deploy mapping UI with global consistency

MapMyIndia (Mappls): Localized Intelligence in a Familiar Format

MapMyIndia has significantly upgraded its UI as part of its Mappls brand evolution. Designed with India’s unique navigation challenges in mind, it blends familiarity (resembling Google Maps in layout) with enriched, hyper-local insights:

  • Localized Layers: Speed breakers, potholes, no-parking zones, electric vehicle charging stations
  • Voice Navigation in Indian Languages: Supports 10+ languages, crucial for field teams and delivery agents
  • Region-Specific Icons and Labels: Clearly marked landmarks and street-level nuances rarely captured by global platforms
  • Traffic and Safety Widgets: Integrated road hazard alerts and smart traffic predictions using IoT signals

It’s ideal for enterprises operating in Indian metros, tier-2/3 cities, and rural regions where local detail can mean the difference between operational success and failure.

This is how MapMyIndia looks like - Tatvic

MapMyIndia is Best For:

Indian enterprises needing localized, granular map interfaces with regional language support

OpenStreetMap (OSM): Customizable Canvas for Developers and Innovators

OpenStreetMap’s UI is intentionally minimal, making it more of a starting point than a finished product. What it lacks in visual refinement, it makes up for with flexibility:

  • Open-Source Frontends: Leverage tools like Leaflet, MapLibre, or custom renderers to build tailored UIs
  • Editable Layers: Users can add or remove features, roads, or landmarks in near real-time
  • Community Tools: Projects like OpenCycleMap or Humanitarian OpenStreetMap offer themed visual layers for specific use cases
  • Offline Capabilities: Easy integration with offline apps for disaster zones, remote areas, and NGOs

For startups, civic tech, humanitarian efforts, or cost-sensitive enterprises with in-house tech talent, OSM offers a unique canvas to build completely custom mapping experiences.

This is how OpenStreetMaps looks like - Tatvic

OpenStreetMap (OSM) is Best For:

Organizations seeking full control over map UI/UX or building niche, open-source mapping solutions

3. API & Developer Ecosystem

A strong API and developer ecosystem is crucial for integrating advanced mapping capabilities seamlessly into your applications. In 2025, versatile, reliable, and well-supported APIs empower businesses to innovate quickly, customize features, and scale efficiently. Choosing the right platform with a rich set of developer tools can significantly enhance your product’s location intelligence and user experience.
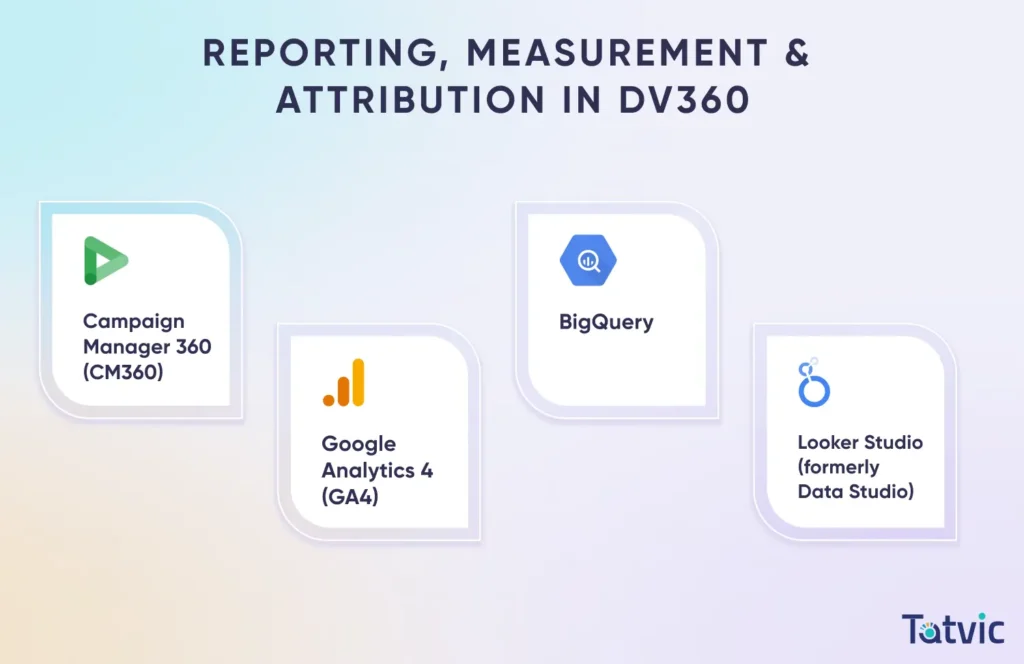
While incorporating maps in your mobile app or website, it is important to select the platform with the right APIs and SDKs. This helps you to fetch the features of those platforms into your app or website and make the experience more intriguing for your users.

Why It Matters:

In 2025, APIs form the backbone of modern mapping solutions, empowering developers to seamlessly integrate, customize, and extend location services within apps and platforms. From real-time tracking and geofencing to advanced spatial analytics and immersive AR experiences, a rich API ecosystem accelerates innovation and improves operational efficiency.

OpenStreetMap APIs & Tools:

  • Overpass API enables highly customizable queries for tailored data extraction
  • Nominatim provides free, open-source geocoding and reverse-geocoding services
  • Integration with third-party open-source tools such as Leaflet, Mapbox, and OSMnx for map rendering, interactivity, and routing flexibility
  • Ideal for developers seeking full control and adaptability without licensing constraints
OpenStreetMap (OSM) is Best For:

For open-source enthusiasts and projects that require customizable, cost-effective mapping solutions with hands-on developer involvement.
If you are working on stringent budget considerations or are a proponent of open-source technologies, then you can consider OpenStreetMaps. However, this entails more development efforts to achieve complete functionality. 

List of OpenStreetMap API - Tatvic

Google Maps Platform: APIs & Tools:

  • Cutting-edge Augmented Reality (AR) and AI-driven mapping features enabling immersive user experiences
  • Environment-focused APIs including Solar Mapping, Pollen Index, and Air Quality Data to support sustainable decisions
  • Advanced Place Intelligence APIs offering sentiment analysis, user activity heatmaps, and dynamic place details for rich contextual insights
  • Well-documented, scalable APIs designed for global enterprises with diverse use cases
Google Maps is Best For:

For plug-and-play, enterprise-grade APIs backed by extensive documentation and innovation.
Using Google Maps for your apps and websites would be the easiest choice since it’s hassle-free and is an industry leader. Its established reputation and technical reliability make it particularly appealing for businesses with an established presence or anticipating high-volume usage in the future. Furthermore, Google Maps offers the most comprehensive functionality in this domain.

Google Maps Platform: APIs & Tools: - Tatvic

(Note: If you want to know how to get the Google Maps API key, then click to view this blog.)

MapMyIndia API Suite Includes:

  • Comprehensive Maps, Geocoding, and Search APIs tailored for Indian geographies
  • Advanced Route Optimization for logistics and last-mile delivery
  • Real-time Vehicle Tracking and Fleet Telematics for enhanced operational control
  • Powerful GIS Analytics supporting location intelligence and business insights
MapMyIndia is Best For:

If you focus solely on the Indian map applications and have no plans to expand overseas shortly, considering MapMyIndia APIs for your websites and apps with robust analytics  could be a strategic move.

MapMyIndia API Suite - Tatvic

Tatvic Case Study 3: Using OpenStreetMap for a Social Impact Project

Client: International NGO operating in flood-prone zones
Challenge: Need for accurate, editable maps to deploy emergency aid in remote districts of Assam

Tatvic’s Solution:
  • Used OpenStreetMap with Overpass API and Leaflet.js for a custom flood alert map
  • Integrated with community-generated data layers and predictive rainfall APIs
  • Trained field volunteers to update map layers in real-time using OSM tools

Outcome

  • 100+ new POIs (evacuation shelters, medical camps) added within 3 weeks
  • Reduced data dependency on third-party vendors
  • Real-time local updates improved aid distribution by 28%

4. Cost and Licensing (2025 Updates)

Balancing functionality with affordability is critical in 2025, especially as apps scale and location data usage grows exponentially. Choosing the right mapping platform means understanding not just base costs, but hidden licensing terms, scalability options, and long-term ROI. Here’s how Google Maps, MapMyIndia, and OpenStreetMap compare on cost and licensing.

Why It Matters:

In 2025, cost efficiency is as crucial as functionality, especially for scaling startups, mobility platforms, logistics operations, and enterprise applications handling millions of API calls monthly. Choosing a location platform that fits your budget without compromising on features can lead to significant long-term savings and predictable ROI.

Perhaps in this comparison of MapMyIndia v/s Google Maps v/s OpenstreetMaps, the cost is the most important decision when it comes to selecting the right map platform. Most map platforms have a certain threshold of free usage of the APIs, and if your usage goes beyond that, you are required to pay. While assessing the price, make sure that the API is effectively addressing the specific requirements of your project as well.

Tip: Selecting the correct APIs and optimizing them can help you reduce your cost. For more details, consult with our team.

Google Maps Platform (2025 Pricing Advantage):
Google significantly revamped its pricing structure in 2024, making its platform far more affordable in India and emerging markets.

With Google Maps, the free tier includes 28,500 map loads per month worth $200 for static maps and basic functionalities. For higher usage or advanced features, Google Maps API pricing starts at around $7 per 1,000 API calls and can go up to $16 or more for specific features. You can also estimate your monthly cost based on your Google Maps usage from here.

  • Up to 70% reduced pricing in India for commercial users
  • 90%+ discounts for ONDC-aligned businesses, startups under DPIIT, and government-linked platforms
  • $200 free monthly credit, which translates to approximately 28,000 static map loads or equivalent API usage
  • Flexible pay-as-you-go billing model with usage-based scalability
  • Ideal for companies needing enterprise-grade reliability at competitive cost
Google Maps Platform is Best For:

Best for scalable, global applications with rich features and dynamic pricing

MapMyIndia (Mappls) Pricing (2025):

Focused on the Indian market, MapMyIndia offers transparent and region-specific pricing.

Working on a similar model to Google Maps, MapMyIndia offers a free tier for individual users with limited features. It includes basic functions like navigation and search. Although not available publicly, as per one source, paid plans range from $302 per month for 10,000 API calls to $605 per month for 50,000 API calls.

  • Plans start at ₹25,000/month (~$300) for 10,000 API calls
  • Enterprise-grade solutions come with custom pricing, white-label options, and SLA-based support
  • Offers fixed billing cycles, great for organizations looking to budget precisely with no usage surprises
  • API bundles often include tracking, analytics, and vehicle telematics tailored to Indian terrains and routes
MapMyIndia is Best For:

Optimal for businesses operating in India that need hyper-local data and fixed, predictable billing

OpenStreetMap (OSM) - The Free & Open-Source Choice:

Being an open-source platform, OpenStreetMaps is free to use as it is community-driven. However, if you are using third-party APIs built on top of OpenStreetMaps, it might have its pricing structure.

  • Completely free to use under the Open Database License (ODbL)
  • No direct licensing costs, but businesses may incur fees for integration, hosting, or enhanced capabilities from third-party services like Mapbox, CARTO, or GraphHopper
  • Ideal for developers and non-profits looking for unrestricted access to geospatial data
  • No usage quotas or API call limits when self-hosting or using open-source tools
OpenStreetMap is Best For:

Perfect for open-source projects, NGOs, and developers seeking customization without recurring costs

5. Trusted by Industry Leaders (Users)

The world’s top brands rely on these platforms to power logistics, navigation, and geospatial intelligence, reflecting their credibility, scalability, and performance in real-world use cases.

Why It Matters:

When top enterprises choose a mapping platform, it’s not just about features-it’s about performance, reliability, compliance, and strategic partnerships. These industry endorsements offer a clear signal of trust, especially in sectors like logistics, eCommerce, ride-hailing, fintech, and public services where location accuracy is mission-critical.

Platform

Notable Users (2025)

MapMyIndia (Mappls)
Maruti Suzuki, Mahindra & Mahindra, Flipkart, PhonePe, McDonald’s India, Indian Oil, Delhivery, Tata Motors, SBI, and several smart city initiatives.
Google Maps
Swiggy, Zomato, Amazon, Uber, Ola, BigBasket, MakeMyTrip, Zepto, RedBus, Meesho, and ONDC-partner platforms like Paytm and JioMart.
OpenStreetMap (OSM)
Meta (for base map layers in Facebook), Craigslist, Wikimedia Foundation, Humanitarian OpenStreetMap Team (HOTOSM), OpenCycleMap, and Mapillary (NVIDIA).

What This Tells You:

  • MapMyIndia is the go-to choice for India-centric enterprises that demand localized precision and government compliance. Its adoption by automotive giants and public sector projects reflects its robust integration capabilities and Bharat-specific mapping layer.
  • Google Maps continues to dominate in globally scaled digital businesses, offering real-time data, cloud-native APIs, and seamless UX that companies like Uber, Amazon, and Swiggy trust to run high-volume, consumer-facing platforms.
  • OpenStreetMap is embraced by tech innovators and mission-driven organizations who prefer open data, control, and cost-efficiency. Its growing popularity in sustainability and humanitarian sectors makes it ideal for NGOs, research institutions, and independent developers.

Leading Mapping Platforms are Best For: From Users POV:

  • MapMyIndia: Enterprises operating in India with high dependence on localized infrastructure, compliance, and fleet management
  • Google Maps: Global tech platforms seeking scalable, polished mapping APIs with rich feature layers and multi-device compatibility
  • OSM: Organizations looking for open-source flexibility, customization, or mapping in underserved or niche regions

MapMyIndia counts McDonald’s India, Maruti Suzuki, Mahindra, and PhonePe among its users, reflecting the platform’s adoption by notable brands across different sectors.

Companies that use MapMyIndia - Tatvic

Google Maps finds applications in a diverse range of businesses in India, including Swiggy, Zomato, MakeMyTrip, and many digital native businesses.

Companies that use Google Maps - Tatvic

Some of the prominent users of OpenStreetMaps are Meta and Craigslist. Cyclists, hikers, and mountaineers use specialized maps based on OpenStreetMap data (e.g., OpenCycleMap).

Companies that use OpenStreetMaps - Tatvic

Which Mapping Platform Should You Choose in 2025:
Mappls (MapMyIndia) vs Google Maps vs OpenStreetMap

Business Scenario

Recommended Platform

India-first company, with no plans for global expansion MapMyIndia
Global or scalable business needing ease of use, robust support Google Maps
Startup or NGO with technical teams and open-source preference OpenStreetMap

Final Thoughts: There’s No One-Size-Fits-All in Mapping Platforms

After dissecting the strengths, limitations, and use cases of Mappls (MapMyIndia), Google Maps, and OpenStreetMap, it’s clear there’s no definitive winner.

The best mapping platform for your business depends on several factors:

  • your geographic focus,
  • development bandwidth,
  • integration needs, and
  • budgetary constraints.

That said, if you’re a digital-first company or even a traditional business aiming to modernize your operations with a globally reliable, scalable and easy-to-implement mapping solution, then Google Maps Platform remains a top contender.

Its significant price slash in India (up to 70%), generous monthly credits and ONDC-specific discounts make it more accessible than ever in 2025.

Why Choose Tatvic to Integrate Google Map Platform?

As a Google Premier Partner, Tatvic has deep technical expertise and strategic know-how to help businesses leverage the full power of Google Maps APIs, whether it’s for hyperlocal delivery optimization, real-time tracking, geofencing, or route intelligence.

They don’t just help you integrate mapping tech we ensure it fuels measurable business outcomes.

Let Tatvic’s experts help you choose, implement, and optimize the best mapping platform tailored to your business goals.

From Google Maps API consulting to full-scale location intelligence integrations, we’re here to guide you every step of the way.

👉 Contact Us Today or explore our Google Maps API Consulting & Implementation Services to get started.

Power BI vs Looker BI: Which BI Tool Should You Choose in 2025?

Power BI vs Looker BI Which BI Tool Should You Choose in 2025 - Tatvic

Power BI vs Looker BI: Which Business Intelligence (BI) Tool Deserves the Crown in 2025?

In today’s data-first world, choosing the right Business Intelligence (BI) tool isn’t just about analytics, it’s about enabling smarter decisions, faster growth, and competitive advantage. As we enter 2025 and beyond, Microsoft’s Power BI and Google Cloud’s Looker BI lead the charge.

Whether you’re aiming for cost-efficiency, scalability or advanced data governance, the choice between Power BI and Looker BI can shape your analytics journey for years to come.

 This guide presents a narrative comparison, not just specs and tables, but real-world insights from a team that’s been in the trenches.

Whether you’re a startup or a data-mature enterprise, this blog will help you pick the tool that fits your data journey.

At Tatvic, we’ve helped businesses across industries implement both platforms.

What are Business Intelligence (BI) Tools?

Business Intelligence (BI) tools are powerful software platforms designed to help organizations make sense of their data.

They gather, analyze, and visualize structured and unstructured data from multiple sources like CRM systems, databases, and cloud applications to provide actionable insights. With BI tools, businesses can monitor performance, predict trends, and optimize operations with greater speed and accuracy.

Among the leading BI platforms in 2025, Power BI by Microsoft stands out for its ease of use, affordability, and seamless integration with the Microsoft ecosystem. It empowers users to build interactive dashboards and reports without needing deep technical skills.

On the other hand, Looker BI (now part of Google Cloud) is a cloud-native solution built for data engineering-heavy teams. It excels in centralized data modeling, semantic consistency through LookML, and deep integration with Google BigQuery-making it ideal for enterprises with complex, cloud-first data infrastructures.

Whether you’re a startup looking to adopt self-serve analytics with Power BI software or a data-mature organization seeking semantic governance with Looker BI, the right BI tool can transform how you make business decisions.
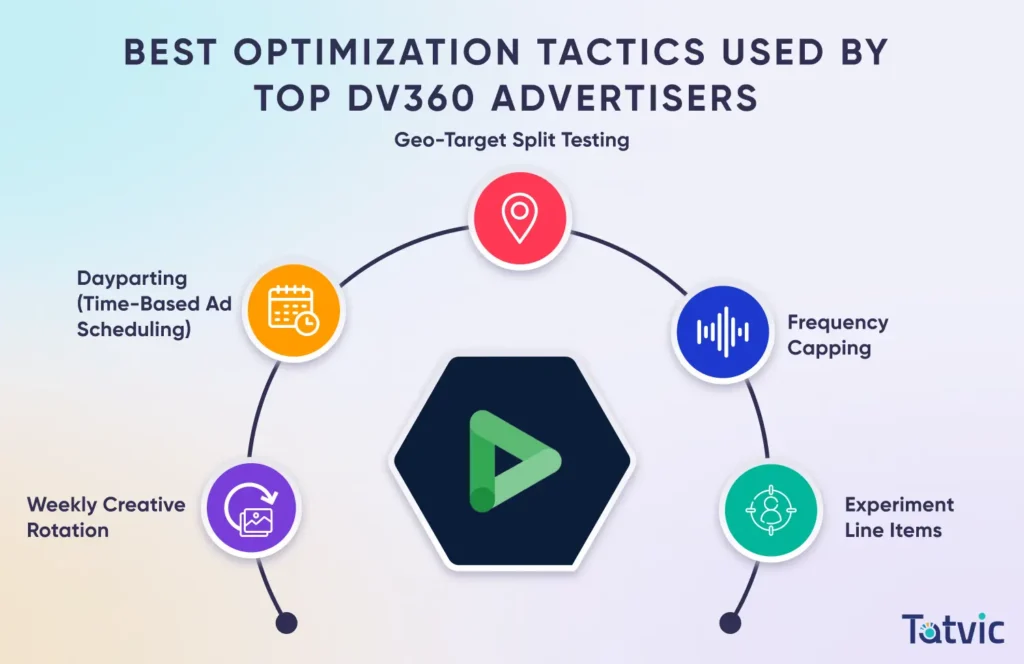
Here’s a humanized, SEO-friendly list of key features businesses expect from Business Intelligence (BI) tools in 2025, with an emphasis on what makes tools like Power BI and Looker BI stand out:

Key Features To Expect from Business Intelligence (BI) Tools

In today’s fast-paced business environment, choosing the right Business Intelligence (BI) tool means looking beyond basic reporting.

Modern BI platforms must empower users with advanced capabilities that drive smarter decision-making, ensure data accuracy, and integrate seamlessly into existing workflows.

Whether it’s for small teams or large enterprises, these key features define what organizations should expect from their BI investments in 2025.

Essential Features to Look for in Modern Business Intelligence (BI) Tools

  1. User-Friendly Dashboards:

    Intuitive, drag-and-drop interfaces enable users of all skill levels to create interactive reports and visualizations without heavy reliance on IT teams.

  2. Advanced Data Modeling:

    Robust data modeling capabilities allow for complex calculations and relationships, ensuring accurate, consistent metrics across the organization.

  3. Real-Time Data Analytics:

    Access to live data and real-time dashboards ensures timely insights, helping businesses react swiftly to market changes.

  4. Data Governance & Security:

    Centralized controls for data access, versioning, and compliance maintain trust and protect sensitive information across teams.

  5. Integration with Ecosystems:

    Seamless connectivity with popular tools and cloud platforms maximizes BI value and fits naturally within existing technology stacks.

  6. Custom Visualizations & Embedded Analytics:

    Flexibility to build tailored visuals and embed analytics within other applications enhances user engagement and operational workflows.

  7. Scalability and Performance:

    BI tools must efficiently handle growing data volumes and complex queries without sacrificing speed or reliability.

  8. Mobile Accessibility:

    Responsive mobile apps empower decision-makers to access insights anytime, anywhere, boosting productivity on the go.

  9. AI & Predictive Analytics:

    Artificial intelligence capabilities, such as natural language queries and predictive modeling, help surface deeper insights and future trends.

What is Power BI? 

Power BI is Microsoft’s advanced business intelligence software that transforms complex datasets into visually compelling and actionable insights. Tailored for both technical and non-technical users, Power BI enables businesses of all sizes to make confident, data-driven decisions.
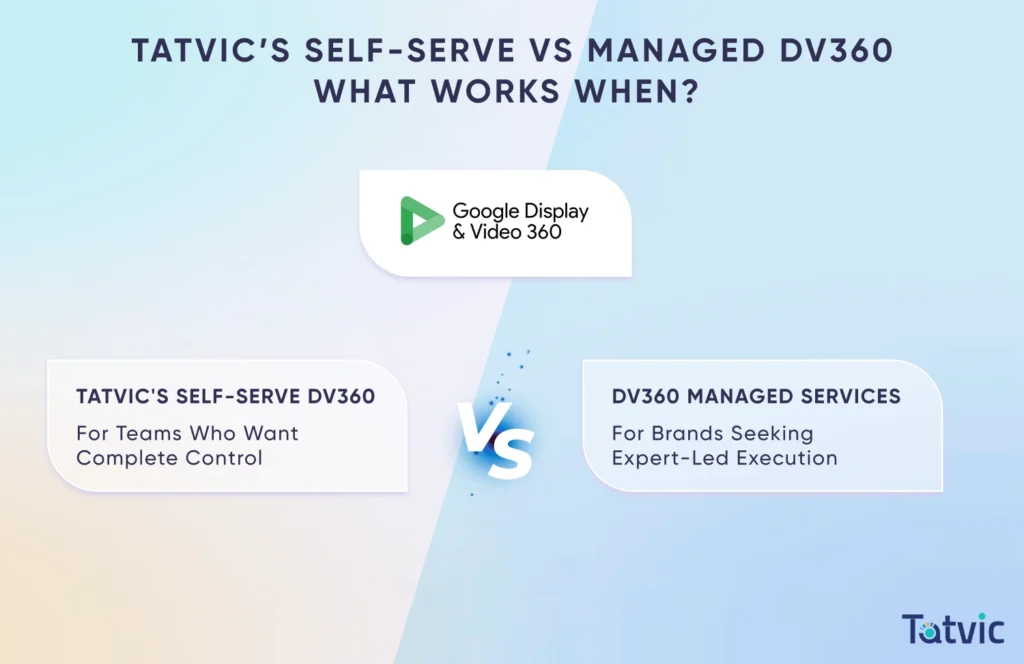
As of 2025, it remains a market leader in power business intelligence platforms due to its scalability, ease of use, and deep integration with the Microsoft ecosystem.

Power BI bridges the gap between raw data and strategic action. Whether you’re a startup exploring basic KPIs or a global enterprise monitoring performance across departments, this tool offers the flexibility and depth you need.

It supports data ingestion from hundreds of sources ranging from spreadsheets and databases to APIs and cloud services like Azure, Google Analytics, Salesforce and more.

Power BI’s Standout Features: The seamless integration with Office 365, Microsoft Teams, Excel, SharePoint, and Azure Synapse allowing users to build, collaborate, and deploy dashboards right within their existing workflow.

Power BI’s strong security model ensures enterprise-grade governance with role-level permissions, data loss prevention, and integration with Microsoft’s Purview and Azure Active Directory.

Key Highlights of Power BI in 2025:

  • User-Friendly Dashboards: Intuitive drag-and-drop report builder, ideal for business users and analysts alike
  • Advanced Data Modeling: Use DAX (Data Analysis Expressions) and Power Query Editor for powerful custom calculations and transformations
  • Smart AI Features: Natural language queries, automated insights, anomaly detection, and predictive analytics
  • Cross-Platform Availability: Fully functional across desktop, web, and mobile with real-time sync
  • Vast Integration Ecosystem: Supports over 150 data connectors like: SQL Server, Excel, Oracle, Google BigQuery, Salesforce and more
  • Collaboration Made Easy: Share reports securely via Power BI Service, embed visuals in Microsoft Teams, or publish to the web

Tatvic SME Insight: Many of our clients choose Power BI software as the foundation of their analytics journey due to its low barrier to entry and high return on investment. It’s especially popular among companies looking to unify reporting across departments without needing a dedicated team of data engineers.
What is Looker BI?

Looker BI, now a core part of Google Cloud’s data analytics suite, is a modern, cloud-native business intelligence platform designed for organizations that prioritize scalability, data governance and real-time decision-making.
Built around a semantic modeling language called LookML, Looker offers unparalleled control over how data is defined, transformed and consumed ensuring consistency and clarity across business units.

As of 2025, Looker has evolved into a preferred solution for data-driven enterprises, particularly in sectors like SaaS, finance, eCommerce, and digital platforms. It empowers teams to go beyond dashboards enabling embedded analytics, real-time data applications, and customizable visual experiences.

Unlike traditional drag-and-drop BI tools, Looker BI promotes a code-based approach to analytics, making it ideal for businesses with strong data engineering or analytics teams who want to build centralized data models that scale securely.

Key Highlights of Looker BI in 2025:

  • Semantic Layer via LookML: Maintain a single source of truth with reusable logic and business definitions that power every report or dashboard
  • Native BigQuery Optimization: Deeply integrated with Google BigQuery and other cloud warehouses for lightning-fast performance
  • Git-Based Version Control: Full development workflow control, enabling collaboration, versioning, and rollback like software development
  • Embedded & Customizable Analytics: Ideal for creating branded, embedded dashboards within apps, SaaS products, and customer-facing platforms
  • End-to-End Governance: Centralized data governance and permissioning ensure data quality and compliance at scale
  • Extensibility: Easily integrates with modern tools and workflows-dbt, Airflow, Fivetran, and reverse ETL platforms

Tatvic SME Insight: For clients building data-first products or wanting to monetize their data through APIs or embedded insights, Looker is often the go-to solution. It’s a long-term investment, but one that offers immense flexibility and governance.

Quick Comparison Between Power BI vs Looker BI

Power BI is ideal for business users seeking ease of use, low-cost deployment, and deep integration with the Microsoft ecosystem. It shines in self-service analytics and interactive reporting.

On the other hand, Looker BI is built for enterprises that prioritize data governance, scalability, and embedded analytics, especially within Google Cloud environments.

While Power BI software empowers faster time-to-insight with its visual-first interface, Looker’s semantic modeling allows for consistent, centralized data definitions across teams making both powerful tools for modern business intelligence needs.

Let’s See The Comparison Between Power BI vs Looker BI in Detail

Feature
Power BI
Looker BI
Developer Microsoft Google Cloud (Alphabet Inc.)
Interface Type Drag-and-drop GUI Web-based (LookML modeling)
Pricing Model Freemium + Pro + Premium Custom, enterprise-tier only
Learning Curve Low to Moderate Medium to High (SQL, LookML)
Ideal For SMBs to Large Enterprises Data-mature, cloud-native orgs
Data Modeling Power Query, DAX LookML
Visuals Highly customizable Clean, developer-focused
Embedded Analytics Yes Yes
Cloud Support Azure, AWS, GCP Native to Google Cloud

Detailed Comparison Between Power BI vs Looker BI: Feature-by-Feature Breakdown

Choosing between Power BI and Looker BI in 2025 is not just about dashboards, it’s about aligning the right BI software with your data culture, business size and long-term analytics vision.

At Tatvic, we’ve worked hands-on with companies ranging from fast-moving startups to highly regulated enterprises and here’s what we’ve learned.

Why Teams Choose One Over the Other?

Power BI (The Champion for Accessibility):

Power BI software is loved for its simplicity without sacrificing analytical strength. Its drag-and-drop interface, integration with Excel, and cost-effective licensing make it ideal for businesses just starting their power business intelligence journey.

Who’s Using Power BI?

  • D2C brands mapping conversion funnels using Shopify & Google Analytics.
  • Finance teams generating investor-ready dashboards straight from Excel or Microsoft Dynamics.

 Key Advantages of Using Power Business Intelligence (BI):

  • Budget-friendly with a generous free tier.
  • Seamless Microsoft integration (Excel, Teams, Azure).
  • Fast iterations for prototyping and dashboarding.
  • Vibrant visual storytelling with dynamic charts and custom visuals.

Looker BI (Built for Scale and Semantic Governance):

Looker BI, now deeply integrated with Google Cloud Platform, is engineered for teams that need consistency, scalability, and granular control. It’s perfect for companies with robust data pipelines and engineering talent.

Who’s Using Looker BI?

  • SaaS platforms analyzing feature adoption across customer cohorts.
  • Marketing teams running multi-touch attribution reports via BigQuery.

Key Advantages of Using Looker BI:

  • Central semantic layer (LookML) = one version of the truth.
  • Enterprise-grade scalability with GCP-native design.
  • Granular access control to meet compliance needs.
  • Developer-friendly with Git-based collaboration.

Deep Dive: Feature-by-Feature Difference Between Power BI vs Looker BI

User Experience

  • Power BI offers a clean, business-user-friendly UI-ideal for marketers, executives, and non-technical staff.
  • Looker BI, on the other hand, requires SQL knowledge and is tailored for data-savvy professionals and analysts.

Visual Customization

  • Power BI leads here with its massive visual gallery, integration with Power BI AppSource, and ability to build custom visuals.
  • Looker maintains clean, minimal dashboards but has fewer native customization options.

Data Modeling

  • Power BI software leverages Power Query (M) and DAX to perform complex data manipulations and calculations.
  • Looker BI uses LookML-a modeling language that creates reusable data models and ensures consistent metric definitions.

Integration & Ecosystem

  • Power BI integrates natively with Excel, SharePoint, Teams, Dynamics 365, and Azure, making it a favorite for businesses within the Microsoft ecosystem.
  • Looker boasts excellent compatibility with Google BigQuery, and its robust APIs make it ideal for embedding in SaaS platforms.

Collaboration & Sharing

  • Power BI supports easy report sharing via Microsoft Teams, SharePoint, and OneDrive.
  • Looker offers Git-backed version control and enterprise-level governance, great for collaborative development environments.

Cost Comparison (Power BI & Looker BI: 2025 Outlook)

Plan
Power BI
Looker BI
Free Tier Yes (Power BI Desktop) No (Looker Studio is free, not Looker BI)
Pro Plan ₹800-₹1,000 per user/month Not Applicable
Premium (Capacity) Starts at ~₹4,000/month Starts ₹5L+/month

Tatvic Insight: Most startups and small businesses begin with Power BI due to affordability and user-friendliness. As their data architecture matures and needs for governed access increase, they often graduate to Looker BI for enterprise-scale deployment.

Decision Matrix: Find Your Fit

Business Type

Recommended Tool

Startup or SMB ✅ Power BI
Enterprise on Google Cloud ✅ Looker BI
No-code analytics need ✅ Power BI
Need for centralized metric definitions ✅ Looker BI
Using Microsoft stack ✅ Power BI
Data engineering-heavy team ✅ Looker BI

Whether you’re aiming for fast dashboard delivery or building a scalable, governed data layer both tools deliver.

Your choice should reflect your current data maturity, cloud alignment, and who will actually use the tool day-to-day.

Need help choosing or implementing the right BI software?

Let Tatvic’s experts guide your decision with tailored BI consulting and deployment strategies.

Tatvic’s Expert Recommendation: Choosing the Right BI Tool for 2025

After deploying both Power BI and Looker BI across industries from fast-scaling startups to regulated enterprises, Tatvic’s data consultants have gathered real-world learnings that go beyond feature sheets.

Start with Power BI if You Want Speed, Simplicity & Value

If your business needs fast, intuitive analytics without a steep learning curve, Power BI software is the ideal entry point. Its integration with Microsoft tools, low barrier to entry, and flexible visuals make it perfect for startups, marketing teams, and business units wanting insights yesterday.

  • Ideal for businesses already using Excel, Teams, or Dynamics 365
  • Works well for SMBs or early-stage companies with limited BI resources
  • Lets business users explore data independently, with minimal IT intervention

“For clients who want to hit the ground running and democratize data access, Power BI is a top pick.”

Scale with Looker BI if You Need Governance, Consistency & Cloud-Native Architecture

When your organization is dealing with multiple data sources, growing teams, and a need for consistent KPIs, Looker BI steps up. Its semantic modeling with LookML, version control, and cloud-native design makes it a long-term strategic investment.

  • Best suited for enterprises on Google Cloud, Snowflake, or AWS
  • Helps data teams enforce a single source of truth across departments
  • Supports complex data environments, embedded analytics, and secure sharing

“Looker BI is the platform of choice for organizations with mature data infrastructure and a deep need for scalable governance.”

Final Thoughts on Power BI vs Looker BI: Choose for Today, Plan for Tomorrow

Both Power BI and Looker BI offer unique strengths. The best choice hinges on your current tech stack, team skills, and data maturity.

Power BI is the people’s favorite for good reason, while Looker is the choice for data-first organizations prioritizing consistency and scale.

Selecting the right business intelligence software isn’t about chasing the most features, it’s about aligning with your current goals and evolving needs.

Whether you’re just beginning to make data-driven decisions or looking to scale across business units, choosing between Power BI and Looker BI should be a strategic step, not just a tactical one.

Step 1: Assess Your Present

  • Do you rely on Excel, Office 365, or Azure? → Start with Power BI software.
  • Need a low-cost entry into visual analytics?Power BI is built for you.
  • Is your team mostly business users, not data engineers? → Power BI’s intuitive interface makes adoption fast and smooth.

Power BI continues to win over teams with its blend of simplicity, performance and integration into Microsoft’s ecosystem.

Step 2: Think Ahead

  • Are you building a centralized data platform on BigQuery or Snowflake? → Choose Looker BI.
  • Need to define KPIs once and scale them across your org?Looker’s semantic layer offers unmatched consistency.
  • Looking to embed analytics in your product or SaaS platform? → Looker’s API-first architecture is a great fit.

Looker is the preferred BI tool for data-forward enterprises needing governance, version control, and scalability.

Still Unsure?

Let Tatvic’s BI consultants help you decode your needs.

With hands-on experience in both platforms and industry-specific BI implementations, we don’t just recommend, we build.

Unlock the Full Power of Display & Video 360 (DV360): Guide to Smarter Programmatic Marketing

Unlock the Full Power of Display & Video 360 (DV360) Guide to Smarter Programmatic Marketing - Tatvic

Did You Know!

Google Display & Video 360 (DV360) offers extensive reach, covering 90% of the global internet and connects advertisers to more than 80 ad exchange networks across mobile, desktop, CTV, OTT, and linear TV platforms.

In this article discover how Google DV360 powers data-driven advertising with access to over 90% of global internet users through premium inventory, advanced targeting, and dynamic creatives.

This expert guide unpacks DV360’s capabilities which used by 80% of top global brands, to drive measurable outcomes across display, video, CTV, and audio campaigns.

The Evolution of Advertising in the Age of Automation

The Evolution of Advertising in the Age of Automation

Digital advertising has evolved at a breakneck pace. With users spanning mobile, desktop, smart TVs, podcasts and OTT platforms, reaching the right person at the right time with the right message is no longer optional, it’s essential. This is where Google Display & Video 360 (DV360) shines.

As consumer journeys become increasingly fragmented, marketers need smarter tools to unify campaigns across channels. DV360 empowers brands to manage Display, Video, Audio and CTV Ads through one integrated platform.

With its advanced targeting, real-time optimization, and rich creative capabilities, DV360 helps advertisers maximize impact while minimizing waste. It’s not just automation, it’s intelligent and data-driven advertising at scale.

What is DV360 (Display & Video 360)?

Display & Video 360 (DV360) is Google’s enterprise-level demand-side platform (DSP) designed for programmatic media buying. It empowers advertisers to plan, buy, measure, and optimize digital campaigns all in one place. Unlike other DSPs that focus on media buying alone, DV360 is deeply integrated into the Google Marketing Platform (GMP), making it an end-to-end solution for advanced marketing teams.

DV360 stands out with its seamless access to premium inventory across Google and third-party exchanges, including YouTube, making it ideal for brand-safe, high-impact advertising. It combines data-driven audience targeting with real-time bidding and campaign insights. Whether you’re running display ads, video campaigns, or cross-device strategies, DV360 ensures precise control and unified reporting. This makes it a powerful tool for scaling performance in today’s programmatic ecosystem.

What is DV360 (Display & Video 360) - Tatvic

Core Capabilities of DV360:

Google’s Display & Video 360 (DV360) offers a comprehensive suite of programmatic tools designed to empower advertisers in the increasingly complex world of digital marketing. With its advanced features, DV360 enables brands to reach their audiences across multiple channels, optimize media spend, and harness data-driven insights to drive campaign success. Below are some of the key capabilities that make DV360 a go-to platform for performance-driven advertisers

Let’s deep dive into some of the Core Capabilities of DV360:

1. Cross-Channel Media Activation

DV360 enables advertisers to run campaigns across multiple digital channels-including display, video, audio, connected TV (CTV), and mobile-from a single, unified platform. This cross-channel flexibility allows marketers to create holistic strategies that deliver consistent messaging across the entire customer journey, improving both reach and frequency efficiency.

2. Advanced Audience Segmentation and Targeting

With DV360, advertisers can leverage Google’s robust audience data-along with first-party and third-party data-to build highly specific audience segments. Target users based on demographics, interests, browsing behavior, in-market signals, and even custom intent. This allows for hyper-personalized campaigns that drive engagement and conversions.

Example: A beauty brand can target makeup enthusiasts aged 18-34 actively browsing beauty tutorials on YouTube and related blogs.

3. Custom Bidding Strategies

One of DV360’s most powerful features is the ability to implement custom bidding algorithms. Advertisers can tailor bidding logic based on their unique business KPIs-whether it’s viewability, time on site, conversions, or ROAS. Custom bidding ensures every dollar is optimized toward what matters most to your brand.

Example: An eCommerce retailer might design a bidding model that prioritizes ad placements likely to convert high-value cart abandoners.

4. Seamless Integration with Google Stack (GA4, Campaign Manager 360, BigQuery, etc.)

DV360 integrates natively with Google’s ecosystem, including GA4 (Google Analytics 4), Campaign Manager 360, BigQuery, and Search Ads 360. This interconnected setup allows advertisers to easily import audiences, track cross-channel performance, attribute conversions, and analyze campaign results-all within a privacy-compliant environment.

Benefit: Faster, more accurate decision-making through consolidated reporting and unified KPIs.

5. Access to Premium Inventory (YouTube, OTT, PMP Deals)

With DV360, advertisers gain access to a vast range of premium inventory sources-from YouTube and top-tier publisher sites to Connected TV, OTT platforms, and Private Marketplace (PMP) deals. This ensures brand-safe placements, higher viewability, and greater control over where your ads appear.

Example: A travel brand can run skippable and non-skippable video ads on YouTube and OTT apps like Hotstar or Hulu, targeting vacation-intent users.

Expert View: Display & Video 360 is not just about reach-it’s about precision. With it, brands can build meaningful connections with customers at scale.

Why DV360 Outperforms Traditional DSPs (Demand Side Platforms)

Traditional DSPs may offer reach, but DV360 adds intelligence, control, and efficiency. Unlike traditional DSPs, which primarily focus on media buying, DV360 integrates with Google’s powerful ecosystem, enabling smarter audience targeting, real-time optimization, and richer data insights.

With access to premium inventory, including YouTube and CTV, along with customizable bidding strategies, DV360 allows brands to optimize their campaigns in a way that drives measurable results. It’s more than just a buying platform; it’s an intelligent tool designed to maximize ROI with advanced programmatic features.

Why DV360 Outperforms Traditional DSPs (Demand Side Platforms)- Tatvic

Here’s what makes Google DV360 superior:

  • Google Ecosystem Integration: Leverages first-party signals from Search, YouTube, Chrome and Gmail.
  • Programmatic Guaranteed Deals: Direct inventory access with transparency and certainty.
  • Data-driven Creatives: Serve hyper-personalized ads based on user behavior and context.
  • Unified Reporting: Full-funnel insights from awareness to conversion.

Example: A global edtech brand used DV360 to deliver CTV ads to segmented student cohorts across SonyLiv and YouTube. Engagement rates improved by 42% compared to campaigns run on a legacy DSP.

DV360 vs Google Ads: Key Differences Explained

While Google Ads is designed for direct advertisers, DV360 is tailor-made for performance teams managing multi-channel campaigns with scale and complexity. While both DV360 and Google Ads are powerful tools for digital advertising, they serve distinct purposes.

DV360 vs Google Ads Key Difference Explained - Tatvic

  • Google Ads is ideal for advertisers looking to run search campaigns or highly targeted display ads on Google’s owned properties, such as Search and YouTube. On the other hand,
  • DV360 is designed for larger, programmatic campaigns across multiple channels, offering more advanced features like custom bidding strategies, audience segmentation, and access to premium inventory across Google and third-party exchanges. With DV360, advertisers gain greater control, efficiency, and cross-channel reach, making it the go-to solution for data-driven, large-scale marketing efforts.

Let’s See The Major Difference Between DV360 vs Google Ads

Feature Google Ads Display & Video 360
Inventory Google Network only Open Web + PMP + PG
Targeting Standard audience tools Advanced layering, GA4 integration
Creatives Basic formats Interactive, Video, CTV, Dynamic Creative Optimization (DCO)
Measurement Campaign-specific Full-funnel attribution with Campaign Manager 360
Team Collaboration Limited Role-based, cross-team workflows

Tip: Use Google Ads for quick tests and do scale winning experiments with DV360 for enterprise-grade execution.

Google Display & Video 360 (DV360) Campaign Structure Demystified

Building a successful DV360 campaign begins with a well-organized structure.

The hierarchy of campaigns, insertion orders (IOs), line items, and ads allows advertisers to manage, optimize, and scale their efforts efficiently.

Google Display & Video 360 (DV360) Campaign Structure Demystified - Tatvic

Here’s a breakdown of the key components of  DV360 Campaign Structure

1. Campaign Level

At the highest level of the DV360 campaign hierarchy, the Campaign Level defines the overall objective of the campaign. Whether you’re aiming for brand awareness, consideration, or conversion (action), this is where you set the foundation for your campaign’s strategy. Additionally, you’ll define important parameters like flight dates (start and end dates) and the budgeting framework to ensure optimal allocation of resources.

2. Insertion Orders (IOs)

Insertion Orders (IOs) are the next step in the hierarchy and allow you to allocate budget across different ad placements. This layer also involves setting frequency caps to control how often your ads are shown to users and defining key performance indicators (KPIs) such as CPM (Cost Per Mille), CPA (Cost Per Acquisition), or CPC (Cost Per Click). These metrics help ensure that your ad spend is aligned with your campaign goals and that the performance is continuously measured and optimized.

3. Line Items

Line Items are the heart of the campaign setup and represent the individual ad placements or targeting segments within your larger campaign. This is where you define the creative type (display, video, audio, etc.), specify the targeting layers (such as demographics, interests, and behaviors), and configure the bidding strategy (like CPM, vCPM, or tCPM). Each line item can be optimized for different goals and audiences, ensuring precision in delivering ads to the right users at the right time.

Example: A brand may create a line item targeting 18-34-year-olds in urban areas, bidding on vCPM for video ads to drive engagement.

4. Ads & Creatives

Finally, Ads & Creatives are linked to the assets you’ve uploaded within DV360. This includes the format-specific rules (e.g., VAST tags for video ads, HTML5 for display ads, or audio tags for streaming campaigns) that dictate how your creatives will function across different channels and devices. Ensuring that the ads are correctly linked and optimized for the chosen formats is critical for delivering seamless, engaging user experiences.

Pro Insight: Mirror your funnel stages in your IO structure:
Top Funnel = Awareness IOs
Mid Funnel = Engagement IOs
Bottom Funnel = Conversion IOs.

Advanced Audience Targeting Capabilities in Google Display & Video 360 (DV360)

One of the strongest advantages of Google Display & Video 360 (DV360) is its robust and intelligent audience targeting system. By layering multiple data sources and intent signals, DV360 enables advertisers to reach the right users at the right time with hyper-personalized messaging.

Advanced Audience Targeting Capabilities in Google Display & Video 360 (DV360) - Tatvic

Here’s how the platform breaks down its advanced targeting options:

1. First-Party Audiences

DV360 allows seamless onboarding of first-party data, including customer lists, website visitors, and app users. You can import audiences directly from CRM systems, Google Analytics 4 (GA4), or Floodlight tags. This makes it easy to re-engage existing customers, nurture leads, or upsell to high-value users.

Example: A retail brand can retarget users who abandoned their carts in the past 7 days using email CRM data.

2. Google Signals: In-Market, Affinity and Demographics

Leveraging Google’s rich behavioral signals, DV360 offers a wide range of in-market, affinity, and demographic audiences. These are derived from billions of real-time intent signals such as search behavior, website visits, YouTube viewing patterns, and more.

  • In-Market Audiences: Users actively researching or intending to buy (e.g., “home loans” or “luxury cars”)
  • Affinity Audiences: Users grouped by long-term interests (e.g., “tech enthusiasts” or “fitness buffs”)
  • Demographics: Targeting by age, gender, parental status, and household income

3. Third-Party Audience Segments

DV360 integrates with leading third-party data providers like Nielsen, BlueKai, Oracle, Lotame, and Acxiom. These segments provide rich behavioral, transactional, and intent-based data that can enhance your targeting precision, especially useful when you lack robust first-party data.

Example: A luxury automotive brand can use Oracle data to reach high-income users in-market for premium vehicles.

4. Custom Intent Audiences

With Custom Intent, DV360 allows advertisers to build audience segments based on users’ search keywords, visited URLs, and app usage patterns. This offers deeper control and lets you create highly tailored audiences that reflect real-time buying signals.

Example: A travel brand can target users who’ve searched for “cheap flights to Bali” or visited travel comparison sites in the past week.

5. Lookalike Modeling (Similar Audiences)

Lookalike modeling in DV360 allows you to scale your campaigns by finding new users who resemble your top-performing audiences. These similar audiences are modeled using machine learning and behavioral patterns, helping you extend reach without sacrificing quality or performance.

Example: An e-learning platform can create lookalikes of users who completed a course and achieved certification, then reach similar professionals across CTV and mobile apps.

By combining these layers, advertisers can build deeply targeted and efficient audience strategies within DV360-resulting in better engagement, higher ROI, and smarter use of media spend. Whether you’re working with first-party CRM lists or tapping into Google’s AI-powered signals, the platform offers flexibility and precision unmatched by most other DSPs.

Let me know if you’d like this adapted into a visual chart, training material, or landing page copy!

Example: A BFSI client layered users interested in “tax saving” with custom keywords and remarketing from their blog. The result? 1.9x higher lead qualification rate.

Creative Formats & Dynamic Messaging in Google Display & Video 360 (DV360)

In today’s digital-first landscape, capturing attention through creativity is just as critical as precision targeting. With Google Display & Video 360 (DV360), advertisers gain access to a versatile suite of creative formats that are designed to perform across screens, platforms, and user contexts. Whether you’re focused on storytelling, engagement, or conversion, DV360 enables you to tailor your messaging for maximum impact.

1. Display Banners

These are the classic static or animated ads that appear across websites and apps. Display banners are ideal for high-visibility branding campaigns, offering flexibility in sizes and placements across a vast inventory of publishers.

Example: A tech company promoting a product launch can run a series of branded display banners across news and gadget review sites.

2. HTML5 Interactive Ads

HTML5 creatives support advanced interactivity-such as carousels, hover effects, tap-to-reveal features, or drag-and-drop experiences. These ads drive deeper user engagement and are great for conveying layered information in a visually rich format.

Example: A real estate brand could use an interactive map that lets users explore properties based on location or budget.

3. Native Ads

Native ads appear seamlessly within the content layout of the hosting platform, creating a less disruptive, more contextual ad experience. These are effective in increasing trust and engagement, especially on editorial or content-heavy platforms.

Example: A SaaS company promoting a whitepaper can place native ads within a B2B news outlet to drive quality leads.

4. In-stream & Out-stream Video Ads

DV360 supports both in-stream video ads (e.g., pre-roll ads on YouTube or streaming platforms) and out-stream video ads (ads that autoplay in the middle of content or articles). These formats are perfect for storytelling and brand lift campaigns.

Example: A fashion retailer could showcase its seasonal collection with 15-second pre-roll ads before style-related YouTube content, while reinforcing messaging through out-stream ads on lifestyle blogs.

5. Audio Ads

Audio ads are ideal for reaching users in screenless environments such as while driving, cooking, or working out. DV360 provides access to major streaming platforms and podcasts, offering a new dimension for brand voice and recall.

Example: A meal delivery service could run 30-second audio spots on music apps during lunch hours to drive immediate app installs.

6. Connected TV (CTV) / OTT

With increasing cord-cutting trends, DV360 allows advertisers to deliver full-screen, non-skippable video ads on connected TVs and OTT platforms. These are excellent for high-impact campaigns with cinematic storytelling.

Example: An automotive brand can run a visually immersive ad on smart TVs during prime-time content to drive upper-funnel awareness.


What is Dynamic Creative Optimization (DCO) in Display & Video 360 (DV360)?

Dynamic Creative Optimization (DCO) is one of the most powerful personalization tools available in Google’s Display & Video 360 (DV360). It enables brands to deliver real-time, tailored ad creatives based on individual user data making your message more relevant, engaging, and likely to convert.

Rather than designing hundreds of static ads, DCO uses feed-based inputs to automatically update ad components like copy, visuals, and CTAs depending on who’s seeing it and when.

With DCO in DV360, your campaign isn’t just automated, it’s intelligent.

Dynamic Creative Optimization (DCO) in Display & Video 360 (DV360) - Tatvic

Here’s how Dynamic Creative Optimization (DCO) adapts to user context using real-time data:

1. User Location

DV360’s DCO engine can dynamically alter ad content based on the viewer’s geographic location-down to the city or even zip code level. This allows advertisers to run hyper-local promotions without building separate creatives for each region.

Example: A quick-service restaurant chain can showcase different combo deals for Mumbai vs. Delhi based on local preferences or weather (e.g., hot coffee in colder regions).
This geo-personalization not only increases relevance but also improves engagement rates and click-throughs across your Display & Video 360 campaigns.

2. Device Type

With users switching between mobile, desktop, and tablet throughout the day, a one-size-fits-all creative can lead to poor experience and wasted impressions. DCO in DV360 intelligently modifies ad layout, image resolution, or call-to-action (CTA) placement based on the device in use.

Example: A mobile ad might prioritize a tap-friendly CTA and simplified visuals, while a desktop version could display more in-depth information or include a carousel of products.
By optimizing for device context, Display & Video 360 ensures that your creatives are not just seen-but also experienced the way they were meant to be.

3. User Behavior

DV360 can tap into behavioral data to tailor ads according to user interests, past website visits, cart activity, or content consumption patterns. This means you can target returning users with different creative messages compared to new visitors.

Example: A user who previously browsed running shoes on an e-commerce site may see a personalized ad featuring discounts on the exact product they viewed or complementary items like socks or fitness trackers.
Leveraging behavioral cues in real-time helps Display & Video 360 advertisers drive conversions with precision-targeted messages that feel timely and relevant.

4. Time of Day

Not every message works at every hour. DCO in DV360 allows your ad creatives to shift depending on the time a user is served the ad-morning, afternoon, evening, or late night. This contextual delivery enhances relevance and attention.

Example: A coffee brand might show a breakfast combo before 10 AM, while the same placement at 6 PM may switch to a “Relax with our Iced Coffee” offer.
Such time-sensitive creative adjustments ensure that your Display & Video 360 campaigns are aligned with user behavior cycles, maximizing campaign effectiveness.

Why DCO in DV360 is a Game-Changer

Instead of creating dozens or hundreds of ad variations manually, DCO empowers marketers to create one smart creative that adapts automatically. This not only saves time and resources but also significantly enhances performance metrics like CTR, conversion rate, and return on ad spend (ROAS).

When paired with DV360’s robust reporting tools and machine learning-powered optimizations, DCO becomes a cornerstone for brands looking to deliver truly data-driven, audience-centric advertising at scale.

If you’d like help building a DCO strategy using Tatvic’s DV360 Self-Serve or Managed Services, we’re just a click away. Let us show you how personalization can scale without limits.

Inventory Access in Display & Video 360 (DV360): Open Auction, PMP & Programmatic Guaranteed

One of the biggest strengths of Google Display & Video 360 (DV360) lies in its access to a wide range of premium inventory channels. DV360 offers flexible buying options through Open Auction, Private Marketplace (PMP), and Programmatic Guaranteed (PG), each tailored to meet different campaign goals and brand requirements.

Understanding the nuances of each can help advertisers make smarter decisions and improve media efficiency across programmatic campaigns.

Inventory Access in Display & Video 360 (DV360) - Tatvic

Let’s deep dive into Inventory Access in DV360:

1. Open Auction

The Open Auction is DV360’s default and most accessible buying method, where advertisers compete in real-time for ad impressions on a variety of websites and apps.

  • Cost-effective Scale: This model is best suited for advertisers seeking broad reach at competitive CPMs.
  • Flexible Targeting: You can layer in audience, contextual, or geo targeting without any upfront commitments.
  • Brand Safety Consideration: Since the inventory is open to all buyers, there’s a higher chance of appearing on lower-tier publishers unless you apply strict brand safety filters or use pre-bid targeting.

Example: A consumer electronics brand looking to promote a flash sale might use Open Auction to flood display inventory across tech news and comparison sites at scale and speed.

While Open Auction is budget-friendly, Display & Video 360 provides advanced tools like inventory exclusions, brand safety settings, and verification tools to ensure campaign integrity.

2. Private Marketplace (PMP)

Private Marketplace (PMP) deals offer access to premium inventory, but unlike Open Auction, this is invitation-only and negotiated directly with publishers or networks.

  • Higher Quality Inventory: You gain access to high-performing, brand-safe environments such as major news, lifestyle, or industry-specific publishers.
  • Better Viewability & Engagement: Because you’re buying from vetted sources, PMP campaigns often yield higher viewability and better user interaction.
  • Preferred Pricing & Priority Access: Though slightly more expensive than Open Auction, PMP deals often allow you to beat the competition in both inventory and placement quality.

Example: A fintech brand could use PMP deals to appear on leading financial news platforms like Bloomberg or Mint during budget season to capture a highly engaged audience.

For advertisers seeking both trust and transparency in their media buying, PMP via DV360 delivers the perfect middle ground between reach and premium quality.

3. Programmatic Guaranteed (PG)

Programmatic Guaranteed (PG) is the most premium inventory access model in DV360. With PG, advertisers lock in both ad inventory and pricing upfront offering predictability and priority delivery.

  • Guaranteed Placements: Ideal for campaigns with strict flight dates or event-based strategies.
  • Fixed Pricing, Fixed Impressions: No auction dynamics-your ad is guaranteed to run as per the contract.
  • Perfect for Brand Campaigns: Especially valuable for awareness campaigns where premium visibility and user trust are critical.

Example: A healthcare client wanted guaranteed visibility during World Health Day. By leveraging Programmatic Guaranteed deals via Display & Video 360, they secured top placement on Healthline, YouTube Reserve, and other high-impact health-focused platforms-ensuring they reached their audience at the right moment with unmatched contextual relevance.

With Programmatic Guaranteed, you combine the best of traditional media buys (predictability) with the agility and targeting of programmatic-making it a powerful strategy for brand-heavy campaigns.

Choosing the Right Buying Method in DV360

Each inventory access type in Display & Video 360 serves a unique purpose:

  • Open Auction = Maximum reach + agility
  • PMP = Premium inventory + flexibility
  • PG = Guaranteed exposure + brand safety

The choice often depends on your campaign goals, budgets, and risk tolerance. At Tatvic, we help clients strike the perfect balance between efficiency and effectiveness, whether you’re launching a mass-market campaign or aiming for hyper-targeted premium delivery.

Bidding & Budgeting Strategies in Display & Video 360 (DV360)

Setting the right bidding and budgeting strategy in Display & Video 360 (DV360) can mean the difference between hitting your KPIs or burning through your ad spend with little to show for it. DV360 provides powerful tools that cater to both novice and advanced media buyers allowing you to stay in control while leveraging Google’s machine learning to optimize performance at scale.

Bidding & Budgeting Strategies in Display & Video 360 (DV360) - Tatvic

Display & Video 360 (DV360) Bidding Options

DV360 supports multiple bidding models designed to fit your specific campaign goals from awareness to conversion.

1. Manual Bidding (CPM, CPA, CPC)

Manual bidding gives advertisers complete control over what they’re willing to pay per impression (CPM), click (CPC), or acquisition (CPA). This is ideal when you have historical performance benchmarks and want to test specific thresholds.

Example: If you know your average CPA for newsletter sign-ups is ₹150, you can set that value manually to maintain budget efficiency.

2. Auto Bidding with Goal-Based Optimization

Let DV360’s algorithms work for you. Auto bidding evaluates real-time signals such as device, time, and user behavior to adjust your bid dynamically toward your chosen goal-whether that’s maximizing clicks, conversions, or viewable impressions.

This is especially useful for large-scale campaigns across multiple geographies and devices, where manual adjustments become cumbersome.

3. Custom Bidding Scripts

For advanced advertisers, DV360 allows custom bidding algorithms via scripts. You can define unique business goals and create bid logic accordingly.

Example: A streaming platform might optimize for users who watch at least 75% of a video (quartile views), not just impressions or clicks.

Smart Budgeting Tips for DV360 Optimization

Budgeting isn’t just about setting limits, it’s about driving efficiency and flexibility in your spend strategy.

Here’s how to be smart with budgets in Display & Video 360:

  • Allocate 10-15% for Experimentation
    Always reserve a portion of your budget to test new formats, creatives, or audience segments. This fosters innovation without risking core campaign performance.
  • Set Both Daily and Lifetime Budgets
    This dual-layer approach ensures you don’t overspend, and gives you granular control over pacing and flight dates.
  • Choose the Right Pacing Strategy
      • Even Pacing: Spend is distributed uniformly across the campaign duration.
      • Ahead Pacing: Spends slightly faster to meet delivery goals early.
      • ASAP Pacing: Prioritizes speed! Great for time-sensitive offers like flash sales.

Tip: If your product or service has a long consideration cycle (like real estate or enterprise SaaS), avoid relying solely on CPA bidding. Instead, start by optimizing for mid-funnel engagement metrics like video completions or site time.

Reporting, Measurement & Attribution in Display & Video 360 (DV360)

Success in DV360 isn’t just about launching campaigns, it’s about measuring what matters.

DV360 offers robust integrations and cross-platform visibility to ensure that every impression, click, and conversion is traceable and optimizable.

Reporting, Measurement & Attribution in Display & Video 360 (DV360) - Tatvic

DV360 Reporting Ecosystem

1. Campaign Manager 360 (CM360)

CM360 powers your attribution model across touchpoints. It enables multi-channel tracking and deduplication of conversions, giving you a unified view of campaign impact.

2. Google Analytics 4 (GA4)

Integrate GA4 to understand user behavior post-click. Are users bouncing? Exploring product pages? Adding to cart? GA4 data enriches your DV360 campaign insights with on-site metrics.

3. BigQuery

For brands that need deep data slicing, DV360 integrates seamlessly with BigQuery. This allows custom queries, segmentation analysis, and predictive modeling on large datasets.

4. Looker Studio (formerly Data Studio)

Build real-time dashboards to monitor DV360 KPIs visually. You can segment performance by geo, device, audience, and creative type to make smarter optimization decisions.

Key Metrics to Track in DV360 Campaigns

  • Viewability Rate : Percentage of impressions where the ad was visible on screen (as per MRC standards).
  • Completion Rate: For video ads, how many users watched the entire video.
  • CPM, CPC, CPA:  Cost efficiency across impression, click, and acquisition goals.
  • Cost per Completed View (CPCV): Crucial for video-heavy campaigns.
  • Time-on-site (Post-click): Indicates user interest and landing page effectiveness.

Advanced Insight: For retail brands, implement Floodlight Tags for specific events like “Add-to-Cart” and “Checkout.” This helps in identifying exactly where users drop off in the funnel, enabling targeted retargeting or UX fixes.

Best Optimization Tactics Used by Top DV360 Advertisers

Optimization isn’t just a one-time task, it’s an ongoing process that separates average campaigns from industry benchmarks. Display & Video 360 (DV360) empowers marketers with sophisticated tools and granular control to fine-tune campaign performance across every layer from audience targeting and creative delivery to real-time bidding strategies. Below are the pro-level DV360 optimization tactics that consistently drive high-performing results.

Best Optimization Tactics Used by Top DV360 Advertisers - Tatvic

Proven Optimization Techniques in Display & Video 360

1. Weekly Creative Rotation

Stale creatives kill engagement. In programmatic environments where users are exposed to hundreds of ads daily, rotating ad creatives weekly can refresh user interest and combat ad fatigue. With DV360, you can automate this process by uploading multiple assets and setting rules for dynamic rotation.

Example: An e-commerce brand running a summer sale can rotate themed creatives every week to highlight different product categories like apparel in Week 1, accessories in Week 2, etc. This is to maintain novelty without additional setup.

Benefit: Increases click-through rates (CTR) and improves overall creative efficiency while keeping your brand experience dynamic and engaging.

2. Dayparting (Time-Based Ad Scheduling)

Timing matters. DV360’s dayparting capabilities allow you to schedule ads during specific hours or days of the week when your target audience is most active or in buying mode.

Example: A food delivery app can increase ad delivery during meal times-12 PM to 2 PM and 6 PM to 9 PM-to maximize order intent, while pulling back during off-peak hours to conserve spend.

Benefit: Boosts conversion rates by aligning ad exposure with user intent windows, all while improving cost efficiency.

3. Geo-Target Split Testing

Not all regions behave the same culturally, economically, or behaviorally. DV360 lets you isolate geographic variables by running separate line items for different regions, cities, or even postal codes.

Example: A national consumer electronics brand can split-test campaigns between metro cities (like Mumbai and Delhi) and tier-2 markets (like Jaipur or Indore) to understand cost-per-acquisition (CPA) differences and optimize messaging accordingly.

Benefit: Enables hyper-localized optimization and smarter budget reallocation based on regional performance trends.

4. Frequency Capping

Excessive ad exposure can lead to user fatigue or annoyance, often hurting brand perception and wasting media spend. With Display & Video 360, you can set frequency caps at the campaign, insertion order, or line item level.

Best Practice: Cap impressions at 2-3 per user per day for awareness campaigns, and adjust based on performance data and funnel stage.

Benefit: Helps maintain a positive brand experience, reduces waste, and increases the chances of meaningful engagement instead of mindless exposure.

5. Experiment Line Items

Want to test whether a new audience segment or creative format will outperform your current setup? DV360’s “experiment” line items allow you to A/B test different campaign variables, without disturbing your core campaigns.

Example: An automotive brand might test carousel display ads vs. vertical video ads across the same audience to see which drives higher engagement. These experiment results then inform future campaign investment.

Benefit: Accelerates learning and improves campaign ROI by giving you validated insights, not guesswork.

Why It Matters:

In today’s data-driven environment, small tweaks can lead to significant gains. By embedding these optimization strategies within your Display & Video 360 workflow, you can unlock stronger campaign outcomes, lower acquisition costs, and deliver tailored user experiences at scale.

Pro Strategy: Use retargeting exclusion to avoid wasting impressions on users who’ve already converted. This not only saves budget but improves relevance for remaining audiences.

How Top Industries Leverage Display & Video 360 for Maximum ROI

Display & Video 360 isn’t a one-size-fits-all platform, its flexibility allows industry-specific strategies to thrive.

From financial institutions to B2B SaaS brands, DV360 empowers marketers to run highly targeted, data-driven campaigns that deliver measurable results.

1. BFSI:

  • Use Programmatic Guaranteed during the financial year-end.
  • Integrate DV360 with GA4 for deeper insights.

2. Retail:

  • DCO for product-specific ads
  • CTV for brand storytelling

3. Healthcare:

  • PG deals with trusted platforms
  • Custom bidding for time-on-site metrics

4. B2B:

  • LinkedIn Matched Audiences via PMP deals
  • ABM-style targeting based on company IPs

Case Result: A B2B SaaS brand increased enterprise demo signups by 60% using IP-based targeting through DV360.

Tatvic’s Self-Serve vs Managed Display & Video 360: What Works When?

When it comes to maximizing the power of Display & Video 360, one of the most important decisions marketers face is choosing between Self-Serve and Managed Services.

At Tatvic, we understand that every organization is at a different stage in its digital advertising journey. That’s why we offer both engagement models-and even hybrid setups to match your team’s internal capabilities and business goals.

Tatvic’s Self-Serve vs Managed Display & Video 360 What Works When

Tatvic’s Self-Serve DV360: For Teams Who Want Complete Control

If your organization has a skilled in-house media team with expertise in programmatic buying, the Self-Serve DV360 model gives you full transparency, agility, and ownership over your campaigns.

Key Benefits of Tatvic’s DV360 Self Serve:

  • Direct access to DV360’s interface and full feature set
  • Custom audience building, pacing, and bidding strategies
  • Real-time optimization without external dependencies
  • Ideal for fast-paced teams looking to experiment and iterate frequently

Best For: Data-driven organizations, in-house media buyers, and performance-focused brands with DV360 fluency.

DV360 Managed Services: For Brands Seeking Expert-Led Execution

For companies without a dedicated programmatic team or those who want to scale quickly without hiring internally, Tatvic’s DV360 Managed Services offer end-to-end campaign management-from strategic planning to reporting and optimization.

Key Benefits of Tatvic’s DV360 Managed Account:

  • Campaign strategy, setup, and audience planning
  • Ongoing bid, creative, and audience optimizations
  • Advanced reporting through tools like GA4, Looker Studio, and BigQuery
  • Transparent performance insights and weekly syncs

Best For: Brands new to programmatic, or those who want expert-led execution without the overhead of in-house training.

Why DV360 is the Future of Advertising - Tatvic

Tatvic’s Display & Video 360 (DV360)Expertise: Case Snippets from Real Campaigns

Over the years, Tatvic has driven meaningful results for brands across industries using Display & Video 360.

Here are real-world case studies that showcase how our tailored strategies deliver business impact:

🎓 EdTech Brand Launching a New App

  • Objective: Drive app installs across Android and iOS in Tier 1 cities
  • Strategy: Leveraged a mix of YouTube TrueView, OTT placements and Custom Intent audiences built from competitor app keywords
  • Execution: Used DV360’s precise targeting and frequency capping to reduce waste
  • Results:
      • 3.2x more installs vs. Facebook Ads
      • 40% lower Cost Per Install (CPI)

🛍️ Luxury Retailer Expanding in the Middle East

  • Objective: Drive high-value traffic and conversions in Gulf Cooperation Council (GCC) countries
  • Strategy:
      • Targeted high-income affinity audiences using DV360’s rich audience segments
      • Secured PMP (Private Marketplace) deals with premium fashion publishers
  • Execution: Localized creatives tailored for Arabic-speaking audiences with DV360’s geo-targeting
  • Results:
      • 5.1x Return on Ad Spend (ROAS)
      • Higher engagement rates on luxury apparel lines

💳 Fintech App Focused on User Activation

  • Objective: Reduce Cost Per Activation and re-engage drop-off users
  • Strategy:
      • Used Dynamic Creative Optimization (DCO) to personalize offers
      • Ran retargeting campaigns for users who abandoned onboarding
  • Execution: A/B tested incentive messaging across devices
  • Results:
      • 2.7x higher Click-Through Rate (CTR)
      • 38% lower Cost Per Acquisition (CPA)

Final Thoughts: Why DV360 is the Future of Advertising?

Display & Video 360 (DV360) represents the future of intelligent advertising. In a fragmented digital ecosystem, it provides cohesion, insights, and control. From brand storytelling on Connected TV to conversion optimization through retargeting and dynamic creatives, DV360 covers the entire funnel.

Whether you’re scaling a new product or optimizing an established funnel, DV360 gives you the tools to make every impression count.

With expert support from partners like Tatvic, you can deploy data-driven strategies that not only scale performance but build long-term brand equity.

Interested in taking your DV360 campaigns to the next level??
->> Connect with Tatvic’s team of certified programmatic experts today.


Latest Conversion Rate Optimization (CRO) Trends to Follow in 2026 & Beyond

Latest Conversion Rate Optimization (CRO) Trends to Follow in 2025 & Beyond- Tatvic

Conversion Rate Optimization (CRO) in 2026 is no longer just about tweaking buttons or headlines!

It’s about creating smart, personalized experiences that truly connect with users.

Do You Know:

  • Almost 60% of B2B marketers say CRO is the most useful metric for landing page performance

  • 70% of marketers who engage in CRO work use the outcome of their experiments to inform other marketing decisions

As digital landscapes shift and customer expectations rise, businesses must rethink how they engage, convert and retain.

This rich article from Tatvic breaks down the latest CRO trends that are set to redefine landing page experience in 2026 and beyond.

CRO’s Role in 2026 & Beyond

We’re entering an era where personalization and relevance aren’t optional, they’re expected.

Conversion Rate Optimization (CRO) in 2026  is becoming more predictive, contextual, and privacy-first.

Businesses that fail to adopt emerging technologies will struggle to keep up with users’ dynamic needs.

To stay competitive, brands must prioritize data-driven experimentation and user-centric design across every touchpoint.

Modern Conversion Rate Optimization (CRO)  isn’t just about conversions, it’s about building trust, loyalty, and seamless digital experiences.

Why Traditional CRO Isn’t Enough Anymore

Gone are the days when changing a button color or tweaking a headline was enough to move the needle.

In today’s landscape, users expect frictionless journeys, real-time relevance, and tailored interactions.

Conversion Rate Optimization (CRO) has evolved into a dynamic blend of psychology, data  and technology.

Simple A/B testing in CRO just doesn’t cut it anymore.

Remember when split testing a CTA color felt groundbreaking?

In 2026, such tactics barely scratch the surface.

Today’s users demand instant, personalized, secure experiences and CRO has to deliver just that, powered by AI and first-party data rather than guesswork.

Today’s CRO strategies require a deeper understanding of user behavior across multiple devices and platforms.

Generic landing pages no longer engage-users expect dynamic content that adapts to their intent in real time.

With the decline of third-party cookies, Conversion Rate Optimization (CRO) must now rely on ethical data collection and transparent user experiences.

Modern CRO integrates emotional triggers and UX psychology to guide decision-making, not just design tweaks.

Success now hinges on continuous optimization, driven by real-time insights, not static, one-off experiments.

Top & Latest Conversion Rate Optimization (CRO) Trends You Can’t Ignore

Staying ahead in 2026 means embracing Conversion Rate Optimization (CRO) trends that put user experience at the center.

From AI-driven personalization to frictionless mobile journeys, the future of CRO is smarter and faster.

Today’s top-performing brands are using real-time data to tailor every touchpoint with precision.

If you’re not optimizing for intent, context and speed then you’re already falling behind.

Let’s See Top & Latest Conversion Rate Optimization (CRO) Trends in 2026 & Beyond

1.  Agentic AI for Smarter Personalization:

Agentic AI represents the next leap in digital personalization.

Unlike traditional rule-based automation, Agentic AI understands user intent, behavior and context in real time.

Real-World Example: Amazon’s homepage uses machine learning and Agentic systems to show different product recommendations to different users-even for the same keyword search-based on time of day, previous interactions, and device used.

Best Practices:

  • Integrate Agentic AI with your CRM and analytics stack.
  • Continuously test and train your AI models with updated data.
  • Use dynamic content blocks that adapt to user behavior in real-time.

2. Predictive Behavior Tracking:

Modern Conversion Rate Optimization (CRO) goes beyond observing what users do.

It anticipates what they’re about to do. Using predictive analytics, platforms can identify behaviors like exit intent, hesitation, or frequent cart abandonment.

Real-World Example: Netflix uses predictive analytics to suggest content right when users are likely to stop watching or get bored-keeping engagement high.

Best Practices:

  • Analyze heatmaps and session recordings to detect friction points.
  • Use machine learning to trigger context-aware nudges.
  • Continuously A/B test predictive interventions to refine accuracy.

3. Real-Time Website Adaptability:

Users now expect websites to be as responsive as conversations. Real-time orchestration adjusts your site based on visitor data changing banners for rainy weather, surfacing local offers, or adjusting tone for time-of-day browsing.

Real-World Example: Starbucks updates its mobile app offers and featured items based on local weather and user location.

Best Practices:

  • Integrate third-party data sources (weather, geolocation, etc.).
  • Use behavioral segments to determine real-time user intent.
  • Test adaptive elements frequently to ensure seamless transitions.

4. Conversions Straight from SERPs:

Zero-click conversions are on the rise.

Whether it’s booking a service, calling a business or reading an FAQ; all from Google’s search result page.

Brands must optimize their content for immediate engagement.

Real-World Example: Domino’s Pizza optimized its Google Business Profile with updated menus and “Call Now” CTAs, leading to a direct increase in orders without site visits.

Best Practices:

  • Create and structure content with schema markup (FAQ, How-to, Local Business, etc.).
  • Keep Google My Business profiles updated and enriched.
  • Target long-tail, intent-driven queries that trigger featured snippets.

5. Emotion-Led Design (Neurodesign):

CRO isn’t just about usability, it’s about emotional resonance.

Neurodesign applies behavioral psychology to UX.

Thoughtfully chosen color palettes, micro-interactions, and intuitive flows can reduce decision fatigue and create positive emotional anchors.

Real-World Example: Airbnb uses calming visuals, conversational UI, and minimal clutter to make booking feel personal and stress-free.

Best Practices:

  • Conduct user research to identify emotional triggers.
  • Leverage psychological design principles like the F-pattern or Hick’s Law.
  • Incorporate feedback loops through visual cues and animations.

6. Cookieless CRO with First-Party Data:

With the demise of third-party cookies, CRO needs to lean on data users willingly provide.

Tactics like interactive content (e.g., quizzes), account creation benefits, and email interactions enable brands to build robust first-party data ecosystems.

Real-World Example: Sephora uses quizzes to learn about customer preferences and recommend personalized products, all without relying on cookies.

Best Practices:

  • Use progressive profiling to collect data over time.
  • Offer value in exchange for user data (e.g., personalized guides, loyalty points).
  • Ensure transparency with users on how their data is used.

7. Cross-Device Experience Optimization:

In 2026, users are moving across devices like never before. CRO must ensure that the transition from desktop to mobile to wearable is smooth and consistent.

Real-World Example: Booking.com lets users save hotel listings on desktop and access them instantly via mobile app or email link.

Best Practices:

  • Use responsive and adaptive design patterns.
  • Implement cloud-based session storage for cross-device continuity.
  • Test all CRO elements across different device combinations.

8. Voice & Visual Search Readiness:

With devices like Alexa, Google Lens, and smartphones, users now search by voice and image. CRO must evolve to accommodate these non-text-based interactions.

Real-World Example: IKEA’s app allows users to snap a photo of a space and receive furniture recommendations that fit the visual context.

Best Practices:

  • Use conversational keywords and schema for voice search.
  • Optimize image alt text, titles, and metadata for visual discovery.
  • Include AR/VR experiences where relevant (e.g., virtual try-ons).

9. Smarter, Faster Checkout Experiences:

A lengthy checkout is a conversion killer.

Simplified checkout processes that include features like one-tap payments, guest checkout, and autofill make the final step frictionless.

Real-World Example: Amazon’s one-click checkout streamlines the purchase process, increasing the likelihood of impulse buys and repeat purchases.

Best Practices:

  • Reduce the number of form fields (ideally 6 or fewer).
  • Add trust signals, security icons, testimonials and guarantees.
  • Provide multiple payment options, including BNPL (Buy Now Pay Later) and UPI.

10. Appealing to Eco-Conscious Buyers:

Sustainability influences conversion.

Whether it’s carbon-neutral shipping or eco-friendly packaging, users want their purchases to reflect their values.

Real-World Example: Patagonia includes detailed sustainability practices on every product page, helping customers make values-driven decisions.

Best Practices:

  • Add environmental impact badges or labels.
  • Include sustainability messaging in the checkout flow.
  • Highlight eco-practices in product descriptions and emails.

By following these these Latest Conversion Rate Optimization (CRO) Trends businesses can win in the CRO game and generate visible impacts

How Tatvic Future-Proofs Your CRO Strategy

Tatvic future proofs CRO strategy by following the latest CRO Trends which drive visible results.

It  help brands stay ahead by combining Agentic AI, deep analytics, and intuitive UX.

From real-time personalization tools to privacy-first data strategies, we build CRO systems that evolve with your users not against them.

We don’t just analyze what users click, we uncover why they act, and what will make them convert.

Tatvic’s unique blend of behavioral science and agentic AI ensures your CRO approach is not only data-driven but deeply human-centric.

Whether it’s optimizing micro-moments on mobile or building trust on checkout pages, our strategies are tailored to real-world user journeys.

Tatvic stays ahead of algorithm shifts and privacy standards, keeping your brand visible and compliant.

From zero-click search readiness to first-party data enablement, we future-proof every stage of your conversion funnel.

Our team doesn’t believe in one-size-fits-all; we design CRO frameworks that evolve with your audience and industry.

Final Thoughts: Ready for the CRO Revolution?

CRO in 2026 is fast, flexible, and deeply human-centric.

It’s about creating journeys that feel tailor-made, driven by ethical data use and empathetic design.

It’s no longer about tweaking, it’s about transforming how users engage with your brand at every digital touchpoint.

With customer expectations constantly rising, your CRO strategy must be agile, ethical, and insight-led.

Tatvic empowers you to adapt in real-time, leveraging smart automation and design that speaks to user intent.

As search behaviors evolve, our CRO frameworks ensure your brand remains discoverable and conversion-ready.

By future-proofing your funnel today, you stay relevant, competitive, and loved by your customers tomorrow.

10 Proven Steps to Build a High Converting Landing Page That Converts Like Crazy

10 Proven Steps to Build a High Converting Landing Page-Tatvic

Creating a High Converting Landing Page is more than just good design, it’s about connecting with your audience in a way that compels them to act.

Whether your goal is to drive sales, collect leads, or increase sign-ups, your landing page needs to deliver the right message, at the right time, to the right people.

This guide breaks down proven steps to help marketers, business owners and growth teams craft landing pages that don’t just attract attention but turn that attention into action.

Let’s dive into it->>

What is a High Converting Landing Page?

A high-converting landing page is a focused webpage designed to guide visitors toward a single, specific goal whether that’s making a purchase, signing up for an event, or submitting their contact information.

What sets it apart is how effectively it leverages user intent, clean design, compelling messaging, and trust-building elements to boost conversions. It minimizes distractions and highlights the core value proposition clearly.

Optimized for mobile and speed, a high-converting landing page often uses persuasive CTAs and social proof to drive meaningful user action.

Case Snippet:
ConvertKit, an email marketing tool, revamped their landing page to speak directly to user challenges. This clear shift toward benefits over features led to a 44% increase in trial sign-ups in under a month.

What’s the Average Conversion Rate for Landing Pages?

Conversion rates vary depending on industry and audience, but research shows the average is about 2.35%.

The top 25% of landing pages convert at 5.31% or more, while the top 10% reach 11.45%+.

To stand out, aim for a 5%+ conversion rate, especially if your offer and traffic are highly relevant.

Case Snippet:
Tatvic improved an eCommerce brand’s landing page structure and CTA positioning, boosting conversions from 3.2% to 8.6% in just 2 months.

Why a High Converting Landing Page Matters

Your landing page is often a potential customer’s first impression of your brand.

Unlike a homepage that has multiple goals, a landing page has one: conversion.

It’s your chance to maximize ad spend, lower acquisition costs, and increase the quality of leads.

Case Snippet:
Shopify cut their page load time by one second and saw a 30% increase in free trial sign-ups. Faster pages equal happier visitors and more conversions.

10 Proven Steps: How to Create a High Converting Landing Page

Creating a landing page that truly converts requires more than just good design, it demands:

  • strategy,
  • clarity and
  • user-focused execution.

Every element on your landing page should serve a purpose, whether it’s guiding attention, building trust, or driving action.

From headline to CTA, each component must align with your audience’s needs and intent.

By combining data-backed insights with persuasive content, you can significantly boost your conversion rates.

Remember, high-converting pages aren’t built on guesswork they’re built on strategy and testing.

Follow the best practices to turn your traffic into qualified leads and loyal customers.

Let’s See 10 Proven Steps to Build a High Converting Landing Page

1. Know Your Audience Inside Out

Before you touch layout or wording, get clear on who your audience is.

Your landing page should reflect their specific needs, pain points, and aspirations.

Action Steps:
  • Build detailed buyer personas.
  • Conduct interviews or surveys.
  • Analyze user data and behaviors.

Case Snippet:
Tatvic helped an edtech company discover that their top-converting users were mobile-first. After a mobile-centric redesign, conversion rates jumped from 2.3% to 7.1%.

2. Set Clear & Measurable Goals

Every great landing page is built with one goal in mind. Multiple CTAs or objectives create confusion and drop-offs.

Common Goals:
  • Collect leads
  • Drive product sales
  • Secure event sign-ups
  • Encourage free trials
Action Steps:
  • Define your main KPI (e.g., form submissions, purchases).
  • Ensure every element supports this single objective.

Industry Insight:
HubSpot boosted ebook downloads by 50% simply by reducing form fields from five to three.

3. Write a Benefit-Driven Headline

Your headline is the hook. Make it clear, compelling and focused on the outcome for the visitor not just the features.

Checklist:
  • Keep it short and powerful
  • Focus on benefits
  • Add emotional appeal

Example: “Triple Your Email List with Our Free Growth Tool”

Industry Insight:
Basecamp
swapped “Organize Your Projects” for “Finish Projects Faster” resulting in a 102.5% lift in conversions.

4. Craft Relevant, Engaging Content

Great landing page content speaks directly to your visitor’s intent. Keep your language clear, your format skimmable and your tone human.

Tips:
  • Highlight pain points and solutions
  • Use bullet points for benefits
  • Skip jargon, use natural language
  • Tell stories that create a connection

Industry Insight:
Crazy Egg introduced storytelling to explain how their tool helps users. Result: a 64% bump in conversions.

5. Make Your CTA Stand Out

Your call-to-action (CTA) is where the magic happens. It should be bold, benefit-focused, and placed where it’s easy to find.

Tips:
  • Use active language: “Try Free,” “Get Started,” “Claim My Spot”
  • Place it above the fold and in key scroll spots
  • Use contrast to make it pop visually

Industry Insight:
Dropbox simplified their landing page to just one CTA: “Sign up for free.” The result? A notable spike in new users.

6. Add Visuals That Support Your Message

Visuals help users absorb information quickly and make your page more engaging.

What to Include:
  • Real photos, not stock
  • Product demos or walkthroughs
  • Short explainer videos

Industry Insight:
Pages with video convert up to 80% better. Wistia saw an 85% jump after adding an explainer video.

7. Build Trust With Proof

People trust people. Show proof that others have benefited from your offer.

Options to Use:
  • Testimonials and reviews
  • Client logos
  • Case studies and stats

Industry Insight:
Airbnb‘s user-generated reviews not only built trust but also helped boost their search engine rankings.

8. Optimize for Speed and Mobile

A slow or poorly optimized page kills conversions. Make sure your page loads fast and looks great on any screen.

Best Practices:
  • Compress images
  • Use a content delivery network (CDN)
  • Keep code light and fast

Industry Insight:
Pinterest improved mobile page speed and saw a 15% lift in sign-ups.

9. Keep the Design Simple and Focused

Your design should guide visitors toward your goal-not distract them.

Design Tips:
  • Use whitespace effectively
  • Minimize navigation
  • Focus on one CTA

Industry Insight:
Campaign Monitor removed navigation links and boosted sign-ups by 17%.

10. Test and Improve Continuously

Optimization is a never-ending process. Use A/B testing to improve your headline, CTA, form layout, and more.

What to Test:
  • CTA copy and placement
  • Page layout and visuals
  • Incentives or offers
Tools to Try:
  • Google Optimize
  • Crazy Egg
  • Hotjar

Industry Insight:
Moz saw a 13% increase in sign-ups just by changing their CTA text from “Get Started” to “Start My Free 30-Day Trial.”

Common Pitfalls to Avoid for Designing A High Converting Landing Page

Even small missteps can derail your landing page’s performance.

To build a high converting landing page, it’s crucial to eliminate elements that create friction or confuse your visitors.

Common mistakes, like unclear messaging or poor mobile optimization can significantly lower your conversion rate.

Avoid the below mentioned pitfalls to ensure every visitor has a smooth, goal-driven experience:

  • Conflicting or multiple CTAs
  • Low-quality or generic visuals
  • Overly complex copy
  • Poor mobile experience

Recommended Tools

Use these tools to build high-performing landing pages without heavy development work:

  • Unbounce: Drag-and-drop simplicity
  • Instapage: Enterprise-level testing and personalization
  • Leadpages : Great for small budgets
  • HubSpot: CRM-integrated landing pages for smarter tracking

Tip: Choose the tool that fits your goals and team skill level.

Conclusion: Every Click Deserves a Result

A high-converting landing page blends strategy, empathy, and data.

It speaks to your audience’s needs, presents a clear offer, and nudges them gently but effectively toward action.

By following these steps, you’ll be on your way to building landing pages that don’t just look impressive but also they perform.

Need help turning your landing pages into conversion machines?

Tatvic’s CRO experts can help you design, test, and optimize pages that deliver measurable results.

Ready to grow?

Let Tatvic help you make every click count.

Bot Icon
Bot Icon

Tatvic Bot

Explore About Tatvic and Services