Hello There!

Lorem ipsum dolor sit amet, consectetur adipiscing elit,

Agentic AI for Marketing: Driving Results with Intelligent Automation

Agentic AI for Marketing: Driving Results with Intelligent Automation - Tatvic

Do you Know?

Marketers Saw a 13.7% Average ROI from Agentic AI in 2026
~BCG

We’re at a turning point in how work gets done , not just faster, but fundamentally smarter.

The rise of Agentic AI for marketing is transforming how decisions are made, actions are taken and results are scaled in real time.

But what exactly is it and why is now the moment to care for Agentic AI for marketing automation?

Agentic AI refers to a new class of AI systems that go beyond traditional automation or even advanced machine learning.

AI for Marketing has long promised efficiency gains, but Agentic AI for Marketing systems are goal-seeking, context-aware and capable of autonomous decision-making across complex tasks  often with minimal human intervention.

While “AI” is a term that’s been hyped for years, Agentic AI is not about chatbots or basic scripts.

It’s about delegating entire jobs, not just tasks to intelligent agents that continuously learn, optimize and coordinate with other tools or systems.

Agentic AI for Marketing: Scaling Marketing Automation In A Smarter Way

Traditional Marketing Automation is built on predefined workflows and static rules.

While it helps streamline repetitive tasks, it often lacks the flexibility and intelligence needed to thrive in today’s dynamic digital landscape.

As customer behaviors shift in real time and campaign complexity grows, businesses need more than automation, they need autonomy.

Agentic AI introduces a new paradigm: autonomous and goal-driven agents that not only execute tasks but also plan, adapt, and optimize marketing actions intelligently.

These agents continuously learn from data, make context-aware decisions, and operate with minimal human intervention-enabling marketers to move faster, target smarter, and respond in real time.

By combining the power of machine learning, decision intelligence, and real-time feedback loops, Agentic AI allows marketing teams to scale their efforts more intelligently.

It unlocks smarter automation, driven not just by efficiency, but by adaptability and strategic outcomes.

In this guide, we explore how Agentic AI is redefining marketing automation and how organizations can leverage it to deliver greater performance, personalization and ROI at scale.

Why This Guide on Agentic AI For Marketing Automation Exists?

Despite its potential, Agentic AI for marketing automation can feel complex or out of reach for many teams. There’s a lot of noise, hype, and confusion around terms like “autonomous agents” or “multi-agent systems.” That’s why we created this guide - to make Agentic AI for marketing automation understandable, actionable, and above all, applicable to real-world marketing challenges.
Agentic AI for Marketing: Scaling Marketing Automation In A Smarter Way

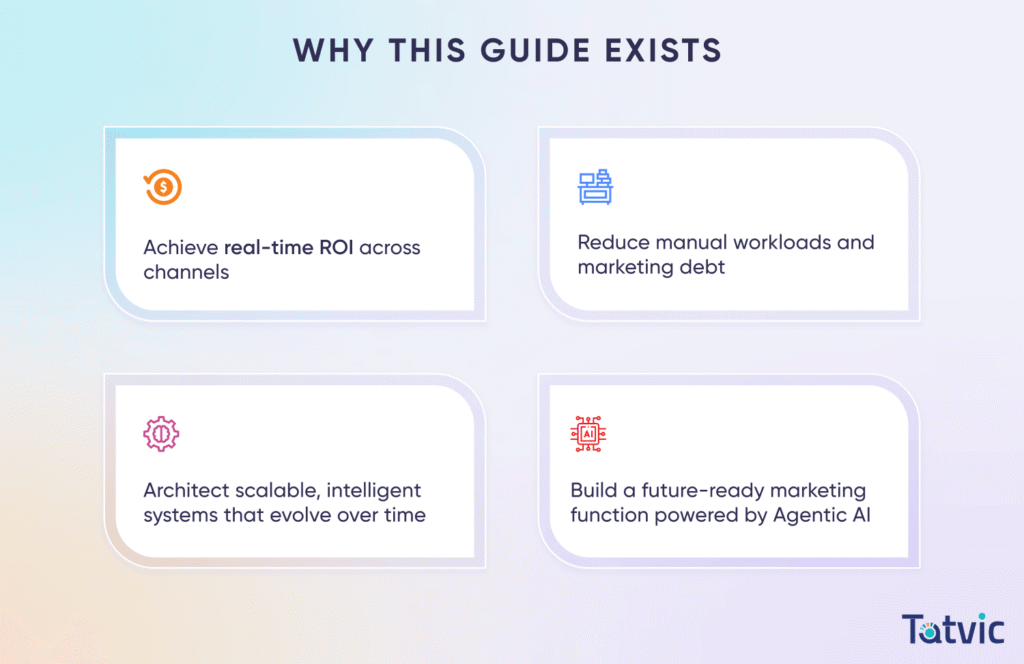
This isn’t just a trendwatcher’s report. It’s a practical, strategic roadmap for marketers looking to:

  • Achieve real-time ROI across channels
  • Reduce manual workloads and marketing debt
  • Architect scalable, intelligent systems that evolve over time
  • Build a future-ready marketing function powered by Agentic AI
You may also like to read👉 Agentic AI vs AI Agents: A Complete Guide for 2026 & Beyond


What the Early Data Tells Us about the Role of Agentic AI in Marketing?

Early evidence across industries shows that Agentic AI for marketing automation is already delivering tangible value.

Here are three verified data points from leading research:

Revenue Uplift in Marketing & Sales

63% of companies surveyed by McKinsey report higher revenue in marketing and sales after scaling AI, making these functions the biggest beneficiaries of AI-driven growth.
Source: McKinsey Global AI Survey, 2023

Cost Reductions in Operations

44% of the same respondents say AI has cut costs by at least 10% in the units where it’s deployed, with marketing operations among the top areas realizing these savings.
Source: McKinsey Global AI Survey, 2023

Widespread AI-Powered Personalization

Over 50% of marketers have deployed AI-driven personalization tools to tailor customer experiences in real time-resulting in an average 20% boost in engagement metrics.
Source: Gartner Marketing Technology Survey, 2024

These figures underscore a clear trend: businesses embracing Agentic AI for marketing automation see faster execution, lower costs, and measurable revenue uplifts proving the technology is ready for prime time.

Why Agentic AI in Marketing Really Matters Now?

The pressure on marketers in 2026 has never been more intense.

Marketing teams today are navigating a perfect storm of heightened expectations, constrained budgets, and an overwhelming explosion of data.

Agentic AI for marketing automation offers a real way forward. By using agents that are goal-driven, adaptive and self-improving, marketing teams can break the cycle of reactive execution and start operating proactively, intelligently and at scale.
Why Agentic AI in Marketing Really Matters Now - Tatvic

This moment is unique. Advances in real-time data infrastructure, scalable LLMs, and edge computing have converged, making Agentic AI truly autonomous. If you want AI Marketing that adapts on the fly, eliminates manual bottlenecks, and delivers real-time ROI, there’s never been a better time to embrace Agentic AI for marketing automation.

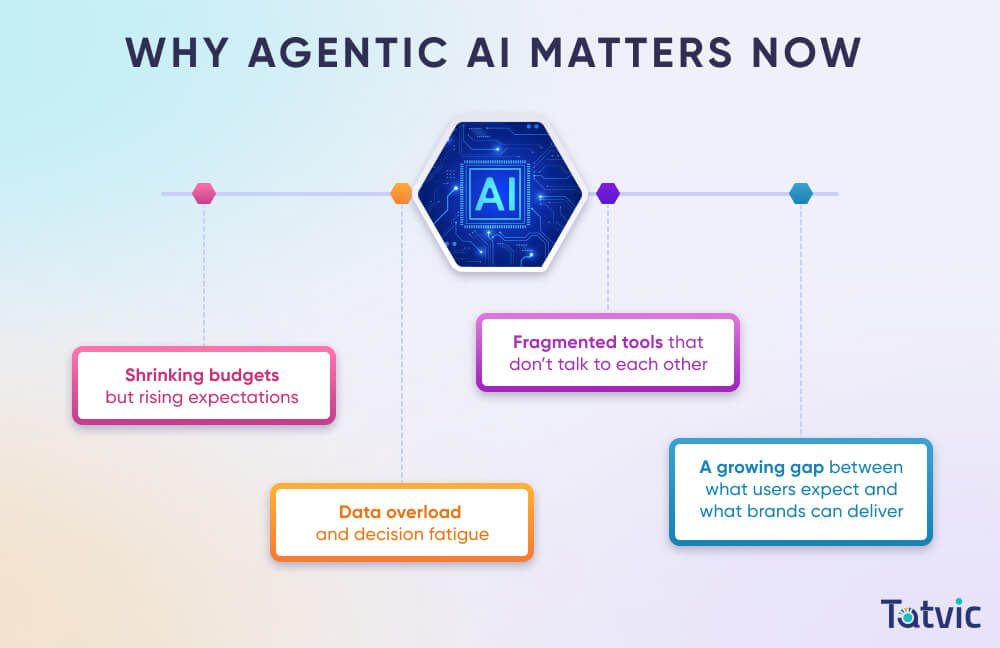
Despite access to advanced Martech stacks, many still face persistent challenges:

  • Shrinking budgets, rising KPIs: Marketing leaders are being asked to do more with less. Optimize performance, personalize experiences and scale campaigns, all while operating with reduced spend.
  • Data deluge and decision fatigue: With vast amounts of customer and campaign data pouring in across channels, marketers struggle to turn insights into timely action.
  • Disconnected tools and siloed systems: Legacy marketing automation platforms and fragmented data stacks don’t integrate seamlessly, leading to inefficiencies and lost opportunities.
  • Sky-high customer expectations: In 2026, consumers expect real-time relevance, hyper-personalization, and instant gratification-standards that outdated automation simply can’t meet.

Enter Agentic AI: The Future of Marketing Automation

Agentic AI isn’t just another upgrade in your Martech toolkit, it’s a fundamental shift.

This new wave of intelligent, autonomous agents redefines how marketing gets done.

Instead of relying on rigid workflows and static rules, Agentic AI empowers marketers with systems that are:

  • Goal-driven: Agents operate with clear business objectives in mind-whether it’s maximizing ROAS, improving engagement, or reducing churn.
  • Self-improving: These agents learn continuously from real-time data and past outcomes to refine strategies dynamically.
  • Context-aware: They understand the environment, customer signals, and business context, adjusting campaigns on the fly for optimal impact.
  • Proactive, not reactive: Instead of waiting for inputs or approvals, agents anticipate what’s needed and act autonomously to achieve it.

Why Agentic AI in Marketing Is Important Now?

The timing couldn’t be more critical or more promising.

In 2026, we’ve hit a powerful inflection point where technology finally enables true marketing autonomy:

  • Scalable LLMs (Large Language Models) are now fine-tuned for industry-specific marketing applications, enabling more precise, context-rich decision-making.
  • Real-time data infrastructure powered by event-driven architectures (e.g., Kafka, Snowpipe, and Apache Flink) allows instant feedback and action loops.
  • Edge computing and privacy-aware AI make it possible to deliver personalized experiences at speed while maintaining compliance with evolving data regulations like the Digital Markets Act and India’s DPDP Bill.
  • Agentic orchestration platforms are replacing clunky dashboards, automating campaign management, A/B testing, audience segmentation, and even creative optimization at scale.

It’s time to stop patching together workflows and start building self-directed marketing systems.

Agentic AI isn’t just the next step, it’s the leap toward marketing that’s faster, smarter, and more ROI-driven than ever before.

  • You don’t need more dashboards-you need decisions.
  • You don’t need more tools-you need outcomes.
  • You don’t need more rules-you need results.
  • You don’t need more Automation -you need Autonomy.

Agentic AI delivers all Four!
The Imperative for Real-Time ROI

The Imperative for Real-Time ROI

In 2026, marketers no longer have the luxury of time or guesswork.

Campaigns are no longer judged by monthly wrap-ups or post-mortem dashboards.

Every initiative is tethered to real-time performance metrics, tight budgets and high-stakes KPIs.

The question CMOs are asking isn’t just “Did this work?”, it’s:

“What’s working right now and what must change immediately?”

Traditional marketing automation tools simply can’t keep pace with the speed of decision-making required today.

That’s where Agentic AI for marketing automation steps in not as an enhancement, but as a game-changing necessity.

You may also like to read👉 Agentic AI vs Generative AI in 2026: Definitions, Use Cases and Key Differences


Why Real-Time Marketing Is No Longer Optional

In today’s high-velocity digital landscape, delayed insights cost money, attention, and conversion. Modern marketing needs to react not in hours or days but in seconds.

Agentic AI delivers real-time ROI by enabling autonomous decision loops across every marketing touchpoint. It’s not about analyzing last week’s campaign, it’s about optimizing this second’s results.

Imagine intelligent AI Agents that:

  • Pull live performance data from multiple platforms (Google Ads, Meta, DV360, CRM, etc.)
  • Analyze campaign signals across audiences, creatives, and channels in real time
  • Reallocate budget dynamically toward high-performing assets or underexposed audiences
  • Auto-generate and A/B test subject lines, CTAs, or creative elements on the fly
  • Trigger contextual next-best actions for users based on their real-time behaviors

The Tech Convergence That Made It Possible

The shift to real-time, agentic marketing is powered by a unique convergence of technologies now fully matured in 2026:

  • Streaming data pipelines (e.g., Snowflake Snowpipe, Apache Kafka, Confluent Cloud) now handle billions of real-time events with near-zero latency.
  • Next-gen LLMs, like GPT-5 and Claude 3.5, are now fine-tuned for marketing decision-making, generating not just content, but strategy and performance recommendations.
  • Edge computing and serverless architectures enable data processing at the point of interaction no more waiting for centralized batch jobs.
  • Autonomous agent frameworks are built to execute adaptive marketing strategies without requiring constant human oversight.

Marketers have long leaned on automation to scale execution.

But 2026 demands more than automation, it demands intelligent action at speed.

Agentic AI turns automation into autonomy, empowering systems that not only act but adapt.

That agility directly translates into:

  • Higher conversion rates
  • Smarter budget allocation
  • Increased marketing velocity
  • Immediate feedback loops for continuous improvement

Real-time ROI isn’t a buzzword, it’s a business imperative.

Every moment you wait to optimize is a moment lost in a hyper-competitive market.

  • With Agentic AI, you’re not just keeping up -> you’re staying ahead.
  • You’re not just automating -> you’re advancing.
  • You’re not just reporting ROI -> you’re accelerating it.

Welcome to the new standard in performance marketing.


You may also like to read👉 How AI Is Reshaping Marketing in 2026: Trends, Tools & Tactics


Why 2026 Is the Breakthrough Year for Instant ROI with Marketing Automation

2026 isn’t just another year of AI hype, it’s the inflection point where marketing automation and real-time ROI converge.

The pressure on marketing teams to do more with less has never been greater.

Budget scrutiny is at an all-time high, C-suite patience is at an all-time low, and delayed insights are no longer acceptable.

Yet, according to BCG’s October 2024 report, despite multi-year investments in AI, 74% of companies still struggle to scale meaningful value.

The culprit?

Most AI deployments remain siloed in pilots, dashboards or POCs failing to deliver measurable outcomes.

Only 1 in 4 enterprises have matured their AI strategy enough to drive cross-functional, ROI-generating impact.
- Source: BCG, “Where’s the Value in AI?”, 2024

The Leaders Have a Different Playbook

What sets the frontrunners apart isn’t just access to AI, but how they integrate it deeply into their revenue engines and cost-optimization workflows.

  • 45% of AI leaders deploy AI for enterprise-wide cost transformation (vs. just 10% of laggards)
  • Over 33% use AI directly to fuel top-line growth-boosting revenue through smarter decision-making and personalized automation
  • Leaders close the loop between insights and action with minimal human intervention

With real-time data pipelines and cloud-native LLMs now mainstream, Agentic AI for marketing automation is finally live. In a world of shrinking budgets and zero patience for lag, this is the year AI Marketing proves its ROI.

From ROI Lag -> ROI Live

In traditional marketing automation, results are often reactive. You launch a campaign, wait days for performance data, and only then make changes.

With Agentic AI, the game changes:

  • ROI insights surface in real time, not in post-campaign retrospectives.
  • Campaign performance is continuously optimized based on dynamic behavior and live feedback loops.
  • Budgets shift automatically toward what’s working, eliminating waste and maximizing impact without waiting for manual intervention.

In 2026, Agentic AI doesn’t just report ROI. It delivers it instantly.

Agentic AI Marketing Automation 101: From Predictive to Prescriptive to Fully Autonomous

The Evolution of AI in Marketing Automation

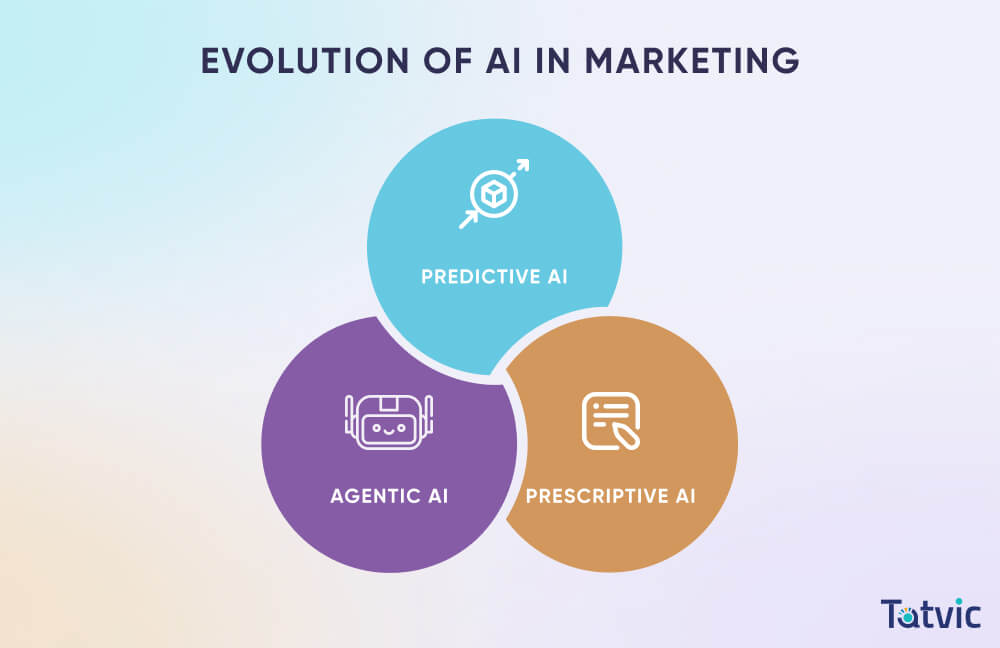
The evolution of AI in marketing is a story of growing intelligence, autonomy, and business impact. What began as data-driven support tools has now matured into fully autonomous systems that not only recommend but execute.
Evolution of AI in Marketing

Stage 1: Predictive AI - Seeing What’s Likely to Happen

Predictive AI was the first major milestone. It helped marketers move from gut-feel decisions to data-backed forecasting.
These models:

  • Scored leads based on conversion potential
  • Predicted customer churn
  • Recommended best-next products or offers
  • Identified behavior trends across segments

While powerful, predictive AI still left the actioning to humans.

Stage 2: Prescriptive AI - Suggesting What to Do

Next came prescriptive AI tools that not only anticipated outcomes but suggested the optimal path forward.
These solutions would:

  • Recommend campaign budget reallocations
  • Suggest subject line improvements based on audience insights
  • Optimize bidding strategies for paid media
  • Guide content sequencing based on user journey modeling

However, execution still required human validation. Think of this phase as AI copilots, not commanders.

Stage 3: Agentic AI - Acting Autonomously in Real Time

Welcome to 2026: the age of Agentic AI for marketing automation.

Agentic AI systems represent a breakthrough leap. These aren’t just intelligent advisors, they’re autonomous agents with the ability to:

  • Ingest and analyze real-time cross-channel data
  • Make data-driven decisions with minimal latency
  • Dynamically execute changes across campaigns, budgets, creatives, and journeys
  • Learn continuously and self-improve with each interaction

There’s no need for human-in-the-loop delays. These agents think, act, and adapt at machine speed enabling fully self-driving marketing operations.

This evolution from predictive to prescriptive to autonomous is what sets Agentic AI apart in the marketing tech landscape.

It allows brands to:

  • Move from insights to impact instantly
  • Deliver hyper-personalization at scale
  • Eliminate manual bottlenecks across the marketing funnel
  • Continuously optimize based on real-world results-not assumptions

In 2026, with cloud-native LLMs, real-time data streams, and scalable edge computing,

You may also like to read👉 Agentic AI vs ChatGPT: What Marketers Need to Know in 2026


Agentic AI isn’t just an upgrade, it’s a redefinition of what’s possible in marketing.

Core Capabilities & Business Impacts

In 2026, the most transformative marketing automation systems are no longer just reactive-they’re agentic, proactive, and self-evolving. At the heart of Agentic AI lies a new class of intelligent systems defined by three breakthrough capabilities: goal-seeking behavior, collaborative agents, and real-time self-optimization.

Together, these elements enable marketing teams to unlock unprecedented efficiency, agility, and growth at scale.

1. Goal-Seeking Decision-Making Agents

Agentic AI systems are designed to pursue outcomes, not just execute tasks.

These intelligent AI Agents:

  • Continuously scan and interpret thousands of signals across campaigns, channels, and user touchpoints
  • Prioritize marketing actions aligned with predefined business objectives (e.g., ROAS, CAC, LTV)
  • Make high-frequency decisions without human bottlenecks

This allows for dynamic, autonomous marketing orchestration-with minimal manual intervention and maximal business alignment.

2. Real-Time Learning & Continuous Optimization

Unlike traditional automation that relies on static rules or pre-trained models, Agentic AI adapts in real time:

  • Refines strategies based on immediate performance feedback
  • Tests and evolves content, creatives, timing, and placement on the fly
  • Adjusts for shifting market signals, user behaviors, or budget thresholds instantly

The result?

A self-improving marketing engine that becomes smarter and more effective with every interaction.

3. Automated Activation Across the Full Funnel

Agentic AI doesn’t just suggest actions, it executes them.

These systems can:

  • Launch campaigns and deploy assets autonomously
  • Reallocate budgets from underperforming to high-performing channels in real time
  • Rewrite subject lines, CTAs, or product recommendations instantly to boost performance
  • Trigger multichannel journey updates based on live intent signals

This eliminates lag between insight and impact turning real-time intelligence into immediate business outcomes.

The result?

Marketers shift from firefighting to strategy elevating AI Marketing from static reporting to dynamic, ROI-driven action and turning Agentic AI for marketing automation into your most reliable growth engine.

6 Ways How Agentic AI Is Transforming Marketing in 2026

As marketing complexity explodes in the era of hyper-personalization, shrinking attention spans, and real-time consumer expectations, Agentic AI emerges as the breakthrough force that doesn’t just automate but intelligently orchestrates marketing at scale.

These next-gen AI agents don’t wait for commands; they anticipate, act and adapt 24/7.
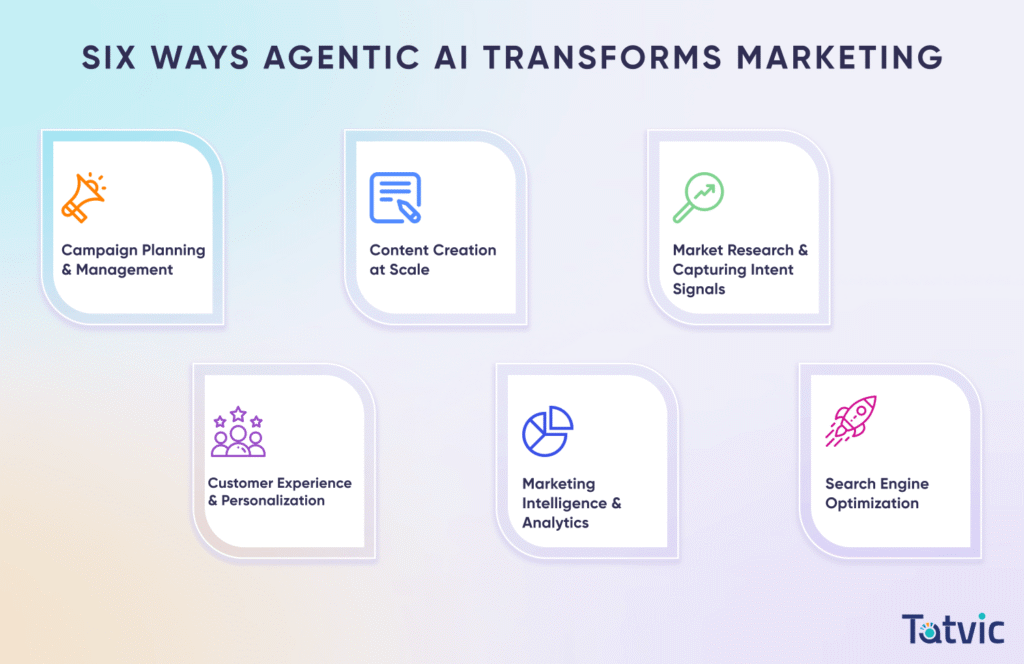
6 Ways How Agentic AI Is Transforming Marketing in 2025 - Tatvic

Here’s how Agentic AI is redefining what’s possible across the marketing value chain in 2026:

1. Campaign Planning & Management

Agentic AI independently plans, manages, and optimizes multi-channel campaigns from start to finish. With the right human-in-the-loop checkpoints, it ensures every marketing effort is both agile and effective.

  • Data-Driven Planning: AI agents scan real-time market signals-trending keywords, channel performance, and competitor moves-to draft ROI-ranked growth plans.
  • Scenario Forecasting: Run “what-if” models on budget, creative, and channel mix to predict campaign outcomes.
  • Live Optimization: Campaign blueprints refresh automatically as market conditions shift, keeping your strategy one step ahead.

2. Content Creation at Scale

Create compelling, tailored content across formats and platforms-intelligently crafted, iterated, and delivered by agents.

  • Smart Content Generation: Agents auto-write emails, ads, and landing pages based on real-time data and user behavior.
  • Multiformat Output: Instantly generate graphics, videos, and copy variants that adhere to brand standards.
  • Always-On Testing: Every creative element is tested and refined continuously to drive higher engagement.

3. Market Research & Capturing Intent Signals

Agentic AI captures a wide range of market signals and translates them into action-ready intelligence for sales and marketing.

  • Trend Monitoring: Track competitor launches, customer usage patterns, and industry shifts.
  • Intent Detection: Surface high-interest segments based on behavioral and contextual cues.
  • Actionable Inputs: Deliver timely recommendations to sales and marketing teams to act before opportunities or risks escalate.

4. Customer Experience & Personalization

Personalize digital journeys on the fly, using real-time signals to enhance engagement and improve customer experience.

  • Real-Time Journey Mapping: AI agents adjust user flows dynamically based on behavior, sentiment, and engagement.
  • Triggered Messaging: Deliver personalized emails, chat nudges, or app prompts exactly when needed.
  • Adaptive Personalization: Each customer’s path evolves as they interact-ensuring optimal relevance and conversion potential.

5. Marketing Intelligence & Analytics

Proactively surface insights, detect anomalies, and recommend the next best actions to steer marketing efforts in the right direction.

  • Predictive Forecasts: Access forward-looking projections on pipeline, revenue, and ROI.
  • Anomaly Detection: Flag dips, spikes, or unusual activity early-before they hurt performance.
  • Tactical Recommendations: Get guided advice on whether to scale, pause, or pivot-all within your dashboard.

6. Search Engine Optimization

Automate and scale your SEO strategy to stay ahead in search rankings-without manual lift.

  • Continuous Optimization: AI agents adjust keyword strategy, content structure, and internal linking in real-time.
  • SERP Intelligence: Monitor algorithm shifts and competitor positioning to protect your ranking.
  • Sustained Performance: Deliver long-term SEO results with adaptive, self-improving AI workflows.

Embedding these six intelligent capabilities into your marketing stack isn’t just future-proofing, it’s performance-proofing.

In 2026, Agentic AI for marketing automation isn’t just about working smarter; it’s about scaling faster, executing sharper, and connecting deeper than humanly possible.

How Agentic AI Marketing Automation Works Across Critical Jobs

Each marketing function from demand generation to sales enablement benefits uniquely from Agentic AI for marketing automation.
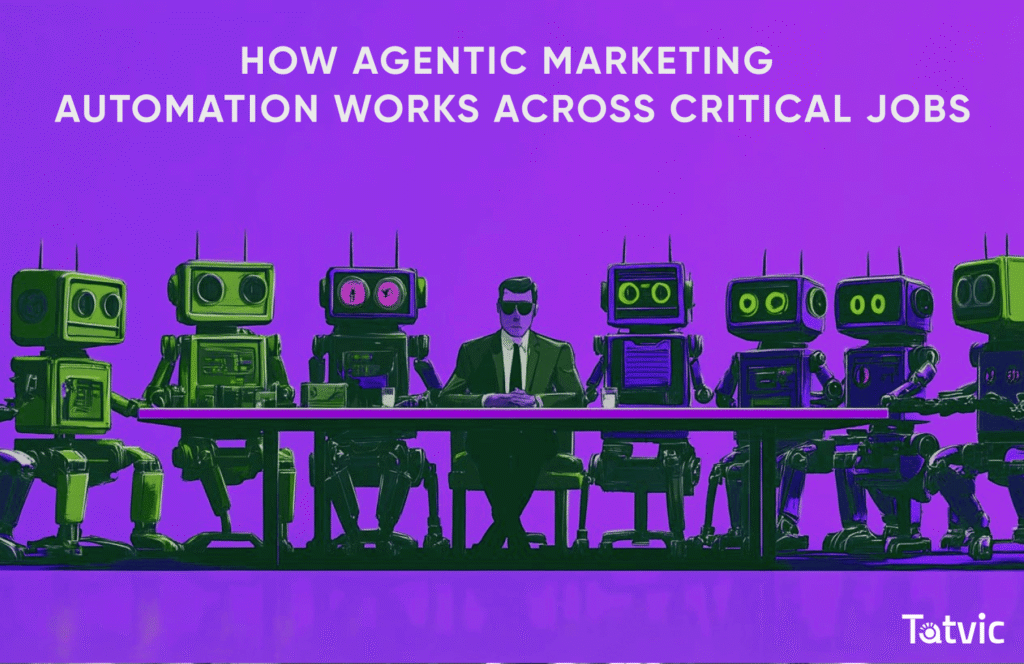
How Agentic Marketing Automation Works Across Critical Jobs

Below are role-based ‘Agent Recipes’ with key inputs and actions:

1. Demand Generation & Lead Nurturing

Inputs: Website behavior, firmographics, intent signals
Agent Actions:

  • Dynamically adjust offer thresholds based on visitor engagement
  • Send targeted drip-email sequences
  • Trigger retargeting ads when intent signals spike

2. Creative & Content Personalization

Inputs: Demographic profiles, past interactions, time of day
Agent Actions:

  • Generate personalized subject lines and headlines
  • Create hero banners and ad visuals tailored to audience segments
  • Rotate and test creative variants in real time

3. Marketing Analytics & Insights

Inputs: Cross-channel performance metrics, attribution models, spend data
Agent Actions:

  • Auto-generate consolidated dashboards
  • Flag anomalies or unexpected performance shifts
  • Recommend budget reallocations to maximize ROI

4. Sales Enablement & Handoff Automation

Inputs: CRM activity logs, lead scores, engagement triggers
Agent Actions:

  • Alert sales reps to high-intent leads instantly
  • Auto-populate relevant case studies or collateral in outreach emails
  • Schedule follow-up tasks and reminders within CRM

By aligning each agent’s inputs with precise actions, Agentic AI seamlessly automates and optimizes critical marketing jobs, so your teams can focus on strategy and growth.

Tatvic’s 4A Framework for Agentic AI Adoption in Marketing

Tatvic’s 4A Framework provides a clear, step-by-step roadmap to adopt Agentic AI in your marketing stack from uncovering the highest-value opportunities to scaling proven pilots organization-wide.

It helps marketing leaders navigate technical readiness, prioritize quick wins, and align AI initiatives with business goals.

By systematically moving through each stage, organizations can reduce adoption risk, accelerate ROI, and build lasting competitive advantage in a rapidly evolving digital landscape.
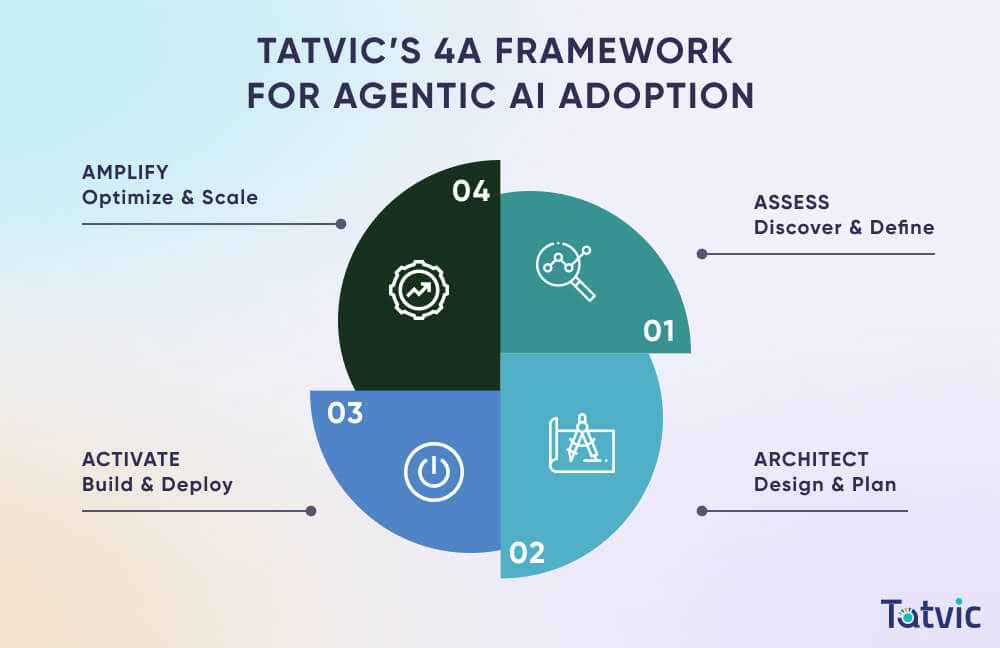
Tatvic’s 4A Framework for Agentic AI Adoption in Marketing

1. ASSESS: Discover & Define

The journey starts by evaluating your current marketing capabilities and data landscape. This phase identifies where Agentic AI can make the most immediate impact.

  • Audit Existing Systems: Evaluate CRM, CDP, analytics, and ad platforms for data quality, coverage, and governance gaps.
  • Identify AI Opportunities: Pinpoint high-impact use cases where intelligent agents can drive efficiency or unlock new value.
  • Define KPIs & Roadmap: Set measurable goals (e.g., CPL, ROI, pipeline contribution) and outline a phased implementation plan.

2. ARCHITECT: Design & Plan

With opportunities identified, the next step is to build the architecture-defining the workflows, systems, and rules that your AI agents will operate within.

  • Design Agent Workflows: Map decision paths, triggers, and actions across your marketing ecosystem.
  • Plan Integrations: Align APIs, webhooks, and services for seamless interoperability with your current martech stack.
  • Set Guardrails: Establish governance policies and safeguards to ensure reliability, compliance, and trust.

3. ACTIVATE: Build & Deploy

Now it’s time to bring your agents to life. This phase involves configuring agents, integrating them into live systems, and training your team to work with the new model.

  • Deploy Pilot Agents: Launch AI agents in a controlled environment, aligned to specific use cases and KPIs.
  • Run Real-World Tests: Monitor performance in live conditions, with human-in-the-loop support to catch issues early.

Team Readiness: Train marketing teams on the new workflows, ensuring they’re equipped to manage and scale the solution.

4. AMPLIFY: Optimize & Scale

After validating success, it’s time to scale. This phase is about expanding agent coverage, optimizing based on real-world feedback, and embedding continuous learning.

  • Scale Across Campaigns: Extend AI adoption across regions, channels, and marketing functions.
  • Automate Optimization: Use feedback loops, automated alerts, and model retraining to keep agents sharp.
  • Track Value Over Time: Maintain dashboards and reporting cadences to ensure ROI, efficiency, and agility continue to improve.

Following these four steps ensures rapid pilots, seamless integration and sustained ROI unlocking autonomous marketing at scale.

Building Your Data & Technology Foundation for AI Marketing Automation

To unlock the full potential of Agentic AI for marketing automation, a strong data and tech foundation is essential.

Intelligent agents require more than just data they need a curated, governed, and interoperable system that delivers context and continuity across the customer journey. It starts with making sure your data is not only collected, but ready for real-time, autonomous action.
Building Your Data & Technology Foundation

1. Data Readiness

  • Completeness & Hygiene: Clean, de-duplicate, and normalize records to prevent decision errors.
  • Governance & Security: Implement data classification, encryption, and consent management in line with GDPR and CCPA.

2. Tech Stack Integration

  • CRM/CDP Connectivity: Native connectors for Salesforce, HubSpot, and major CDPs.
  • Ad Platform APIs: Seamless bid and budget control on Google Ads, LinkedIn, and programmatic platforms.
  • Analytics Streams: Real-time web behavior via Google Analytics, Adobe Analytics, or custom streams.

3. Scalable Infrastructure Readiness

  • Dynamic Resource Scaling: Utilize cloud-native platforms that automatically adjust compute and storage capacity to support AI agent training, testing, and real-time decision-making.
  • Performance Efficiency: Implement streamlined processing pipelines to ensure minimal delay for time-sensitive campaign execution.
  • Resilient & Future-Ready Systems: Build a flexible architecture that supports growing data volumes, evolving agent logic, and expanding use cases with ease.

Governance & Organizational Readiness for AI Marketing Automation

Integrating Agentic AI for marketing automation demands clear governance, ethical guardrails, and organizational readiness to assign accountability, uphold fairness, and drive user adoption.

These structures ensure autonomous decisions align with business objectives, comply with regulations, and maintain stakeholder trust.

1. AI Governance Framework

  • Define roles & responsibilities: AI Stewards, Data Owners, and an Ethics Board.
  • Establish approval workflows for high-impact agent decisions to maintain control and accountability.

2. Ethical & Compliance Guardrails

  • Privacy-by-Design: Consent management, data minimization, and encryption at every layer.
  • Bias Detection & Fairness Checks: Leverage explainable AI tools (e.g., SHAP dashboards) to ensure equitable decisioning.

3. Change Management & Center of Excellence

  • Launch an Agentic AI Center of Excellence (CoE) with executive sponsorship to drive adoption.
  • Develop training curricula and certification paths for marketers, analysts, and engineers.
  • Build an “AI Champions” network to share best practices, troubleshoot issues, and promote innovation.

4. Risk Monitoring & Audit Trails

  • Continuous drift detection, alerting, and automated retraining cadences.
  • Immutable logs capturing agent actions, human overrides, and compliance reports-essential for audits and regulatory reviews.

By embedding rigorous governance, continuous risk monitoring, and a dedicated Center of Excellence, you transform Agentic AI for marketing automation from a pilot into a trusted, enterprise-wide capability driving autonomous marketing safely, efficiently, and at scale.

Without a stable data foundation, even the smartest agents will deliver subpar results.

Next Steps & Interactive Tools ->

Instant ROI Calculator

Embed our Agentic AI for marketing automation ROI calculator to let prospects estimate their uplift in under five minutes turning passive readers into qualified leads.

➥ Schedule a Discovery Session with our Agentic AI Marketing experts & setting the stage for a rapid & low-risk rollout



How To Design Subscription Pricing Plans To Increase Your Recurring Revenue?

How To Design Subscription Pricing Plans To Increase Your Recurring Revenue

Pricing has always been one of the most debated and misunderstood pillars of marketing. But in 2026, subscription pricing plans are no longer just about choosing a number, they are about psychology, perceived value, behavioral economics, and long-term customer relationships.

You can have a great product. You can drive high-quality traffic. But if your subscription pricing model feels confusing, misaligned, or unfair, users will hesitate - or churn.

In today’s subscription-first economy, the real question is no longer “What should we charge?” It’s “How do we design subscription pricing plans that maximize recurring revenue while still feeling fair and valuable to customers?”

This guide breaks down exactly how to do that.

TL;DR

In 2026, subscription pricing plans are no longer just about choosing a number, they are a strategic growth lever that directly impacts recurring revenue, churn, customer lifetime value, and brand trust. High-performing subscription pricing models are built on real customer research, behavioral psychology, and continuous experimentation.

The most effective subscription pricing strategies focus on perceived value, clear tier differentiation, smart anchoring, usage-based expansion, and frictionless upgrades. Businesses that test pricing regularly, design intentional pricing tiers, restrict free plans by volume (not features), and optimize pricing pages for conversion consistently outperform competitors.

Simply put: pricing isn’t static anymore; it’s a CRO discipline.

Why Subscription Pricing Plans Matter More Than Ever in 2026

The global shift toward a subscription-first economy has permanently changed how customers evaluate pricing, value, and long-term commitment.

In 2026, customers no longer ask a one-time question like:

“Is this product worth the price?”

Instead, they ask a far more demanding question:

“Is this product worth paying for every single month?”

This mindset shift has massive implications for how subscription pricing plans and subscription pricing models must be designed.

Today, pricing is no longer just an acquisition lever. It directly influences whether customers stay, expand, downgrade, or churn.

Well-designed Subscription Pricing Plans Impact:

  • Monthly Recurring Revenue (MRR) by determining upgrade and expansion behavior
  • Net Revenue Retention (NRR) by supporting long-term value realization
  • Upsell and cross-sell opportunities through logical tier progression
  • Churn and downgrade rates, especially during renewal cycles
  • Customer Lifetime Value (CLV) by aligning price with sustained outcomes

A poorly designed subscription pricing plan doesn’t just reduce conversions at checkout. It quietly increases churn, erodes trust, and caps revenue growth over time.

That’s why modern subscription pricing models in 2026 must strike a careful balance between:

▸Profitability (for the business)
▸Fairness (for the customer)
▸Clarity (to reduce decision friction)
▸Scalability (to support long-term growth)

Pricing that feels confusing, unfair, or misaligned with value is no longer tolerated by today’s subscription-savvy users.

Step 1: Define the True Value of Your Product (Not Just the Cost)

Before designing or changing subscription pricing plans, it’s critical to understand how customers perceive value, not how internal teams assign prices to features.

In 2026, pricing decisions based on assumptions, internal opinions, or competitor imitation almost always fail.

Modern pricing strategy starts with one core principle:

Customers don’t pay for features. They pay for outcomes, confidence, and continuity.

How Modern Teams Discover Willingness to Pay

High-growth SaaS and subscription businesses rely on a combination of qualitative insight, behavioral data, and experimentation.

1. Customer Interviews and Sales Conversations

Direct conversations remain one of the most powerful pricing research tools.

Leading teams ask:

  • What problem were you trying to solve?
  • Which alternatives did you consider?
  • At what price would this feel too expensive?
  • At what price would you question the quality?

These conversations reveal how customers mentally anchor value - something analytics alone cannot capture.

2. Price Sensitivity and Value Threshold Analysis

Understanding price elasticity helps identify:

  • The upper price limit before resistance spikes
  • The lower price limit where quality perception drops

In subscription pricing models, underpricing is often more dangerous than overpricing.

3. Behavioral Signals From Usage Data

In 2026, pricing decisions are increasingly guided by product analytics.

Features that strongly correlate with:

  • Retention
  • Expansion
  • Daily or weekly usage
  • Account stickiness

should directly influence pricing tiers and upgrade paths.

If a feature drives long-term value, it should shape how pricing plans are structured.

4. Live Pricing Experiments and Controlled Testing

Modern teams treat pricing as an evolving system.

Responsible pricing experiments such as testing plan framing, tier composition, or value messaging-often uncover insights that theoretical models miss entirely.

Even small pricing changes can significantly impact:

  • Revenue per user
  • Upgrade rates
  • Long-term retention

👉 Lower pricing does not automatically increase conversions.


Step 2: Choose the Right Subscription Pricing Model for Your Business

There is no universal “best” subscription pricing model.

In 2026, the most successful subscription pricing plans are not the most complex or flexible they are the ones that align pricing with how customers experience value over time.

Your pricing model should answer one core question clearly:

How does a customer’s value increase as they continue using your product?

When pricing and value delivery move in sync, retention improves naturally and churn drops without aggressive discounts.

Subscription Pricing Models That Perform Well

Below are the most effective subscription pricing models used by high-growth SaaS and digital businesses today along with when to use them.

1. Tiered Subscription Pricing Plans

Tiered pricing remains the most widely adopted and trusted model.

It works best when:

  • Product value increases with features, sophistication, or scale
  • Customers naturally grow from basic to advanced use cases
  • Different user segments require different levels of functionality

Each tier should represent a clear upgrade in outcomes, not just a longer feature list.

2. Usage-Based Pricing Models

Usage-based pricing has surged in popularity, especially with AI-driven products.

Ideal for:

  • AI tools and copilots
  • APIs and developer platforms
  • Analytics, data, and infrastructure services

Customers pay based on consumption (queries, credits, events, tokens, usage units), which feels fairer and lowers initial friction.

In 2026, many users prefer paying for what they use rather than committing to oversized plans.

3. Per-Seat or Per-User Pricing

Still common in B2B SaaS, collaboration tools, and internal platforms.

This model works when:

  • Value scales with team size
  • Collaboration and shared access are core use cases
  • Seat-based expansion aligns with revenue growth

However, in 2026, many companies are refining this model to avoid penalizing adoption often pairing it with usage or feature limits.

4. Hybrid Subscription Pricing Models

Hybrid models combine a base subscription with usage, credits, or add-ons.

Examples include:

  • Base platform fee + AI credits
  • Core plan + premium integrations
  • Subscription + overage charges

This model is increasingly popular for AI products because it balances predictability with scalability.

Hybrid subscription pricing models often deliver the highest Net Revenue Retention (NRR) when implemented thoughtfully.

5. Freemium Subscription Models

Freemium still works but only when designed intentionally.

Best suited for products that:

  • Benefit from habit formation
  • Deliver value quickly
  • Improve with long-term engagement

In 2026, successful freemium models typically limit volume, not features, allowing users to experience full value while encouraging natural upgrades.

The Real Goal of Subscription Pricing Models

The goal isn’t flexibility for its own sake.

It’s alignment between:

  • What customers pay
  • What they use
  • What they value
  • And what keeps them subscribed

When pricing feels logical, customers don’t question it, they commit to it.

Step 3: Treat Pricing as an Ongoing Experiment, Not a One-Time Decision

One of the biggest mistakes businesses make is treating subscription pricing plans as “set and forget.”

In reality, pricing optimization is continuous.

Markets evolve. Products mature. Customer expectations change. Your pricing must evolve with them.

What You Should Be Testing Regularly

High-performing teams continuously test and refine:

  • Price points (incremental increases or decreases)
  • Monthly vs annual pricing and discount framing
  • Feature bundling across tiers
  • Plan naming and copy clarity
  • Which plan is visually highlighted or recommended
  • Anchoring effects between entry, middle, and premium tiers

Even subtle changes, such as reordering plans or reframing value - can produce significant gains in recurring revenue without impacting acquisition volume.

How Pricing Success Is Measured in 2026

Modern pricing performance is not judged by sign-ups alone.

Instead, leading teams evaluate:

  • Revenue per visitor
  • Retention and churn trends
  • Expansion and upgrade rates
  • Net Revenue Retention (NRR)
  • Long-term Customer Lifetime Value (CLV)

If sign-ups increase but churn rises, pricing is misaligned.

Sustainable growth comes from pricing that compounds value over time.

Step 4: Use Tiered Pricing to Guide Decisions; Not Confuse Users

Humans don’t evaluate prices in isolation. They compare.

That’s why tiered subscription pricing plans remain one of the most effective decision-guiding frameworks in 2026.

The Strategic Role of the Middle Plan

The middle plan is rarely just another option.

In many cases, it serves as a psychological anchor.

Its role is to:

  • Reduce decision fatigue
  • Provide a clear comparison reference
  • Make the premium plan feel like a logical step up

In numerous pricing experiments, simply reshaping or repositioning the middle tier has increased premium plan adoption even when the middle tier itself sees minimal purchases. This is behavioral economics in action.

Customers think:

“For a little more, I get significantly more value.”

When done right, tiered pricing:

  • Feels helpful, not manipulative
  • Guides users toward the right choice
  • Increases average revenue per customer

And importantly, it builds trust.


Perfect, this is already a strong foundation. I’ll enrich, modernize, and expand Step 5 & Step 6 so they’re:

  • 2026-accurate
  • Optimized for AEO, voice search, AI snippets, and LLM retrieval
  • Naturally infused with Subscription Pricing Plans and Subscription Pricing Models (plus LSI terms)
  • Human, authoritative, and EEAT-aligned
  • Ready to plug directly into your long-form blog

Step 5: Free Plans Still Work If You Restrict the Right Things

Free plans are not obsolete in 2026. What’s obsolete is offering too much value without a growth ceiling.

High-performing subscription businesses no longer use free plans as a blunt acquisition tactic. Instead, free tiers are designed as controlled onboarding ecosystems that introduce value, build trust, and create organic upgrade momentum.

How High-Growth Products Design Free Plans

The most effective freemium subscription pricing models follow a clear philosophy:

“Let users feel success - but not scale it.”

Winning free plans typically:

  • Provide access to core functionality (so users experience real value)
  • Restrict volume, limits, or automation, not usability
  • Lock advanced analytics, governance, integrations, or AI controls
  • Introduce natural upgrade triggers as usage increases
  • Align free-tier constraints with real business growth moments

For example:

  • A CRM may limit active contacts
  • An AI tool may cap monthly generations
  • An analytics platform may restrict historical data or exports
  • A SaaS tool may disable workflows, scheduling, or automation at scale

This approach ensures users don’t hit artificial walls, they hit meaningful ones.

Why This Works Psychologically

Well-designed free subscription pricing plans:

  • Build trust before asking for commitment
  • Encourage habit formation and daily usage
  • Allow users to self-qualify for paid plans
  • Make upgrades feel inevitable, logical, and value-driven

In 2026, the free plan’s success metric is not immediate conversion.
It’s:

  • Time-to-value
  • Activation depth
  • Expansion readiness
  • Long-term customer lifetime value (CLV)

A free plan should answer one question clearly:

“What will this product unlock for me when I grow?”

Step 6: Optimize Your Pricing Page for Conversion Psychology

Your pricing page is no longer just a comparison table. In 2026, it functions as a decision engine.

Users often visit pricing pages after they already believe in the product. What they’re seeking is reassurance, clarity, and confidence not persuasion.

What High-Converting Pricing Pages Focus On

The best-performing subscription pricing pages optimize for cognitive ease, not information overload.

They emphasize:

  • Clear differentiation between subscription pricing plans
  • Transparent, upfront pricing (no hidden usage surprises)
  • Value-oriented copy that explains who each plan is for
  • A clearly highlighted “Best Value” or “Most Popular” plan
  • Contextual social proof near pricing (logos, stats, testimonials)
  • Simple upgrade, downgrade, and cancellation paths

Pricing pages that remove friction consistently outperform those that try to explain every feature.

How Modern Pricing Pages Guide Decisions

High-performing subscription pricing models use subtle behavioral cues:

  • Strategic plan ordering to anchor value
  • Visual emphasis on the recommended tier
  • Annual vs monthly pricing framed around savings, not discounts
  • Plain-language labels instead of internal feature jargon
  • Short, scannable benefit bullets over dense feature matrices

The result? Users feel in control - and confident enough to commit.

Common Subscription Pricing Mistakes That Limit Revenue

Even mature SaaS and subscription businesses still lose revenue due to avoidable pricing errors:

  • Guessing prices without customer research
  • Overloading tiers with confusing or overlapping features
  • Hiding pricing behind sales calls too early in the journey
  • Heavy discounting that anchors low perceived value
  • Ignoring churn, downgrade, and expansion data

Pricing is not just a revenue lever; it’s a trust signal.

If your subscription pricing plans feel confusing, manipulative, or unclear, users don’t just hesitate, they leave.

Conclusion: Subscription Pricing Is a Growth Strategy, Not a Math Problem

In 2026, subscription pricing plans are no longer a tactical exercise focused on squeezing more revenue per user.

They are a core growth strategy.

Modern pricing decisions shape how customers perceive value, how long they stay subscribed, and how confidently they expand over time.

The most successful businesses design subscription pricing models that focus on:

  • Aligning price with perceived and experienced value
  • Building trust through clear, transparent pricing
  • Reducing friction at high-intent decision moments
  • Supporting long-term customer growth, not short-term wins

Pricing that feels intuitive and fair doesn’t need aggressive persuasion, it earns commitment.

This is why the best subscription pricing models in 2026 are never static.

They evolve continuously, guided by:

  • Real customer behavior and usage data
  • Behavioral economics and decision psychology
  • Ongoing CRO experimentation across pricing pages, plans, and packaging

When pricing is treated as a living system not a one-time setup, the results compound:

  • Conversions increase
  • Churn and downgrades decline
  • Expansion revenue accelerates
  • Monthly recurring revenue becomes more predictable

Where Tatvic Fits In

At Tatvic, subscription pricing is approached as a conversion and growth discipline, not a spreadsheet exercise.

By combining:

  • Deep customer behavior analysis
  • Data-driven experimentation
  • Conversion rate optimization (CRO) frameworks
  • And continuous performance measurement

Tatvic helps SaaS and subscription businesses design pricing strategies that scale with customer value, not against it.

Because when pricing works in harmony with how users grow, adopt, and succeed recurring revenue doesn’t just grow, it compounds.

And that’s the real power of well-designed subscription pricing plans in 2026.

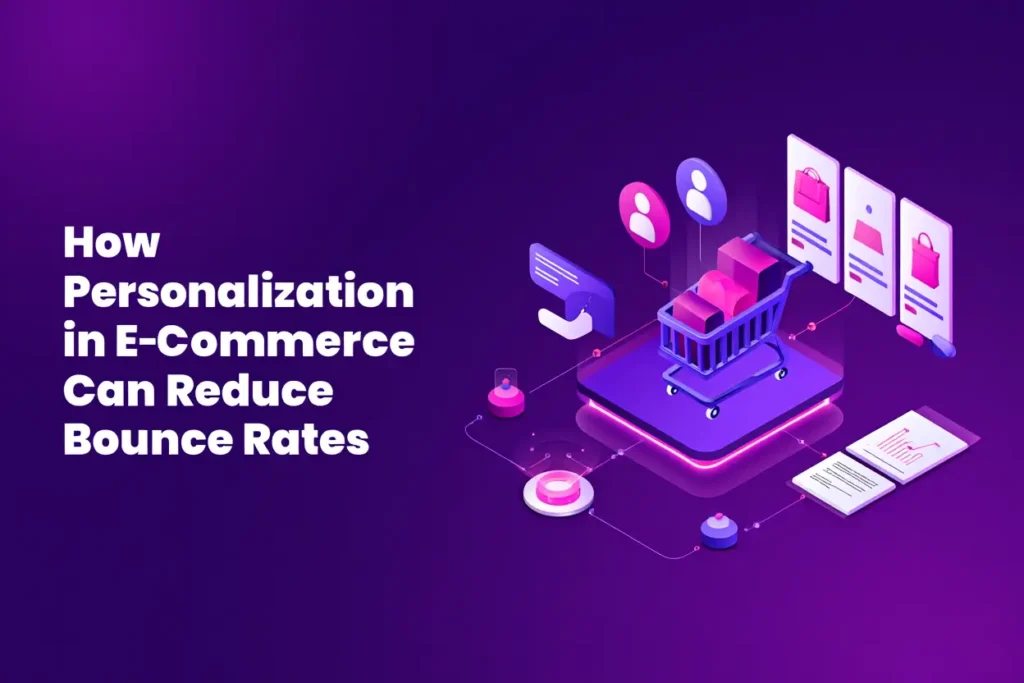
How eCommerce Personalization Can Reduce Bounce Rates in 2026

How Personalization in E-Commerce Can Reduce Bounce Rates

In 2026, eCommerce success is no longer driven just by traffic, it’s driven by relevance. You can bring thousands of users to your online store, but if your experience fails to connect with them in the first few seconds, they’ll leave without hesitation.

This is where eCommerce personalization becomes a growth lever, not just a UX enhancement.

Let’s break down what bounce rate really means today, why it’s rising for many eCommerce brands, and how modern, AI‑powered personalization can dramatically reduce bounce rates while improving conversions and customer lifetime value.

TL;DR

In 2026, high eCommerce bounce rates are less about traffic quality and more about lack of relevance. Users decide whether to stay or leave within milliseconds, and generic, one-size-fits-all experiences no longer work.

eCommerce personalization powered by AI and real-time behavioral data helps reduce bounce rates by showing users the right products, content, offers, and messages at the right moment. From personalized homepages and smart search results to dynamic product recommendations, exit-intent offers, and AI chat support, personalization keeps users engaged and moving toward conversion.

The more understood a visitor feels, the longer they stay and the more likely they are to convert. In short, personalization is no longer optional; it’s essential for sustainable eCommerce growth.

What Is Bounce Rate on an eCommerce Website?

Bounce rate on an eCommerce website refers to the percentage of visitors who leave after viewing only one page, without taking any meaningful action. A “meaningful action” typically includes:

  • Clicking to another page or category

  • Using on-site search

  • Viewing a product detail page

  • Adding a product to the cart or wishlist

  • Signing up, scrolling meaningfully, or engaging with content

In simple terms, bounce rate answers one critical question:
Did the visitor find enough value to continue their journey?

In 2026, this decision happens almost instantly. Multiple studies show that users form an impression of a website in under 100 milliseconds. If the page feels slow, irrelevant, confusing, or generic, users mentally reject it before consciously thinking about it.

It’s important to note that a bounce doesn’t always indicate poor traffic quality. Some users may find quick answers and leave. However, consistently high bounce rates in eCommerce almost always signal a mismatch between user expectations and the on-site experience.

This mismatch could be related to content relevance, product discovery, trust, performance, or personalization.

Why Do eCommerce Bounce Rates Increase in 2026?

User expectations in 2026 are no longer set by average online stores, they’re shaped by Amazon, Netflix, Google, Apple, and AI-first platforms. These brands have trained users to expect speed, relevance, personalization, and clarity by default.

When an eCommerce website fails to meet these expectations, visitors leave without hesitation.

Why Do eCommerce Bounce Rates Increase in 2026?

The Most Common Reasons Behind Increasing eCommerce Bounce Rates Include:

  • Generic, non-personalized landing pages that treat every visitor the same

  • Poor mobile experience, accessibility gaps, or inconsistent layouts across devices

  • Confusing UI/UX, cluttered pages, and cognitive overload

  • Irrelevant or static product recommendations

  • Intrusive pop-ups and aggressive ads that interrupt intent

  • Slow page load speeds, especially on mobile networks

  • Misleading headlines or ad-to-page mismatch

  • Lack of trust signals, such as reviews, ratings, return policies, and security badges

  • Broken links, errors, or technical friction

  • Weak, unclear, or poorly placed calls-to-action (CTAs)

At its core, the problem isn’t traffic or marketing spend.

➥ The real issue is that the website does not adapt to the user.

And in a world where users expect relevance instantly, non-adaptive experiences lose attention fast.

👉 You may also like to read: Latest Conversion Rate Optimization (CRO) Trends to Follow in 2026 & Beyond


The Solution: eCommerce Personalization

In 2026, the most effective way to reduce eCommerce bounce rates is through intelligent personalization. Instead of presenting the same experience to every visitor, eCommerce personalization adapts the website in real time to match each user’s intent, behavior, and context. By delivering relevant products, content, and messages at the right moment, personalization removes friction, increases engagement, and encourages users to continue their journey rather than exit.

What Is eCommerce Personalization?

eCommerce personalization is the practice of dynamically tailoring the shopping experience-including content, product recommendations, offers, layouts, and messaging based on individual user behavior and intent.

eCommerce Personalization leverages data such as:

  • Browsing behavior and on-site interactions

  • Purchase and transaction history

  • Search queries and product affinity

  • Device type, location, and time of visit

  • Demographics and lifecycle stage

  • Engagement patterns across sessions

In 2026, eCommerce personalization is no longer rule-based alone.

It is powered by:

  • AI and machine learning models

  • Real-time behavioral signals

  • Predictive intent analysis

  • Context-aware decision engines

This allows brands to respond instantly to what a user is most likely to want right now, not just what they did in the past.

When eCommerce personalization is done right:

  • Users feel understood rather than targeted

  • Navigation feels intuitive instead of overwhelming

  • Product discovery becomes effortless

  • Bounce rates drop naturally as engagement rises

In short, eCommerce personalization transforms eCommerce from a static catalog into a responsive experience one that keeps users engaged, reduces bounce rates, and accelerates conversions.

Key Benefits of eCommerce Personalization in Reducing Bounce Rate

Effective eCommerce personalization is no longer just a UX enhancement, it’s a measurable growth driver. When personalization is executed with intent and intelligence, it directly impacts how long users stay, how deeply they engage, and whether they convert.

Brands using advanced personalization consistently see:

  • Higher user engagement and longer session durations
  • Significantly lower bounce and exit rates
  • Improved conversion rates across devices
  • Increased average order value (AOV) through relevant upsells
  • Stronger brand trust and emotional loyalty
  • Higher customer lifetime value (CLV) driven by repeat purchases

The common thread?
Personalized experiences make users feel understood and understood users don’t bounce.

eCommerce Personalization Strategies to Reduce Bounce Rates

Let’s explore practical, high-impact eCommerce personalization strategies that eCommerce leaders are using in 2026 to reduce bounce rates and increase conversions.

1. Personalize the Homepage Experience

Your homepage is the first impression and primary decision point for most visitors.

In 2026, top-performing eCommerce brands no longer show a static homepage. Instead, they dynamically adapt the experience based on user context and intent.

Modern homepage personalization includes:

  • Serving different layouts and content to new vs returning users
  • Highlighting trending, best-selling, or seasonal products for first-time visitors
  • Resuming journeys for returning users by showing recently viewed, saved, or carted items
  • Adapting banners, CTAs, and messaging based on traffic source, campaign, or referral intent

For new visitors, clarity is critical. Clean navigation, strong value propositions, trust badges, and popular categories help users orient themselves quickly.
For returning users, continuity reduces friction. Familiar products, remembered preferences, and contextual recommendations encourage deeper exploration instead of exits.

Personalize the Homepage Experience

2. Recommend Categories and Products Based on Browsing History

Browsing behavior is one of the strongest intent signals in eCommerce personalization.

By analyzing what users view, hover over, scroll through, or interact with, brands can:

  • Display recently viewed or high-interest categories
  • Recommend similar or complementary products
  • Reduce cognitive load and product discovery friction

When users immediately see products aligned with their interests, the experience feels effortless not overwhelming. This relevance dramatically reduces frustration-driven bounces.

3. Personalize Search Results With AI-Driven Smart Search

On-site search users typically have high purchase intent, making search personalization one of the most effective bounce-rate reducers.

In 2026, AI-powered smart search includes:

  • Predictive autocomplete and intelligent query suggestions
  • Personalized search results based on past behavior and preferences
  • Visual and image-based product search
  • Natural language queries such as “black running shoes under $100”

A fast, accurate, and personalized search experience helps users find what they want instantly - keeping them engaged and moving toward conversion instead of exit.

4. Use Dynamic Content and Contextual Messaging

Every visitor arrives with a different motivation, mindset, and expectation.

Dynamic content personalization allows brands to:

  • Change banners, headlines, and CTAs in real time
  • Show category-specific or intent-based offers
  • Personalize messaging based on location, season, device, or lifecycle stage
  • Trigger incentives for new users, returning users, or loyal customers

For example, a discount aligned with the category a user is browsing feels helpful and relevant - while generic offers often feel intrusive and increase bounce.

Personalize Product Pages and Segment Users

5. Personalize Product Pages and Segment Users

Product pages are where buying decisions are made and where personalization has the highest ROI.

Effective product page personalization includes:

  • “Customers also bought” and “frequently bought together” recommendations
  • Intelligent cross-sell and upsell suggestions
  • Contextual social proof (reviews, ratings, popularity)
  • Dynamic offers or pricing for loyal or high-value customers

User segmentation further enhances relevance.

Common segments include:

  • New visitors
  • Returning browsers
  • First-time buyers
  • Repeat or high-value customers

Each segment can receive tailored messaging, product recommendations, and follow-up communication reducing bounce-back behavior and increasing purchase likelihood.

6. Use Personalized Exit-Intent Offers and Smart Triggers

Exit-intent personalization is your final opportunity to retain a user before they leave.

In 2026, effective exit-intent strategies are contextual and restrained, including:

  • Personalized discounts based on viewed products or categories
  • Cart or wishlist reminders
  • Lead capture offers aligned with user interest
  • Helpful messages instead of aggressive pop-ups

When timed correctly, exit-intent personalization can recover abandoning sessions. When overused, it increases bounce making relevance and timing critical.

Use Personalized Exit-Intent Offers and Smart Triggers

7. Offer Real-Time Assistance With Chatbots and Live Support

Conversational commerce is now a core part of eCommerce personalization.

AI-powered chatbots and live chat help by:

  • Answering product, delivery, and policy questions instantly
  • Guiding users through decision-making in real time
  • Recommending products conversationally
  • Reducing uncertainty and purchase hesitation

Personalized, real-time assistance builds trust and trust keeps users engaged longer, reducing bounce rates across the funnel.

Conclusion: Personalization Is the Foundation of Sustainable eCommerce Growth

High bounce rates are rarely random. They are clear behavioral signals.

Signals that visitors didn’t find what they were looking for fast enough, relevant enough, or intuitively enough.

In 2026, reducing bounce rates is no longer about driving more traffic, adding more pop-ups, or pushing deeper discounts. It’s about delivering relevance at every moment of the user journey. And that relevance is powered by eCommerce personalization.

To consistently reduce bounce rates and increase conversions, modern eCommerce brands must:

  • Understand user intent deeply using real-time behavioral and contextual data

  • Deliver personalized experiences across every touchpoint, from homepage to checkout

  • Leverage AI and machine learning responsibly to anticipate needs without overwhelming users

  • Build trust through transparency, accuracy, and relevance rather than aggressive tactics

When customers feel understood, they don’t rush to leave. When they stay longer, they explore more. And when the experience feels effortless and personal, conversions follow naturally.

But eCommerce personalization isn’t just about selling more products.

It’s about building long-term relationships, reducing friction, earning trust, and creating shopping experiences that customers genuinely want to return to again and again.

This is where having the right Conversion Rate Optimization (CRO) partner makes all the difference.

Tatvic is one of the leading CRO agencies helping eCommerce brands in 2026 reduce bounce rates, unlock higher conversion rates, and scale sustainably through data-driven experimentation, AI-powered personalization, and advanced analytics. With deep expertise across GA4, experimentation frameworks, and personalization engines, Tatvic helps brands turn user intent into measurable growth.

If you’re looking to reduce bounce rates, improve conversions, and build high-performing personalized eCommerce experiences: 👉 Connect with Tatvic’s CRO experts today and start turning relevance into revenue.

Top 10 Interactive Advertising Examples in 2026 That Actually Drive Engagement

Top 10 Interactive Advertising Examples in 2025 That Actually Drive Engagement - Tatvic

Do You Know Why Standard Ads Are Fading  And Interactive Ads Are Winning!

In 2026, the digital advertising landscape is undergoing a seismic shift.

The average internet user is exposed to over 10,000 ads each day, a number that has nearly doubled over the past five years.

With so much noise, traditional static banner ads are struggling to break through.

The result?

A phenomenon known as banner blindness, where users subconsciously ignore anything that looks like an ad.

Even more concerning for marketers is the steady decline in user attention spans, now averaging just 7.2 seconds, shorter than ever before.

As consumers grow savvier and more selective, brands are being forced to rethink how they capture-and keep-attention in a saturated digital space.

That’s where interactive advertising comes in.

Unlike passive display ads, interactive ads invite users to participate, scroll, swipe, tap, spin or respond.

This level of involvement not only enhances user engagement but also improves brand recall and click-through rates (CTR).

We’re seeing a major pivot, marketers are shifting to interactive advertising formats because they work. Engagement rates are 3x higher than static ads,” says industry research from eMarketer’s 2026 report.

In fact, interactive ads are changing digital marketing in fundamental ways. They turn ads from disruptions into experiences.

Whether it’s a spin-the-wheel discount game, a quiz that tailors product recommendations, or a 360° product view, these ad formats are built to delight, engage, and convert.

For performance-driven marketers, it’s not just a creative choice, it’s a strategic imperative.

As personalization and immersive content become baseline expectations, interactive advertising is no longer optional, it’s essential.

What Are Interactive Ads?

Interactive ads are digital advertisements designed to actively engage the user by requiring some form of interaction: tapping, swiping, clicking, scrolling, speaking or playing.

Unlike traditional static ads that passively display content, interactive advertising transforms the user experience into a two-way conversation, encouraging participation and response.

The goal?

To drive deeper engagement, increase brand recall and boost click-through rates (CTR).

In an era where passive content is often ignored, these dynamic formats break through the noise by making users part of the storytelling process.

You’ll find interactive ad formats in a variety of forms like quizzes, polls, playable demos, gamified banners, 360° product views and even voice-command-enabled ads in smart environments.

As consumer expectations evolve in 2026, brands that embrace interactive advertising are seeing significantly higher ROI, more qualified leads and improved conversion rates.

Pro Tip
Interactive advertising consistently outperforms static ads with 2-5X higher engagement rates, making it a must-have in your 2026 ad strategy.

Why Use Interactive Advertising in 2026

In today’s hyper-competitive digital environment, brands can no longer afford to rely solely on passive banners and static creatives.

Interactive advertising is leading the way in 2026 by delivering tangible performance outcomes and enhancing user experience across platforms.

Here’s why interactive ads are outperforming traditional ad formats:

Top 5 Benefits of Interactive Ads in 2026

  • Reduces Banner Blindness

    Interactive ads cut through visual clutter by encouraging user actions. In 2026, over 78% of users admit to ignoring static banner ads, but formats that require swiping, clicking, or responding see 3x higher visibility rates.

  • Higher Engagement and CTR

    Interactive formats consistently outperform static ads. Click-through rates (CTR) for interactive creatives average 2.3%, compared to just 0.5% for standard display banners.

  • Better Brand Recall

    Experiences that involve interaction foster stronger memory retention. A recent Nielsen study revealed that interactive ads improve aided brand recall by 60%, making them ideal for brand-building campaigns.

  • Increased Conversions

    Interactive elements like quizzes, gamified offers or dynamic sliders encourage decision-making and micro-conversions. Brands report a 30-40% increase in post-click conversions when using interactive formats.

  • Real-Time Feedback and Insights

    Whether it’s collecting user preferences via polls or customizing journeys based on inputs, interactive ads offer real-time data to improve retargeting, personalization, and media efficiency.

Stat Snapshot: Interactive Ads vs Traditional Ads (2026)

Metric

Interactive Ads

Traditional Ads

CTR (Average) 2.3% 0.5%
Engagement Time (Average) 8.1 seconds 2.3 seconds
Conversion Rate (Post-Click) 3.8% 1.1%
Brand Recall (Aided) +60% +18%

As consumer expectations for personalization and meaningful experiences grow in 2026, the benefits of interactive ads are too compelling to ignore.

They’re no longer just a creative upgrade, they’re a strategic necessity.

Top 10 Interactive Advertising Examples That Work (2026)

Interactive advertising formats are driving deeper engagement, longer attention spans, and significantly better conversion metrics.

Here’s a curated list of the top 10 interactive ad formats that brands are using in 2026 to stand out in a cluttered digital world.

1. Lightbox Ads

  • What it is: A responsive ad format that expands into a full-screen rich media experience upon user interaction (hover/click).
  • Use Cases: Product launches, awareness campaigns, storytelling formats.
  • Results: Brands report up to 4X higher engagement compared to static banners.
  • Creative Example: An FMCG brand promoting a new beverage line with embedded video, scrollable features, and interactive product trials.
  • CTA Example: “Explore More” that expands the full ad.

Examples 1: Google Preview Lightbox | Interactive Media Advertising Examples | Tatvic

2. Chatbot Ads

  • What it is: AI-driven ad units that simulate human-like conversations inside display ads.
  • Use Cases: Customer support, lead qualification, product selection.
  • Results: Increases time-on-ad up to 300% and reduces bounce rate significantly.
  • Creative Example: An edtech platform guiding users to the right course via a chatbot quiz.
  • CTA Example: “Ask a Question” or “Find My Fit.”

Examples 2: Chatbot | Interactive Media Advertising Examples | Tatvic

3. Scratch Card Ads

  • What it is: Gamified ad format where users scratch the creative to reveal a surprise offer or message.
  • Use Cases: Promotions, product reveals, contests.
  • Results: Often achieves 5-6X higher CTRs in markets like India.
  • Creative Example: A skincare brand revealing its new line by letting users scratch to unveil it.
  • CTA Example: “Scratch to Reveal.”

Examples 3: Johnsons Cottontouch Scratch card | Interactive Media Advertising Examples | Tatvic

4. 360° Product Views

  • What it is: Allows users to rotate and explore a product from every angle within the ad.
  • Use Cases: Fashion, electronics, real estate, automotive.
  • Results: 2.6X increase in add-to-cart rates.
  • Creative Example: A car brand showing interiors and exteriors with a swipe-enabled 360° experience.
  • CTA Example: “Swipe to Rotate.”

Examples 4: CarDekho 360° | Interactive Media Advertising Examples | Tatvic

5. Spin the Wheel Campaigns

  • What it is: Gamified spinner that rewards users with discounts or prizes.
  • Use Cases: Coupon distribution, loyalty programs, lead capture.
  • Results: 3X improvement in email sign-up rates.
  • Creative Example: A D2C brand offering exclusive promo codes with spin-to-win.
  • CTA Example: “Try Your Luck.”

Examples 5: Spin&Win Scratch card | Interactive Media Advertising Examples | Tatvic

6. Survey-Based Display Ads

  • What it is: Interactive ads that ask users 1-3 short questions.
  • Use Cases: Market research, audience profiling, feedback collection.
  • Results: 2.5X boost in audience insights and conversion from personalized follow-ups.
  • Creative Example: A travel agency asking user preference to personalize vacation packages.
  • CTA Example: “Answer & Discover.”

Examples 6: Survey Ads | Interactive Media Advertising Examples | Tatvic

7. Carousel Ads (Swipeable)

  • What it is: Swipeable multi-frame ad format that showcases different products or features.
  • Use Cases: Ecommerce, product bundling, storytelling.
  • Results: 72% longer engagement vs single image ads.
  • Creative Example: A fashion brand showcasing seasonal outfits across swipeable frames.
  • CTA Example: “Swipe to View Styles.”

Examples 7: Carousel Ads | Interactive Media Advertising Examples | Tatvic

8. Parallax Ads (Mobile Web)

  • What it is: Multi-layer ad format that responds to user scrolls with depth illusion.
  • Use Cases: Mobile storytelling, immersive brand experiences.
  • Results: Doubled brand recall compared to traditional mobile banners.
  • Creative Example: A movie studio using layered visuals to tease upcoming film scenes.
  • CTA Example: “Scroll to Discover.”

Examples 8: Parallax | Interactive Media Advertising Examples | Tatvic

9. Slider Ads (Range-Based Selection)

  • What it is: Interactive slider lets users select variables (like age, budget, distance) within the ad.
  • Use Cases: Insurance, finance, SaaS, event planning.
  • Results: 3X higher lead qualification and personalization.
  • Creative Example: An insurance brand showing premium amounts based on the age selected.
  • CTA Example: “Adjust to See Your Rate.”

Examples 9: Slider Creatives | Interactive Media Advertising Examples | Tatvic

10. Stacked Card Formats

  • What it is: Swipeable card deck interface to showcase multiple offerings in a stack.
  • Use Cases: App installs, portfolio showcases, multi-product branding.
  • Results: 4X more user interaction than static formats.
  • Creative Example: A food delivery app showcasing different restaurants using card swipes.
  • CTA Example: “Swipe for More Options.”

Examples 10: Stacked Cards | Interactive Media Advertising Examples | Tatvic

These interactive advertising examples not only grab attention but turn passive viewers into active participants.
In 2026, mastering these interactive ad formats is no longer optional, it’s essential for modern marketers.
👉 Need help building rich media ads that work? Reach out to Tatvic’s Media Experts >>


Comparison Table: Interactive Ads vs Traditional Ads (2026)

Feature

Interactive Ads (2026)

Traditional Ads

Engagement
Very High - click, scroll, swipe, tap interactions drive deeper attention Low - users often ignore or skip static creatives
Click-Through Rate (CTR)
2.3% average, with formats like Spin & Scratch reaching up to 4% Around 0.5% on display networks
User Involvement
Active - encourages two-way interaction Passive - one-way messaging
Format Flexibility
High - supports gamification, dynamic elements, real-time inputs Limited - mostly static or basic video
Brand Recall
60-80% aided recall through immersive touchpoints 15-20% with minimal engagement
Conversion Rate
Higher - 2-4X increase in post-click conversions Lower - due to low engagement
Mobile Optimization
Built specifically for mobile-first interaction Often scaled down from desktop, lacks touch interactivity
Feedback Collection
Real-time - polls, sliders, chatbot inputs Rare or post-campaign only

Key Insight: In 2026, advertisers who shift to interactive ad formats not only combat banner blindness but also gain up to 5X higher ROI by capturing attention and driving meaningful actions.

Interactive Ads Success Metrics (2026)

Measuring the impact of interactive ads goes far beyond impressions.

In 2026, success is defined by how effectively an ad captures attention, drives interaction, and leads to meaningful action.

Here are the key performance indicators that define the success of interactive advertising formats:

  • Click-Through Rate (CTR):

    Interactive formats like Spin the Wheel or Scratch Cards routinely achieve CTRs between 2.3% to 4.1%, compared to traditional ads at 0.5%. This indicates stronger user intent and curiosity.

  • Engagement Time:

    Users spend an average of 7.8 to 10.2 seconds engaging with interactive creatives, thanks to gamified mechanics and swipe/tap gestures. Static banners barely cross the 2.5-second mark.

  • Scroll Depth:

    Interactive web formats such as Parallax Ads and Slider Ads encourage users to explore the content further, increasing scroll depth by 60-80% compared to passive display creatives.

  • Lead Conversion Rate:

    Interactive lead-gen formats show conversion rates up to 3.5X higher, especially when paired with dynamic CTAs and micro-surveys. Quizzes and calculators drive strong lead quality.

  • Brand Recall Uplift:

    Aided brand recall jumps to +65-75% with immersive ad units, especially when sensory engagement (e.g., swiping, sound, or animation) is involved.

How to Create Interactive Ads That Convert (2026)

Designing interactive ads that actually drive clicks, engagement, and conversions requires more than just flashy visuals. As users become more selective and scroll faster, marketers must craft experiences that feel personal, playful, and purposeful.

Here’s How to Build High Converting Interactive ADs in 2026:

  1. Start with a Strong Hook

    Use a bold question, provocative statement, or value-driven headline to grab instant attention. Example: “Ready to Win 20% Off? Spin the Wheel!”

  2. Gamify the Experience

    Incorporate mechanics like scratch cards, sliders, quizzes, or spin-the-wheel formats. This turns passive viewers into active participants, increasing time spent and memory recall.

  3. Design Mobile-First

    In 2026, over 85% of ad interactions happen on mobile. Ensure fast loading, thumb-friendly interactions, and vertical layouts that feel native to mobile platforms.

  4. Personalize the Content

    Use first-party data, product preferences, or browsing behavior to customize the interaction. A tailored quiz or dynamic product slider performs far better than one-size-fits-all creatives.

  5. Use Clear, Action-Oriented CTAs

    Every interactive element should lead somewhere. Examples include:

      • “Reveal My Offer”
      • “Swipe to Learn More”
      • “Play & Save”
👉 Request a Free Demo to see how interactive ads can work for your brand!

Bonus Section: Tools & Platforms for Interactive Advertising

In the rapidly evolving landscape of digital marketing, interactive advertising tools and platforms have become indispensable for creating engaging, personalized, and high-impact campaigns. Leveraging the right technology enables brands to captivate their audience, drive deeper engagement, and maximize ROI.

Here’s an overview of the top tools and platforms shaping interactive advertising in 2026.

Google Rich Media (Studio)

Google Rich Media Studio remains a premier platform for designing, building, and managing rich media ads that combine video, animation, and interactive elements. It integrates seamlessly with Google Ads and Display & Video 360, enabling marketers to create dynamic ad experiences optimized for cross-device delivery. In 2026, Google Studio supports advanced AI-driven optimization features, such as automated creative asset adjustment based on real-time user engagement data, ensuring ads stay relevant and perform at their best. Its robust analytics dashboard provides actionable insights, empowering advertisers to refine campaigns with precision.

Celtra

Celtra is a leading creative management platform (CMP) that empowers brands and agencies to produce, distribute, and optimize interactive and programmatic advertising at scale. Celtra’s no-code interface in 2026 enables marketers to rapidly design visually stunning, fully responsive rich media ads without relying on extensive developer resources. Advanced AI-powered creative analytics track engagement patterns and predict which creative variants resonate best with specific audience segments. This capability ensures campaigns are personalized and continuously optimized for maximum impact.

AdCreative.ai

AdCreative.ai is revolutionizing ad creation with its cutting-edge artificial intelligence platform designed to generate high-converting, interactive ad creatives automatically. By analyzing historical campaign data and consumer behavior trends, AdCreative.ai produces customized ad designs, copy, and calls-to-action optimized for performance across various digital channels. Its seamless integration with major ad networks streamlines campaign deployment, making it an invaluable tool for marketers seeking efficiency and scalability in 2026.

Playbuzz

Playbuzz specializes in interactive content formats such as quizzes, polls, surveys, and interactive stories that deeply engage audiences while collecting valuable first-party data. In 2026, Playbuzz offers enhanced capabilities to integrate gamification with programmatic advertising, creating immersive experiences that boost brand recall and user participation. Its easy-to-use platform supports multi-channel distribution and real-time performance tracking, helping brands create fun, data-rich campaigns that align with modern consumer expectations.

Tatvic’s Custom Solutions

Tatvic offers bespoke interactive advertising solutions tailored to unique business goals and audience needs. Combining deep expertise in data-driven marketing and advanced analytics, Tatvic crafts highly personalized rich media campaigns that leverage AI and real-time data to optimize user journeys. From custom-built interactive ad formats to seamless integration with platforms like Google Studio and Celtra, Tatvic’s solutions prioritize measurable impact, privacy compliance, and scalability. By partnering with Tatvic, brands unlock the full potential of interactive advertising to drive meaningful engagement and boost conversions in 2026.

Why Choose Interactive Advertising Tools in 2026?

With evolving consumer expectations and increasing competition for attention, interactive advertising tools offer:

  • Enhanced User Engagement: Create two-way communication channels that foster active participation.
  • Data-Driven Personalization: Leverage AI and real-time analytics for tailored user experiences.
  • Cross-Device Compatibility: Deliver seamless interactions on mobile, desktop, and connected devices.
  • Improved ROI Tracking: Use detailed analytics to continuously optimize campaigns.
  • Scalability & Speed: Rapidly deploy and update creatives without extensive technical dependencies.

Conclusion on Interactive ADs: Make ADs a Two-Way Conversation

In today’s fast-paced digital landscape, interactive advertising isn’t just a trend, it’s a vital strategy for future-proofing your campaigns. As consumers become more discerning and attention spans shorten, static ads no longer suffice. Engaging your audience in meaningful, two-way conversations transforms passive viewers into active participants, fostering deeper connections and brand loyalty.

The power of interactive advertising lies in its ability to drive better engagement, which naturally leads to better ROI. When audiences interact with your ads-whether through quizzes, polls, dynamic content, or rich media experiences, they spend more time with your brand, absorb your message more effectively, and are more likely to convert. This engagement data also provides valuable insights that enable continuous campaign optimization, ensuring your marketing budget delivers maximum impact.

At Tatvic, we specialize in helping brands unlock the full potential of interactive advertising. Our cutting-edge solutions and expertise in data-driven marketing empower businesses to craft personalized, immersive ad experiences that resonate with modern consumers. By partnering with Tatvic, you gain a competitive edge, turning every ad into a compelling conversation that drives measurable business growth in 2026 and beyond.

Make your advertising interactive with Tatvic and watch your brand engagement and ROI soar >>


Firebase A/B Testing for Mobile Apps: The Complete 2026 Guide to Experimentation, Analysis & Scaling

Firebase AB Testing for Mobile Apps The Complete 2026 Guide - Tatvic


TL;DR

In 2026, mobile growth is no longer driven by intuition. Every design change, feature launch, notification, or pricing tweak must be backed by measurable impact. That’s exactly where Firebase A/B Testing comes in.

Firebase A/B Testing enables product, growth, and marketing teams to experiment safely, analyze outcomes accurately, and scale winning experiences without app updates, heavy engineering dependency, or fragmented tools.

This guide covers everything you need to know about Firebase A/B Testing in 2026 from fundamentals to advanced experimentation, analysis, and scaling strategies used by high-growth apps.

What Is Firebase A/B Testing?

Firebase A/B Testing is a native, enterprise-grade experimentation framework that enables product, growth, and marketing teams to test, validate, and optimize mobile app experiences in real time without forcing users to update the app.

In simple terms, Firebase A/B Testing allows you to safely answer one critical question before every release:

“Will this change actually improve user behavior, retention, or revenue?”

Using server-side configuration, teams can experiment with:

  • App UI and layouts

  • Feature rollouts and feature flags

  • Push notification strategies

  • In-app messaging formats and timing

  • Monetization flows, pricing, and paywalls

all while maintaining app stability and user trust.

How Firebase A/B Testing Works (2026 Stack)

Firebase A/B Testing is powered by a tightly integrated Google ecosystem:

  • Firebase Remote Config
    Delivers experiment variants dynamically, enabling instant changes without app store approvals.

  • Firebase Analytics (GA4)
    Measures user behavior, conversions, retention, and revenue across the full app lifecycle.

  • Google’s Statistical Modeling Engine
    Evaluates experiment performance using confidence thresholds and probability-to-win models.

  • BigQuery
    Enables advanced analysis such as cohort impact, long-term retention, lifetime value (LTV), and cross-channel attribution.

This native integration makes Firebase A/B Testing significantly more reliable and scalable than third-party experimentation tools.

How Firebase A/B Testing Differs from Traditional A/B Testing Tools

Unlike legacy experimentation platforms, Firebase A/B Testing:

  • Does not require app updates to test changes

  • Scales seamlessly across Android and iOS apps

  • Aligns with modern privacy, consent, and data governance standards

  • Minimizes developer involvement through server-side controls

  • Reduces experimentation risk with controlled rollouts and guardrails

As a result, teams can experiment faster without compromising performance, compliance, or user experience.

Why Firebase A/B Testing Is Critical in 2026

Mobile experimentation has fundamentally changed.

In 2026, growth teams operate in an environment shaped by:

  • Privacy-first measurement regulations (consent mode, limited identifiers, platform restrictions)

  • Faster release cycles driven by agile and continuous delivery models

  • AI-assisted product optimization and predictive insights

  • Cross-platform user journeys spanning web, app, and paid media

  • Lean engineering teams with limited bandwidth for repeated deployments

In this landscape, relying on intuition or post-release fixes is no longer viable.

How Firebase A/B Testing Solves These Challenges

Firebase A/B Testing enables modern teams to:

  • Learn faster without deployment delays
    Test and validate changes before full rollout.

  • Reduce developer dependency
    Product and growth teams can own experimentation via Remote Config.

  • Maintain accurate attribution across the app lifecycle
    Measure impact from first interaction to long-term retention.

  • Make data-driven decisions for every release
    Ship features backed by statistically validated outcomes, not assumptions.


Core Capabilities of Firebase A/B Testing

Firebase A/B Testing has evolved into a full-fledged experimentation and rollout framework for mobile-first businesses. In 2026, it enables teams to test faster, reduce risk, and scale winning experiences-without slowing down product development.
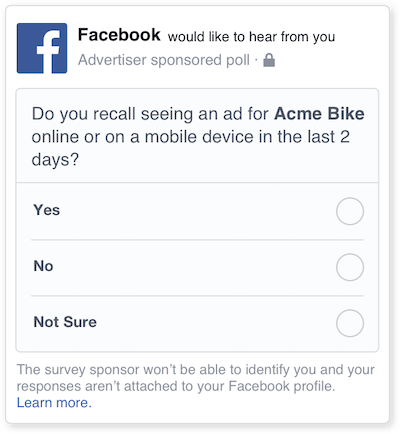
Below are the core capabilities that make Firebase A/B Testing essential for modern apps.

1. Product & UI Experimentation

Firebase A/B Testing allows teams to experiment with critical user-facing elements that directly influence engagement, conversions, and revenue.

You can test and optimize:

  • Button styles, colors, and CTAs
  • Onboarding flows and first-time user experiences
  • Navigation structures and screen layouts
  • Paywalls, pricing screens, and monetization flows
  • Feature flags and progressive feature releases

All changes are delivered dynamically via Firebase Remote Config, meaning:

  • No app update is required
  • Experiments can be launched or stopped instantly
  • Risk is controlled through gradual exposure

This makes Firebase A/B Testing ideal for high-frequency product iteration in 2026.

2. Push Notification Experiments

Push notifications remain one of the highest-impact engagement channels-and Firebase A/B Testing lets you optimize them with precision.

You can run experiments on:

  • Message copy and tone
  • Personalization logic and user attributes
  • Delivery timing and send windows
  • Frequency capping and suppression rules

Firebase measures real downstream impact, not just surface metrics, including:

  • Notification opens
  • In-app conversions
  • Revenue contribution
  • Retention and re-engagement impact

This ensures notification strategies are optimized for long-term value, not short-term clicks.

3. In-App Messaging Experiments

Firebase In-App Messaging enables experimentation across multiple formats, allowing teams to engage users inside the app experience itself.

Supported message types include:

  • Banners
  • Modals
  • Cards
  • Full-screen messages

Messages can be triggered contextually, such as:

  • After a specific user action
  • During onboarding
  • Before a churn-risk moment
  • At feature discovery points

This contextual delivery significantly improves relevance, engagement, and conversion rates.

4. Gradual Rollouts & Risk Control

One of the most powerful advantages of Firebase A/B Testing in 2026 is controlled experimentation and rollout.

Winning variants can be:

  • Rolled out to 100% of users instantly
  • Released gradually by random user percentiles
  • Limited to specific cohorts, regions, or app versions

This approach ensures:

  • App stability during changes
  • Minimal user disruption
  • Safe experimentation even on core features

It allows teams to scale improvements confidently and responsibly.

5. Advanced Metrics & Predictive Insights

Firebase A/B Testing goes beyond basic conversion tracking.

In 2026, teams can optimize experiments against:

  • User retention and engagement depth
  • Monetization and revenue per user
  • Predicted churn probability
  • Long-term lifetime value (LTV) using BigQuery models

By integrating Firebase with BigQuery, organizations gain:

  • Cohort-level experiment analysis
  • Long-term impact measurement
  • AI-assisted predictive insights

This turns experimentation into a strategic growth system, not just a testing tool.

Ways to Implement Firebase A/B Testing

Firebase offers multiple experimentation methods, allowing teams to choose the right approach based on use case and maturity.

1. Firebase Remote Config (Primary & Most Scalable Method)

Firebase Remote Config is the backbone of Firebase A/B Testing in 2026.

It allows teams to:

  • Change UI and business logic dynamically
  • Control feature availability using flags
  • Deliver experiment variants server-side

Why Remote Config Is Preferred in 2026

  • No app store approvals required
  • Minimal code involvement from developers
  • Faster experimentation and learning cycles
  • Supports complex audience targeting and conditions

This makes Remote Config the default choice for most Firebase A/B Testing use cases.

2. Push Notification A/B Testing

Firebase enables direct A/B testing of push notification strategies.

Teams can analyze how variations impact:

  • Session frequency
  • Conversion actions
  • Revenue events
  • Long-term user retention

This ensures notification experiments are tied to meaningful business outcomes, not vanity metrics.

3. Firebase In-App Messaging Experiments

Firebase In-App Messaging allows teams to test contextual messages that drive:

  • Feature adoption
  • In-app purchases
  • Subscription upgrades
  • Engagement recovery for dormant users

Because messages are triggered in-context, this method is particularly effective for behavior-based experimentation.


Step-by-Step: Setting Up Firebase Remote Config for A/B Testing (2026 Guide)

Firebase Remote Config is the foundation of Firebase A/B Testing. In 2026, it enables teams to experiment faster, reduce release risk, and optimize experiences-without app store updates.

Here’s a clean, production-ready setup process used by high-growth mobile apps.

Step 1: Add Firebase & Remote Config SDK

Before running Firebase A/B Testing, ensure:

  • Firebase is properly initialized in your Android or iOS app
  • The latest Firebase Remote Config SDK (2026 version) is installed

Remote Config integrates seamlessly with:

  • Firebase Analytics (GA4) for measurement
  • Firebase A/B Testing for experimentation
  • BigQuery for advanced analysis

This ensures experiments are accurately measured and statistically reliable.

Step 2: Initialize Remote Config

Create a singleton Remote Config instance in your app.

Key best practices in 2026:

  • Set a low minimum fetch interval (especially for staging or experiment-heavy environments)
  • Use environment-based intervals (shorter for QA, longer for production)

Why this matters:

  • Faster experiment refresh cycles
  • Near real-time learning
  • Reduced dependency on engineering releases

Remote Config acts as the control layer for all Firebase A/B Testing experiments.

Step 3: Define Default Parameter Values

Default values are critical for stability, safety, and consistency.

They ensure:

  • The app behaves correctly before remote values are fetched
  • Safe fallbacks during network or fetch failures
  • A consistent experience for first-time users

Defaults can be defined using:

  • XML resource files (recommended for structured configs)
  • Map objects (useful for dynamic or programmatic setups)

In 2026, defining defaults is considered a best practice for privacy-safe, resilient experimentation.

Step 4: Fetch and Activate Parameters

Use the fetchAndActivate() method to:

  • Fetch the latest Remote Config values from Firebase
  • Activate them immediately within the app

This enables:

  • Near real-time Firebase A/B Testing
  • Faster iteration without redeployments
  • Immediate rollback if an experiment underperforms

For most use cases, fetchAndActivate() is the recommended approach for seamless experimentation.

Configuring Firebase A/B Tests in the Firebase Console

Once Remote Config is live in your app, experiments are configured entirely from the Firebase Console then no additional code required.

1. Access Remote Config

Navigate to:
Firebase Console → Engage → Remote Config

This is the command center for:

  • Experiment parameters
  • Variants
  • Targeting rules
  • Rollouts

2. Define Parameter Keys

Parameter keys act as experiment levers inside your app.

Common examples:

  • cta_text
  • button_color
  • feature_enabled
  • paywall_variant

Each key represents a decision point that Firebase A/B Testing can optimize.

3. Assign Experiment Variants

For each parameter:

  • Define multiple variant values
  • Associate them with an A/B test

Firebase automatically:

  • Splits users across variants
  • Measures performance using Firebase Analytics
  • Applies statistical confidence evaluation

This removes guesswork and ensures data-driven decisions.

4. Apply Targeting Conditions (Optional but Powerful)

Firebase A/B Testing supports advanced targeting in 2026.

You can target experiments based on:

  • App version
  • OS type (Android / iOS)
  • Device language
  • Geography or region
  • Custom user properties
  • Random user percentiles

This allows:

  • Safe testing on limited cohorts
  • Region-specific experiments
  • Progressive exposure for high-risk changes

5. Publish Changes

Click “Publish changes” to make experiments live.

Once published:

  • Parameters are delivered instantly via Remote Config
  • No app update or app store approval is required
  • Experiments can be paused or rolled back anytime

This is what makes Firebase A/B Testing fast, flexible, and low-risk.


Advanced Experiment Configuration for Firebase A/B Testing (2026 Best Practices)

As Firebase A/B Testing matures in 2026, high-performing teams treat experimentation as a discipline, not a feature toggle. The difference between meaningful growth and misleading results lies in how experiments are designed, analyzed, and scaled.

Below are the best practices used by data-driven mobile teams.

1. Run One Primary Hypothesis per Experiment

Each Firebase A/B Testing experiment should validate one clear hypothesis.

Why this matters:

  • Isolates cause and effect
  • Improves statistical clarity
  • Enables confident decision-making

Avoid: bundling multiple major UI, pricing, or feature changes into a single experiment.
Best practice: test one variable that answers one business question.

2. Define Clear Success Metrics Before Launch

Every experiment must be tied to explicit success metrics-not vague goals.

Common Firebase A/B Testing metrics in 2026 include:

  • Revenue per user (RPU)
  • Retention rate (D1, D7, D30)
  • Feature adoption and usage depth
  • Funnel or conversion completion

This ensures experiments optimize for business impact, not surface-level engagement.

3. Avoid Experiment Overlap

Running multiple Firebase A/B Testing experiments on the same UI element or user flow can invalidate results.

Overlapping tests cause:

  • Confounded data
  • Attribution errors
  • False positives or negatives

Use experiment calendars and parameter ownership to maintain clean experiment boundaries.

4. Control Traffic Allocation Strategically

In 2026, best-in-class teams rarely launch experiments at 100% traffic.

Recommended approach:

  • Start with a small user percentile
  • Monitor stability and early signals
  • Gradually expand exposure

This minimizes risk while preserving statistical integrity.

Advanced Analysis & Decision-Making in Firebase A/B Testing

Running experiments is easy. Interpreting them correctly is where most teams fail.

1. Understand Statistical Confidence

Firebase A/B Testing automatically evaluates:

  • Probability to beat baseline
  • Confidence thresholds
  • Experiment validity

Key 2026 rule:
Never stop experiments prematurely-even if early results look promising.

Early stopping leads to:

  • False winners
  • Regression after rollout
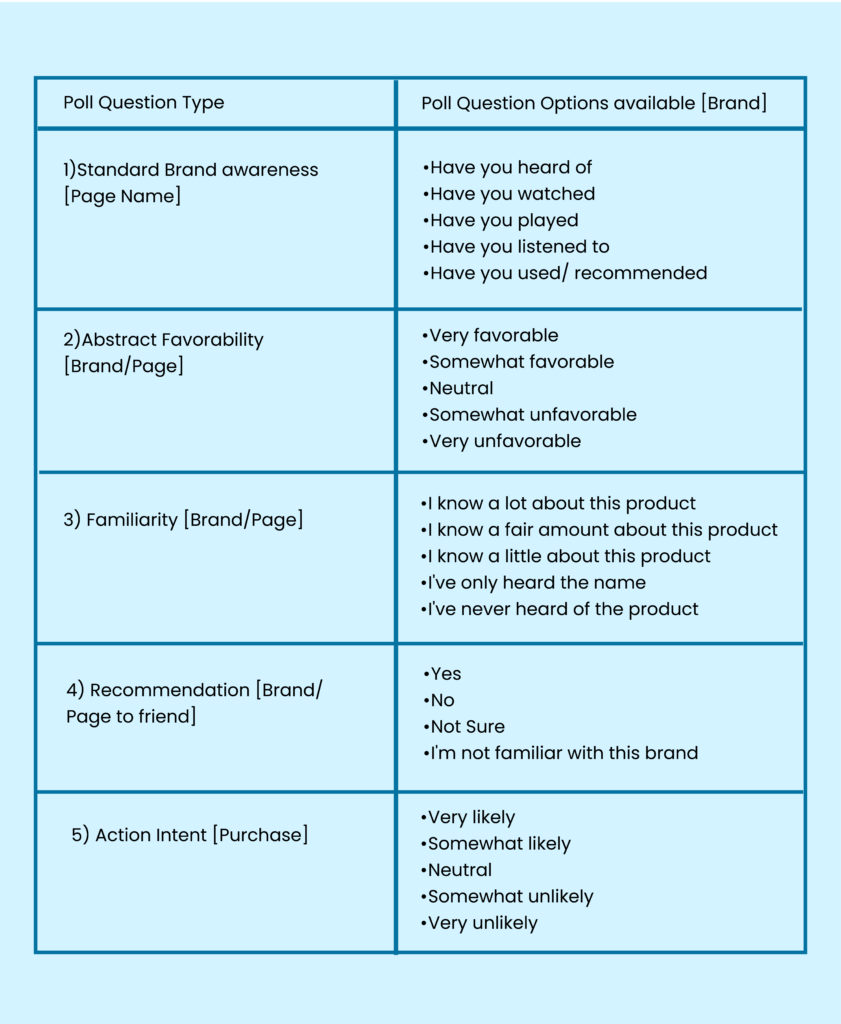
  • Misleading growth signals

Let experiments reach statistical maturity.

2. Use BigQuery for Deep Experiment Analysis

Export Firebase A/B Testing data to BigQuery to unlock advanced insights.

BigQuery enables teams to:

  • Analyze cohort-level experiment impact
  • Measure long-term retention and churn
  • Build predictive LTV models
  • Combine experiment data with CRM, revenue, or subscription data

This transforms Firebase A/B Testing from tactical testing into strategic growth intelligence.

3. Interpret Results Holistically

In Firebase A/B Testing, the highest conversion rate is not always the best outcome.

Always evaluate:

  • Long-term engagement trends
  • Revenue stability over time
  • Impact on user experience and trust

A short-term win that hurts retention or satisfaction is not a real win.

Scaling Firebase A/B Testing Across Teams

As experimentation scales, governance becomes essential.

1. Create a Central Experimentation Framework

Document a shared system covering:

  • Hypothesis templates
  • Metric definitions
  • Naming conventions for parameters and experiments

This ensures consistency, comparability, and organizational learning.

2. Reduce Developer Dependency

In 2026, product and growth teams should own Firebase A/B Testing execution.

Best model:

  • Product & growth teams manage experiments using Remote Config
  • Developers maintain guardrails, defaults, and performance safety

This balance enables speed without compromising app stability.

3. Build an Experiment Learning Repository

Track every experiment in a centralized knowledge base:

  • What worked
  • What failed
  • Why results happened

This prevents repeated mistakes and accelerates compound learning over time.

Common Firebase A/B Testing Mistakes to Avoid

Even experienced teams fall into these traps:

  • Ending experiments too early
  • Testing too many variables simultaneously
  • Optimizing for vanity metrics
  • Ignoring long-term user impact
  • Running experiments without a clear hypothesis

Avoiding these mistakes is often more impactful than running more experiments.

Final Thoughts: Firebase A/B Testing in 2026

In 2026, Firebase A/B Testing is no longer optional for mobile-first businesses.

When used correctly, it enables teams to:

  • Ship faster without increasing risk
  • Learn from real user behavior
  • Scale winning experiences confidently
  • Align product, marketing, and engineering teams

Firebase A/B Testing is not just a testing tool, it is a sustainable growth engine for modern mobile apps.

Features of Firebase Analytics: The Ultimate 2026 Guide

Features of Firebase Analytics The Ultimate 2026 Guide - Tatvic

TL;DR
In a mobile-first world defined by AI, privacy, and cross-platform experiences, understanding user behavior is no longer optional,  it’s strategic. Firebase Analytics has emerged as one of the most powerful analytics platforms for mobile and web apps, enabling data-driven growth, personalized engagement, and predictive insights.

In this definitive 2026 guide, we’ll explore all essential features of Firebase Analytics, why these capabilities matter today, and how modern teams leverage them to deliver higher retention, smarter acquisition, and sustainable growth.

What Is Firebase Analytics?

Firebase Analytics also known as Google Analytics for Firebase is a next-generation analytics platform designed to measure, analyze, and act on user behavior across mobile and web applications.

Unlike traditional analytics, Firebase Analytics is built on an event-based data model rather than pageviews or sessions. It integrates seamlessly with Firebase services and Google’s marketing ecosystem, making it ideal for app developers, product managers, data teams, and performance marketers.

➡️ Firebase Analytics is the analytics backbone for cross-platform user journeys, predictive insights and AI-driven decision intelligence.

Why Firebase Analytics Matters in 2026

Modern digital experiences are:

  • Multi-device
  • Real-time
  • Privacy-centric
  • Personalization-driven

This makes event-centric analytics critical for businesses that need:

✔ Accurate measurement of user behavior
✔ AI-powered prediction and automation
✔ Cross-platform attribution (web + app)
✔ Tight integration with marketing channels
✔ Scalable data export and big data analysis

Firebase Analytics meets all these requirements making it a must-have analytics stack component for apps and digital products in 2026.

Top Features of Firebase Analytics

Below are the core features that make Firebase Analytics a complete analytics solution along with examples and practical use cases.

1. Event-Based Tracking: Modern Data Starts Here

Firebase Analytics uses an event-first tracking model, meaning every meaningful interaction is captured as an event.

Examples of default events:

  • app_open
  • screen_view
  • first_open
  • user_engagement

Examples of custom events:

  • tutorial_complete
  • level_up
  • add_to_cart
  • premium_purchase

Why It Matters

  • Event tracking aligns with real user actions.
  • Enables deeper behavioral analysis.
  • Supports flexible funnel definitions and conversion measurement.

💡 Example: Track add_to_cart with parameters like product_id, price, and category - so you can analyze high-value product behavior.

2. Automatically Collected Events: Zero Coding Needed

Firebase Analytics captures key events automatically with no implementation required, including:

  • Session starts
  • First opens
  • App updates
  • Screen views
  • Engagement time

This gives you instant visibility into user trajectories from day one.

3. Custom Events: Tailor Analytics to Your Business

Beyond auto-tracked events, you can define your own events to measure anything that matters for your product strategy.

Popular custom events include:

  • In-app purchases
  • Subscription upgrades
  • Feature usage (e.g., selfie filter used)
  • Goal completions (e.g., checkout initiated)

Define custom parameters for deep filtering, segmentation, and actionable insights.

4. User Properties: Person-Level Context

User properties are attributes you assign to users to segment them meaningfully.

Examples:

  • location
  • subscription_plan
  • user_role
  • acquisition_channel

These reveal who your users are, not just what they do.

💡 Example: Segment users by user_role (free vs premium), then analyze retention differences.

5. Audiences: Dynamic User Segmentation

Audiences in Firebase are dynamic user groups built on events + properties.

You can segment users based on behavior, predicted actions, or engagement patterns.

Example Audiences:

  • Churn risk
  • High spenders
  • Frequent buyers
  • Inactive users

➡️ Firebase Audiences sync automatically with Google Ads, Firebase Cloud Messaging, and in-app campaigns - powering targeted activations.

6. Conversion Tracking: Measure What Matters

Firebase Analytics allows you to mark any event as a conversion, such as:

  • Subscription completed
  • Purchase confirmed
  • Level achieved
  • Registration finished

Conversions feed into ad platforms like:
✔ Google Ads
✔ Performance Max
✔ App Campaigns
✔ DV360

This enables measurable ROAS and full-funnel optimization.

7. Integrated Attribution & Campaign Measurement

Firebase Analytics natively integrates with major campaign sources:

  • Google Ads
  • AdMob
  • Social networks via UTM tagging
  • Third-party ad networks via campaign tracking

With event-level attribution, you get:

  • Install attribution
  • In-app activity attribution
  • Source/medium performance
  • Channel LTV measurement

This is invaluable in 2026, when multi-touch, cross-device attribution is necessary.

8. Firebase Predictions: AI-Powered Predictive Analytics

One of the most powerful features in 2026 is Firebase Predictions.

Powered by Google AI, Predictions uses historical data and machine learning to forecast user behavior, such as:

✨ Likelihood to churn
✨ Probability to make a purchase
✨ Predicted revenue buckets

With Predictions, you can:

  • Target at-risk users
  • Personalize renewals
  • Prevent churn before it happens

💡 Example: Create a segment of users predicted to churn in the next 7 days, then send them personalized offers via push.

9. BigQuery Integration: Raw Data + Unlimited Analysis

Firebase Analytics provides seamless export to BigQuery, opening up:

✔ Raw event-level data storage
✔ Advanced SQL analysis
✔ Machine learning with Dataflow and AI Platform
✔ Custom dashboards and BI visualization

This turns Firebase Analytics into a scalable data platform, not just a reporting tool.

🔥 Example Use Case:
Join Firebase event data with CRM or purchase history in BigQuery to compute true customer lifetime value (LTV).

10. Funnel & Path Analysis: Understand User Journeys

Firebase Analytics lets you build funnels based on:

  • Event sequences (e.g., sign-up → purchase)
  • Time windows
  • Audience segments

This helps you identify:

  • Drop-off points
  • Conversion bottlenecks
  • UX friction signals

📌 Example:
Measure how many users go from level_startlevel_complete in a gaming app.

11. Retention & Cohort Reports: View Long-Term Value

Firebase provides robust retention analysis, including:

  • Day 1, 7, 30 retention
  • Cohorts based on behavior, acquisition, or campaigns
  • Engagement comparison over time

This helps product teams understand long-term engagement rather than short-lived activity.

12. Monetization Reporting: Measure Revenue Health

For apps with monetization models, Firebase Analytics tracks:

  • In-app purchases
  • Subscription revenue
  • Ad revenue
  • ARPU (Average Revenue per User)
  • LTV (Lifetime Value)

📊 Pro tip: Combine monetization data with audience segments to target VIP users or improve pricing strategies.

13. DebugView: Validate Tracking in Real Time

Before publishing your analytics dashboards, use DebugView to ensure events are firing correctly.

Use cases:

  • Validate tracking during QA
  • Confirm new events in staging environments
  • Avoid implementation errors in production

14. Consent & Privacy-Aware Measurement

In 2026, privacy is non-negotiable.

Firebase Analytics supports:
✔ Consent mode
✔ IP anonymization
✔ Configurable retention policies
✔ Data deletion controls

This ensures compliance with global privacy regulations including GDPR, CCPA, and India’s DPDP.

Firebase Analytics vs Traditional Web Analytics

Feature

Firebase Analytics

Traditional Web Analytics

Data Model Event-centric Session/pageview based
Cross-Platform Native (App + Web) Mostly web
Predictive Insights ML-powered Limited
Real-Time Reporting Strong Moderate
Raw Export BigQuery Limited
Privacy Compliance Built-in Add-on dependent
Personalization Support Native Additional tools needed

➡️ Firebase Analytics was designed for modern digital experiences, not legacy websites.

Top Business Use Cases in 2026

Here’s how top teams use Firebase Analytics today:

1. Boosting In-App Conversions for Mobile Games

  • Use predictive churn segments to send re-engagement offers
  • Optimize user onboarding with funnel analytics
  • Measure LTV by campaign and device type

2. Personalization for Subscription Apps

  • Segment high-value users based on behavior
  • Send targeted push notifications
  • Personalize pricing or premium feature triggers

3. Retention-First E-Commerce Experiences

  • Identify users with high purchase intent
  • Target cart abandoners with customized promos
  • Boost repeat purchases with segmented campaigns

4. Cross-Device Journeys in Fintech and Retail Apps

  • Bridge web discovery with app activation data
  • Build holistic funnels across channels
  • Optimize acquisition spend using accurate attribution

Best Practices for Firebase Analytics in 2026

To extract maximum value:

1. Design a Meaningful Event Taxonomy

Align tracking with business KPIs from day one.

2. Use Predictive Segments Early

Early adoption of Predictions yields measurable uplift.

3. Integrate with Marketing Tools

Sync audiences with ads, messaging, and personalization layers.

4. Combine with BigQuery for Deep Analytics

Raw data powers advanced modeling and dashboards.

5. Monitor Consent & Governance Closely

Respect user privacy by design.

Common Mistakes to Avoid

  1. Tracking too many irrelevant events
  2. Ignoring user properties and personalization
  3. Treating analytics as reporting only
  4. Not using BigQuery for custom analysis
  5. Failing to validate events in DebugView

The Bottom Line

Firebase Analytics is no longer just a mobile analytics tool, it’s a data engine that powers product growth, user understanding, and strategic decision-making in 2026.

From predictive insights to real-time activation, it provides:

  • Deep behavioral understanding
  • Cross-platform measurement
  • Integrated campaign performance
  • Prediction-driven personalization
  • Scalable data export and analysis

In an age of data privacy, AI acceleration, and product-led growth, Firebase Analytics stands out as an indispensable analytics platform.

Marketing Analytics for D2C Startups: The Most Profitable Foundation for Sustainable Growth in 2026

Marketing Analytics for D2C Startups The Most Profitable Foundation for Sustainable Growth in 2026 - Tatvic

India’s digital commerce revolution is entering a new phase of rapid expansion. With online shopping becoming mainstream across urban, tier-2 and even rural markets, the Direct-to-Consumer (D2C) segment has emerged as one of the fastest-growing drivers of this transformation.

According to recent forecasts, India’s eCommerce market is projected to grow at approximately a 27% CAGR to reach nearly $163 billion by 2026, fueled by increasing internet penetration, smartphone adoption, and digital payments infrastructure.
~ India Brand Equity Foundation

Even more strikingly, the D2C eCommerce market in India is estimated at around $108.8 billion in 2026 and is forecast to nearly triple by 2030, growing at a robust CAGR of ~24-25%.
~ Mordor Intelligence

Yet, despite this scale and momentum, many D2C startups struggle to realize their full revenue potential-not for lack of traffic or ambition, but because their marketing analytics foundations are suboptimal.

To scale sustainably in 2026 and beyond, having the right marketing analytics strategy is no longer optional, it’s essential.

Why D2C Startups Need Marketing Analytics in 2026

Most D2C brands are launched as digital-first ventures with strong instincts for acquisition. They invest in paid media, influencer campaigns, social commerce, and brand storytelling. However, having data and analytics tools alone doesn’t guarantee growth how you interpret and act on the data does.

Here’s the disconnect many D2C startups face:

  • High acquisition spend but low profitability
  • Remarketing to broad audiences rather than high-intent segments
  • Limited understanding of customer lifetime value (LTV)
  • Product and UX decisions driven by assumptions, not signals
  • Funnel bottlenecks uncovered too late rather than proactively addressed

These issues highlight an important reality:

Marketing analytics is not just about reporting what happened, it’s about enabling decisions that drive business performance.

In this blog, we’ll explore how D2C brands can build analytics foundations that improve marketing efficiency, conversion rates, retention, and long-term scale.

Understanding the Role of Marketing Analytics

What Is Marketing Analytics?

In 2026, marketing analytics for D2C startups means:

Using structured, data-driven insights to optimize customer acquisition, conversion, retention, and lifetime value across digital channels and touchpoints.

It goes beyond simple dashboards and spreadsheets. At its core, it answers:

  • Who are your most valuable customers?
  • Where do they come from?
  • How do they behave across the funnel?
  • What actions maximize revenue with the least cost?
  • Which experiences hurt or help conversions?

In short, marketing analytics turns raw data into actionable business intelligence.

The Business Value of Marketing Analytics for D2C Startups

Marketing analytics directly influences 2 critical D2C growth outcomes:

1. Optimize Marketing Spend

The days of “spray and pray” growth are over. Digital channels have become more competitive and expensive, making it imperative to spend smarter. Analytics helps brands:

  • Evaluate audience profitability rather than vanity metrics
  • Shift budget to high-intent segments
  • Forecast growth based on leading indicators
  • Improve Return on Ad Spend (ROAS) without proportionally increasing budgets

In 2026, marketers demand not just which channel works, but which audience works best, under what context, and at what cost.

2. Increase Conversion Rates Across the Funnel

Driving traffic without converting it efficiently is expensive.

Marketing analytics enables brands to:

  • Identify where users drop off
  • Understand why drop-offs occur
  • Prioritize interventions that move metrics reliably
  • Increase funnel efficiency without increasing acquisition spend

This is where analytics becomes a conversion engine rather than just a reporting tool.

Mapping Analytics to the AIDAR Funnel

Growth for a D2C startup isn’t linear, it’s cyclical and multi-dimensional.

The AIDAR model-Attention → Interest → Desire → Action → Retention-offers a structured view of the customer journey.

Here’s How Analytics Plays Into Each Phase:

Stage

Analytics Role

Attention Identify scalable, high-quality audiences
Interest Measure engagement signals and intent
Desire Track product interaction and intent signals
Action Diagnose conversion bottlenecks and UX friction
Retention Forecast LTV, churn risks, and repeat purchase behavior

Analytics isn’t just measurement, it’s strategic context that aligns efforts with business priorities.

Building a Marketing Analytics Foundation in 2026

Reaching digital maturity is a strategic journey. A strong marketing analytics foundation has three core pillars:

1. Clean, Unified Data Architecture

Without trustworthy data, insights will always be shaky.

Key components include:

  • GA4 (or equivalent) event-based tracking to measure meaningful behavior
  • Unified tracking for web + app experiences
  • Server-side or hybrid measurement for accuracy
  • Robust consent and privacy compliance infrastructure

This clean foundation ensures that all subsequent analytics-segmentation, attribution, funnel analysis-are reliable.

2. Relevant Audience Segmentation

A common mistake is treating all traffic as equal.

Analytics frameworks help brands identify segments that matter, such as:

  • Users who added products to cart but didn’t checkout
  • Visitors who bounced from product pages
  • High-engagement users with repeat sessions
  • High-LTV cohorts based on past purchase behavior

These segments can then be:

  • Activated in paid channels
  • Used to enhance personalization
  • Applied for automated remarketing

This moves analytics from reporting to activation where insights drive tactical action.

3. Actionable Insights Over Dashboards

Analytics tools can produce beautiful dashboards full of metrics-but if they don’t point to decisions, they add noise.

Actionable analytics should:

  • Highlight what changed
  • Explain why it matters
  • Recommend what action to take

For example:

“Cart abandonment increased by 15% this week due to checkout friction on mobile devices.”

This insight is actionable. It tells the D2C team where to focus optimizations.

From Audience Segments to Growth Activation

Once meaningful segments are defined, D2C brands should use these data segments to:

  • Export audiences to paid media platforms like Google Ads, DV360, Meta
  • Trigger remarketing campaigns tailored to behavior
  • Personalize messaging based on intent signals
  • Create lookalike audiences for discovery campaigns

For example:

  • Cart abandoners receive a compelling offer
  • Users who browsed high-margin products are targeted with educational messaging
  • High-LTV customers get loyalty perks to retain them longer

This is how marketing analytics becomes a growth activation platform, not a reporting function.

Turning Analytics into UX & CRO Improvements

Conversion Rate Optimization (CRO) is not guesswork it’s data-driven experimentation.

Analytics plays a critical role in diagnosing:

  • UX friction points
  • Funnel leaks
  • Pain points in checkout flows
  • Drop-off patterns on key product pages

By combining analytics data with user research and UX heuristics, D2C brands can implement high-impact tests that boost conversions with statistical confidence.

Retention & LTV: The Real Growth Multiplier

Acquisition gets users to the store. Retention keeps them coming back.

Analytics plays a central role in forecasting Lifetime Value (LTV) and retention patterns by:

  • Tracking purchase frequency
  • Identifying churn cues
  • Modeling repeat purchase probabilities
  • Segmenting customers by predicted future value

Once brands understand which customers are likely to return and which are at risk of churn they can tailor:

  • Personalized loyalty incentives
  • Retargeting audiences
  • Win-back campaigns
  • Product subscription models

This is where marketing analytics evolves into a predictive engine that powers sustainable growth.

Common Marketing Analytics Mistakes D2C Startups Should Avoid

Even advanced teams sometimes fall prey to:

1. Treating Analytics as Reporting Only

If analytics aren’t tied to decisions, they become passive rather than strategic.

2. Measuring Everything But Acting on Nothing

More metrics don’t equal better outcomes. Focus on signal over noise.

3. Ignoring LTV and Cohort Analysis

CAC alone doesn’t tell the whole story-LTV contextualizes profitability.

4. Siloed CRO and Analytics

If CRO operates independently of analytics, opportunities for optimization are missed.

In 2026, clarity beats complexity. Analytics should reduce uncertainty, not add confusion.

How to Choose the Right Analytics Partner as a D2C Startup

When D2C brands outgrow DIY analytics, a strong partner can accelerate maturity.

Look for partners who:

✔ Back analytics with real business outcomes
✔ Tie analytics to CRO and UX improvements
✔ Understand eCommerce measurement fundamentals
✔ Focus on activation, not just dashboards
✔ Bring cross-industry experience

This partnership should build capability within your team not replace it.

The Bottom Line: Analytics Is Strategic, Not Tactical

In 2026, marketing analytics is no longer a luxury.

It has become the strategic foundation that fuels:

  • Lower customer acquisition costs
  • Higher conversion rates
  • Predictable LTV and retention
  • Smarter budget allocation
  • Sustainable, scalable growth

Without a strong analytics foundation, D2C brands risk stagnation-even in a fast-growing market.

By building a structured, actionable analytics practice, startups can ensure their growth is not just fast-efficient, resilient, and long-lasting.

Ready to Build a Future-Ready Marketing Analytics Foundation?

If your D2C brand has traffic but is struggling to convert insights into profit your analytics foundation might be the missing piece.

It’s time to shift from vanity reporting to strategic decision intelligence.

Build marketing analytics frameworks that drive:
✔ Sustainable growth
✔ Efficient spends
✔ Data-informed decisions
✔ Higher conversion and retention

Let’s get it right for 2026 and beyond.

6 Laws to Master Your Dashboard Creation Skills in 2026

6 Laws to Master Your Dashboard Creation Skills in 2026 - Tatvic


In 2026, data is no longer scarce. Attention, clarity, and trust are.

Almost every organization today has access to dashboards built on GA4, BigQuery, Looker, Power BI, Tableau, or custom BI stacks. Yet, despite having “accurate data,” most dashboards still fail at the one thing they are meant to do:

Help humans make better decisions, faster.

  • Executives don’t want more charts.
  • Marketing leaders don’t want more filters.
  • Product teams don’t want more tables.

They want clarity at a glance.

This is where dashboard design stops being a technical exercise and becomes a cognitive and behavioral discipline.

In this guide, we break down the 6 timeless design laws rooted in human psychology and UX science that will help you create dashboards that are not just visually appealing, but usable, trusted, and action-driven.

TL;DR:

Mastering dashboard creation in 2026 is less about visual flair and more about designing for human behavior. Effective dashboards follow six proven design laws-Fitts’s Law (make key KPIs easy to find and interact with), Jakob’s Law (use familiar layouts users already understand), the Law of Prägnanz (simplify visuals to reduce cognitive load), Gestalt Laws (group related metrics to reveal patterns instantly), Miller’s Law (limit information per view to avoid overload), and Hick’s Law (reduce choices to speed up decision-making). When applied together, these principles transform dashboards from data-heavy screens into intuitive decision-making tools that drive clarity, adoption, and real business impact.

What Is a Dashboard? (And What It Is Not)

A dashboard is an interactive, decision-oriented interface that surfaces the most critical business signals at a glance, helping stakeholders understand performance, detect anomalies, and take action-fast.

In 2026, dashboards are no longer passive reporting layers. They are active decision environments, designed to answer one core question:

“What should I do next?”

A well-designed dashboard reduces cognitive load, accelerates insight, and aligns teams around the same version of truth without requiring deep data expertise.

What is a Dashboard

What a Dashboard Is?

A modern dashboard is:

-> A Decision-Support System

Dashboards exist to enable decisions, not just display data. Every metric, chart, and visual hierarchy should directly support an action, choice, or strategic direction.

-> A Curated Summary of What Matters Most

Dashboards prioritize signal over noise. They focus only on the metrics that materially impact outcomes-revenue, growth, efficiency, risk, or customer experience.

-> A Starting Point for Investigation

A dashboard is not the final destination. It is the first lens that highlights where deeper analysis is required-guiding users toward root-cause exploration, not replacing it.

What a Dashboard Is Not?

Despite how they’re often used, dashboards are not:

-> A Data Warehouse

Dashboards should never attempt to store or expose raw, unfiltered datasets. That’s the job of data warehouses, lakes, or analytics backends.

-> A Spreadsheet Replacement

Dashboards are not meant for row-by-row inspection or manual manipulation. They are designed for pattern recognition, comparison, and trend analysis.

-> A Dumping Ground for Every Available Metric

More metrics ≠ more insight. Overloaded dashboards dilute attention, increase misinterpretation, and slow decision-making.

The Reality of Dashboards in 2026

In 2026, dashboards sit at the intersection of four critical forces:

1. Business Strategy

Dashboards increasingly reflect OKRs, North Star metrics, and board-level KPIs, not just operational numbers.

2. Human Attention

With shrinking attention spans and decision fatigue, dashboards must respect how humans scan, prioritize, and process information.

3. Data Engineering

Modern dashboards pull from dozens of sources-web analytics, apps, CRM, ad platforms, CDPs, experimentation tools, and AI models-requiring strong data foundations.

4. UX & Cognitive Psychology

Design choices now directly influence interpretation, bias, trust, and action. Poor design doesn’t just confuse-it misleads.

This convergence makes dashboard design a strategic discipline, not a visual afterthought.

Why Dashboard Design Laws Matter More Than Ever in 2026

Modern dashboards face challenges that didn’t exist even a few years ago:

  • Explosion of data sources across marketing, product, sales, and customer platforms

  • AI-generated insights that still require human judgment and context

  • Senior stakeholders with limited time, scanning dashboards in seconds-not minutes

  • Remote-first decision-making, where dashboards often replace meetings, presentations, and status calls

As a result, dashboards today carry more responsibility than ever before.

Without strong design principles, dashboards quickly become:

  • Overwhelming

  • Misleading

  • Distrusted

  • Completely ignored

And a dashboard that is ignored is worse than no dashboard at all.

The Need for Dashboard Design Laws

Effective dashboards are not designed for data engineers, analysts, or tools.

They are designed for how humans actually see, think, and decide.

That’s why modern dashboarding requires clear design laws-principles rooted in:

  • Cognitive load theory

  • Visual perception

  • Behavioral decision science

  • Real-world business usage

The following six dashboard design laws are built for 2026 realities: AI-assisted analytics, executive consumption, and outcome-driven decision-making.

They don’t just make dashboards look better. They make dashboards work.

The 6 Laws of Effective Dashboard Design (2026 Edition)

Modern dashboards fail not because of data quality but because they ignore how humans think, see, and decide.

The most effective dashboards in 2026 are not built around tools, charts, or data schemas, they are built around cognitive psychology, UX research, and behavioral science.

These six dashboard design laws are tool-agnostic and apply equally to:

  • GA4 dashboards
  • Executive scorecards
  • CRO & experimentation dashboards
  • Product & growth analytics views
  • AI-assisted decision dashboards

They are timeless in principle but more critical than ever in a world of AI insights, remote decision-making, and shrinking executive attention spans.

Law #1: Fitts’s Law: Make Key Insights Impossible to Miss

“The time to acquire a target is a function of the distance to and size of the target”

What This Means for Dashboards

The closer and larger an element is, the faster users can notice and interact with it.

In dashboards, this translates to one non-negotiable rule:

Your most important KPIs should require zero effort to find.

If stakeholders have to search for answers, the dashboard has already failed.

Fitts-law-dashboard

Dashboard Best Practices in 2026

Design your dashboard so that primary KPIs are:

Placed strategically

  • At the top of the dashboard
  • In the natural visual entry point (top-left or visual center)

Designed for instant recognition

  • Large enough to dominate visual hierarchy
  • Clearly labeled (no abbreviations or internal jargon)
  • Interpretable without tooltips or explanations

Aligned with human scanning behavior

  • Optimized for F-pattern and Z-pattern reading
  • Left-to-right, top-to-bottom logic

Common Mistake to Avoid

Burying business-critical metrics:

  • Below filters
  • Inside tables
  • After secondary charts

If a CEO has to scroll, filter, or hover just to understand performance, the dashboard is not executive-ready.

Law #2: Jakob’s Law: Don’t Make Users Learn Your Dashboard

“Users spend their time on other interfaces. This means that users prefer your interface to work the same way as all other interfaces they already know”

What This Means for Dashboards

Users bring mental models from:

  • Other BI tools
  • Spreadsheets
  • Past dashboards
  • Familiar SaaS products

While innovation is tempting, familiarity builds trust.

Dashboards should feel instantly usable even to first-time viewers.

Best Practices for Familiarity

Use conventional visualization patterns

  • Line charts → trends over time
  • Bar charts → comparisons
  • Tables → detailed breakdowns

Standardize interaction patterns

  • Filters in predictable locations
  • Consistent date selectors
  • Reusable layouts across dashboards

Maintain universal color semantics

  • Green = positive
  • Red = negative
  • Yellow = caution

Why This Matters in 2026

When users don’t have to learn the interface, they can focus on:

  • Understanding insights
  • Asking better questions
  • Making faster decisions

A dashboard that feels “obvious” is a dashboard that gets used.

Law #3: Law of Prägnanz: Simplicity Wins Every Time

“People will perceive and interpret ambiguous or complex images as the simplest form possible, because it is the interpretation that requires the least cognitive effort of us”

What This Means for Dashboards

No matter how complex your data is, users will mentally simplify it.

Your role is not to fight simplification but to control it intentionally.

Pregananz-law

Best Practices for Cognitive Clarity

Remove visual noise

  • Excess colors
  • Decorative elements
  • Heavy gridlines
  • Redundant labels

Strengthen meaning

  • Clear, action-oriented chart titles
  • Annotations explaining spikes or drops
  • Consistent scales and formats

Design for instant comprehension

  • One idea per chart
  • One message per visual

Core Insight

If a chart needs a paragraph to explain it, it doesn’t belong on a dashboard.

Dashboards should explain themselves in under 5 seconds.

Law #4: Gestalt Laws of Grouping: Control How Data Is Interpreted

“Humans naturally perceive objects as organised patterns and objects”

The 4 Most Important Gestalt Principles for Dashboards

1. Proximity
Elements placed close together are perceived as related.

2. Similarity
Items with similar colors, shapes, or sizes are grouped mentally.

3. Common Region
Items inside the same visual container feel connected.

4. Focal Point
Visual emphasis directs attention to what matters most.

Gestalt-law

How to Apply This in Dashboards

  • Group related metrics (e.g., traffic + engagement)
  • Clearly separate unrelated sections
  • Use spacing intentionally-not randomly
  • Create visual “zones” for different business questions

Result

  • Faster comprehension
  • Lower misinterpretation risk
  • Stronger narrative flow
  • Better decision confidence

Great dashboards don’t just show data, they tell structured stories.

Law #5: Miller’s Law: Respect Human Memory Limits

The average person can only keep 7 (plus or minus 2) items in their working memory”

What This Means for Dashboards

Trying to show everything on one screen doesn’t increase clarity, it destroys it.

Best Practices for Information Density

Design each dashboard view around:

  • One core question
  • One primary audience

Break complexity into:

  • Tabs
  • Pages
  • Thematic sections (Acquisition, Engagement, Revenue, Retention)

Millers-Law

A Common Myth to Ignore

“Users don’t like scrolling.”

Reality:
Users dislike confusion, not scrolling. They will happily scroll through a well-structured narrative.

Law #6: Hick’s Law: Fewer Choices, Faster Decisions

“The time it takes to make a decision increases with the number and complexity of choices”

What This Means for Dashboards

  • More metrics slow decisions.
  • More filters create hesitation.
  • More options increase ambiguity.

Dashboards should guide conclusions, not overwhelm users.

Hicks-law

Best Practices for Decision Velocity

Prioritize answering:

  1. What changed?
  2. Why does it matter?
  3. What action is required?

Use progressive disclosure:

  • High-level summary first
  • Drill-downs only when necessary

Be ruthless about removing:

  • Vanity metrics
  • “Nice-to-have” charts
  • Metrics without a decision attached

The Core Principle

A great dashboard doesn’t answer every possible question.

It answers the right question-quickly, clearly, and confidently.

Common Dashboard Mistakes to Avoid in 2026

Even highly data-mature organizations still get dashboards wrong.

Not because their data is inaccurate-but because their dashboards are designed as reports, not decision tools.

As dashboards replace meetings, presentations, and manual reviews, design mistakes now have a direct impact on speed, confidence, and quality of decisions.

Here are the most common dashboard mistakes organizations continue to make in 2026 and why they silently kill adoption:

1. Treating Dashboards Like Static Reports

Many dashboards are still designed as:

  • Monthly PDFs in disguise
  • Screenshots of spreadsheets
  • One-way reporting surfaces
Why This Fails

Dashboards are meant to support ongoing decision-making, not retrospective reporting.

Static layouts:

  • Hide trends
  • Delay action
  • Encourage passive consumption
What to Do Instead

Design dashboards as living decision systems:

  • Emphasize trends over point-in-time numbers
  • Highlight changes, deltas, and anomalies
  • Design for weekly or daily use-not monthly reviews

2. Designing for Analysts Instead of Decision-Makers

A subtle but costly mistake.

Many dashboards are optimized for:

  • Analysts who built the data
  • Power users who know every metric
  • Internal teams who already understand context
Why This Fails

Executives and business leaders:

  • Scan, not analyze
  • Decide in seconds, not minutes
  • Need conclusions-not raw data
What to Do Instead

Design for the least technical but most influential user:

  • Use plain language
  • Avoid internal acronyms
  • Prioritize interpretation over precision

A dashboard that only analysts understand is not a business dashboard.

3. Overusing Filters and Interactivity

Interactivity is powerful but dangerous when overused.

Common symptoms:

  • Too many dropdowns
  • Nested filters
  • Mandatory filtering before insights appear
Why This Fails

Every filter is a decision tax.

More choices:

  • Slow users down
  • Increase cognitive load
  • Create analysis paralysis
What to Do Instead

Use opinionated defaults:

  • Pre-filtered views for key audiences
  • One clear “source of truth” view
  • Progressive disclosure for advanced users

The best dashboards answer key questions before users touch a filter.

4. Measuring Everything Instead of What Matters

Modern data stacks make it easy to track hundreds of metrics.

That doesn’t mean you should show them.

Why This Fails

More metrics:

  • Dilute attention
  • Reduce clarity
  • Increase misinterpretation

Stakeholders walk away knowing more numbers but less meaning.

What to Do Instead

Every metric should answer one question:

“What decision does this metric support?”

If a metric doesn’t influence action, it doesn’t belong on the dashboard.

5. Optimizing for Data Completeness Instead of Clarity

Many teams aim for dashboards that are:

  • Technically exhaustive
  • Perfectly reconciled
  • Universally correct
Why This Fails

Decision-makers value clarity over completeness.

A slightly incomplete but clear dashboard:

  • Drives action
  • Builds trust
  • Gets used

A perfectly complete but confusing dashboard:

  • Gets ignored
What to Do Instead

Design for directional truth:

  • Clear trends
  • Clear signals
  • Clear next steps

Dashboards exist to reduce uncertainty not eliminate it.

The Real Reason Dashboards Fail

Dashboards don’t fail because data is wrong.

They fail because design ignores human behavior.

When dashboards fight attention, memory, and decision psychology, no amount of data accuracy can save them.

Applying the 6 Laws Across Real-World Dashboards

The six dashboard design laws become truly powerful when applied to specific business contexts.

Here’s how they translate across common dashboard types in 2026.

1. Executive Dashboards

Executive dashboards are decision accelerators, not monitoring tools.

Design Principles
  • Focus on outcomes, not activities
  • Limit KPIs to strategic goals
  • Highlight exceptions, risks, and anomalies
What Great Executive Dashboards Do
  • Show what’s off-track instantly
  • Reduce meeting dependency
  • Align leadership on one version of truth

If everything looks “fine,” the dashboard isn’t doing its job.

2. Marketing & Growth Dashboards

Marketing dashboards must connect effort to business impact.

Design Principles
  • Tie metrics directly to revenue, pipeline, or retention
  • Show trends and momentum, not isolated numbers
  • Separate performance views from diagnostic views
Why This Matters

Growth teams move fast.

Dashboards should help answer:

  • What’s scaling?
  • What’s declining?
  • Where should we double down-or pull back?

3. Product & CRO Dashboards

Product and CRO dashboards exist to validate hypotheses quickly.

Design Principles
  • Group metrics by user journey stage
  • Prioritize behavioral signals over vanity metrics
  • Enable rapid comparison across variants or cohorts
What High-Performing Teams Do
  • Use dashboards to kill weak ideas fast
  • Focus on leading indicators
  • Design for learning-not reporting

Tools Don’t Fix Bad Design, Good Design Scales with Tool.

What Great Dashboards Actually Require

Regardless of the tool, great dashboards depend on:

  • Clean, well-structured event and business data
  • Clearly defined business questions
  • Strong design principles grounded in psychology
  • Editorial judgment over blind automation

AI can surface insights. Automation can speed up reporting.  But only humans can design clarity.

Conclusion: Great Dashboards Create Better Decisions

Dashboards are not about charts or visuals.

They are about:

  • Trust
  • Focus
  • Confidence
  • Action

By applying the six laws of effective dashboard design:

  • Fitts’s Law
  • Jakob’s Law
  • Law of Prägnanz
  • Gestalt Grouping
  • Miller’s Law
  • Hick’s Law

You move closer to building dashboards that:

  • Get used consistently
  • Get trusted instinctively
  • Actually influence decisions

In 2026, the best dashboards are not the most detailed ones. They are the ones that respect how humans think.


Meta Brand Lift Study (Meta BLS) in 2026: The Smart Way to Measure & Maximize Brand Awareness

Meta Brand Lift Study (Meta BLS) - Tatvic

Do you really think Meta Brand Lift Study (Meta BLS) in really significant in 2026??

In today’s increasingly competitive digital landscape, branding has become a non-negotiable pillar of marketing strategy. For companies aiming to secure a prominent spot at the top of the marketing funnel (TOFU), brand awareness is more critical than ever. A strong brand presence not only drives long-term customer loyalty but also significantly influences early-stage consideration. However, a major concern still persists: how do you quantify the real impact of branding campaigns?

Despite high impression volumes, many advertisers hesitate to allocate large budgets to brand awareness or traffic-driven campaigns. The core issue? These campaigns often lack clear, measurable outcomes. Unlike conversion-focused campaigns that deliver hard metrics like revenue, leads, and Return on Ad Spend (ROAS), branding efforts are often judged based on ambiguous engagement signals leaving marketers without concrete evidence of success.

This measurement gap has prompted Meta (formerly Facebook) to innovate in this space. Enter the Meta Brand Lift Study (Meta BLS): a powerful research tool designed to help advertisers accurately gauge the effectiveness of their awareness-driven campaigns. Available under Meta’s “Experiments” feature in Ads Manager, the brand lift study enables businesses to assess the incremental impact of their ad campaigns on key metrics such as brand awareness, ad recall, favorability, consideration, and purchase intent.

TL:DR

In 2026, Meta Brand Lift Study (BLS) remains a highly relevant and strategic tool for advertisers looking to measure the real impact of brand campaigns in a privacy-first, cookie-less ecosystem. By using test-and-control experiments, Meta BLS helps brands move beyond vanity metrics and quantify incremental lift across key upper-funnel KPIs such as awareness, ad recall, consideration, and purchase intent. It enables marketers to validate brand investments with data, optimize creative and messaging, and confidently justify TOFU budgets making it an essential measurement framework for modern brand-led growth.

What makes the Meta Brand Lift test especially valuable in 2026 is its alignment with performance marketing expectations. It offers advertisers a way to blend the science of data-driven marketing with the art of brand storytelling, delivering actionable insights into how campaigns are shaping consumer perception - not just behavior.

As marketers and decision-makers look for more intelligent, ROI-backed strategies in 2026, the brand lift study by Meta stands out as an essential tool. Whether you’re launching a new product, strengthening brand equity, or optimizing top-of-funnel activities, understanding how audiences perceive your brand can help you fine-tune messaging, creative, and targeting for better long-term outcomes.

In this guide, we’ll dive deeper into how the Meta Brand Lift Study works, eligibility requirements, poll design best practices, and how you can interpret the results to supercharge your brand marketing efforts.

Brand Lift Survey Process in FB Ads Manager

What is Meta Brand Lift Study (Meta BLS) in 2026?

The Facebook Brand Lift Study, now widely recognized as the Meta Brand Lift Study (Meta BLS), is a robust experimental measurement solution that allows advertisers to precisely evaluate the incremental impact of their brand campaigns across the Meta ecosystem including Facebook, Instagram, and Audience Network.

By leveraging randomized control trials (RCTs), the Meta brand lift study isolates campaign performance from external factors, giving marketers a clear, data-driven view of brand perception shifts caused directly by their ads.

In 2026, Meta BLS plays a pivotal role in upper-funnel measurement, helping brands quantify lift in awareness, ad recall, favorability, consideration and even purchase intent, insights that are critical in today’s privacy-first, cookie-less digital landscape.

Whether you’re running a single campaign or a multi-channel branding initiative, the brand lift study offers actionable intelligence to guide creative, budget, and audience strategy.

In 2026, the Meta BLS has evolved to help brands go beyond vanity metrics like impressions or reach. Instead, it focuses on brand-specific KPIs such as:

  • Brand Awareness
  • Ad Recall (Video Recall)
  • Brand Favorability
  • Consideration
  • Purchase Intent

These insights are gathered using poll-based experiments that compare a test group (people who saw your ad) with a control group (people who didn’t). By analyzing the responses to targeted survey questions, marketers can determine the incremental lift in perception caused directly by their advertising efforts.

How the Meta Brand Lift Study Conducted?

The brand lift study can be conducted using either:

  • A single campaign, or
  • Multiple campaigns running under the same ad account

However, to ensure the reliability and consistency of results, it’s essential that all selected campaigns:

  • Share a consistent creative theme,
  • Deliver uniform messaging, and
  • Target a similar audience segment

This consistency ensures that participants aren’t confused by varied visuals or messages, something that could bias results and reduce the accuracy of your brand lift measurement.

Once your campaigns go live, Meta automatically divides the audience into test and control groups using randomized control trial (RCT) methodology. While the test group sees your ads, the control group does not. Meta then delivers in-feed surveys to both groups with custom questions aligned to your brand objectives such as brand awareness, ad recall or purchase intent.

In 2026, Meta BLS uses advanced AI-driven audience segmentation and dynamic sampling to optimize poll delivery, ensuring better response quality and faster turnaround on lift metrics across diverse verticals and regions.

Why Meta Brand Lift Studies (Meta BLS) Matters in 2026

With the decline of third-party cookies and growing emphasis on privacy-first advertising, marketers now face greater pressure to quantify success in brand building without relying solely on tracking-based performance metrics.

This is where Meta BLS delivers immense value:

  • It helps marketers scientifically validate the effectiveness of brand awareness efforts.
  • It enables data-backed storytelling to internal stakeholders.
  • It uncovers which creative elements are resonating most with your audience.
  • It guides future campaign optimizations for stronger upper-funnel performance.

In an era where consumer trust and emotional connection play a critical role in conversion, measuring brand lift is not just a nice-to-have, it’s a strategic imperative.

Can Brand Lift Studies Be Conducted in India in 2026?

Yes, Brand Lift Studies-now known as Meta Brand Lift Studies (Meta BLS) can effectively be conducted in India, provided that specific eligibility criteria are met. Meta has outlined minimum budget thresholds per country, including India, to ensure the studies yield statistically significant and actionable results.

These benchmarks are based on Meta’s internal algorithms and data analysis, which determine the minimum number of impressions and survey responses needed to measure lift with confidence.

For campaigns running in India, the updated requirements in 2026 are as follows:

  • Minimum Budget: USD 15,000 (or its equivalent in INR)
  • Primary Language for Polls: English (EN_US)
  • Target Audience Age: 18 years and above

Advertisers in India must meet or exceed this budget threshold per brand lift test to activate the feature within Meta’s Experiments or Test & Learn framework. If the budget criteria aren’t met, Meta disables the option to launch a brand lift study for that campaign.

This budget ensures the sample size is large enough for Meta’s platform to deliver meaningful insights-whether you’re measuring brand awareness, ad recall, favorability, or purchase intent.

Pro Tip: If you’re running a multi-region campaign with India included, each region’s respective budget must independently meet Meta’s minimums to allow proper audience segmentation and response analysis.

Conducting a Meta brand lift study in India is an excellent way for brands to understand how their messaging resonates with Indian consumers-especially in a complex and mobile-first market where traditional brand tracking often falls short.

How the Meta Brand Lift Study (Meta BLS) Works in 2026

The Meta Brand Lift Study (formerly Facebook Brand Lift Study) is a scientifically backed methodology designed to isolate and measure the true incremental impact of brand campaigns across Meta platforms including Facebook, Instagram, and the Audience Network.

Here’s the Step-by-Step Process How Meta Brand Lift Study (Meta BLS) Works

Step 1: Audience Segmentation (Control vs. Test Group)

The first step in a Meta brand lift study is the randomized division of your selected audience into two statistically equivalent groups:

  • Test Group: This group is exposed to your advertising campaign.
  • Control Group: This group does not see your ads, but is otherwise similar in demographics and behavior.

This setup ensures that any difference in brand perception between the two groups can be directly attributed to your ad campaign-not external variables. Meta’s advanced algorithm handles this segmentation automatically, preserving experimental integrity.

Step 2: Survey Deployment

Once the campaign is live, Meta begins delivering in-feed poll questions to both groups.

These are typically one-question surveys tailored to the advertiser’s brand objectives, such as:

  • “Do you recall seeing an ad for [Brand] recently?”
  • “How likely are you to consider [Product] for your next purchase?”

Each question comes with multiple-choice responses, and users’ answers help Meta calculate key brand metrics like ad recall, brand awareness, favorability, consideration, and purchase intent.

Note: To ensure data accuracy, the study must run for a minimum of 14 days.

Step 3: Measuring Incremental Lift

Throughout the campaign, Meta records all survey responses and tracks user behavior. Unlike simple A/B testing, Meta BLS employs a randomized control trial (RCT) framework to assess the incremental lift i.e., how much more likely someone is to remember or favor your brand because of seeing the ad.

This is key to understanding true advertising impact and filtering out any noise from other marketing channels or organic brand activity.

Step 4: Insights & Reporting

At the end of the campaign duration, Meta delivers a comprehensive report comparing the responses and behaviors of the test and control groups.

This includes:

  • Percentage point lift in brand awareness or ad recall
  • Statistical significance of the results
  • Actionable insights on what’s working and what needs improvement

This final step allows advertisers to determine the effectiveness of their brand messaging and optimize future campaigns accordingly.

In 2026, the Meta brand lift study remains one of the most reliable tools for advertisers to quantify the real-world impact of brand campaigns in a privacy-safe, scientifically valid way.

What Type of Questions Should Be Chosen for the Meta Brand Lift Study (Meta BLS) in 2026?

When setting up a Meta Brand Lift Study (Meta BLS) in 2026, choosing the right set of questions is critical to accurately measure the true impact of your brand campaign. These questions help advertisers determine how their target audience perceives and remembers their brand, messaging, and offerings across Meta platforms like Facebook, Instagram, and Audience Network.

Example of Brand Lift Survey Questionnaire on FB-Ads

Meta allows advertisers to select up to three questions during the setup of a brand lift study, depending on their campaign goals and optimization events. These questions are shown as in-feed polls to both test and control groups and are tailored to evaluate key brand metrics.

Below are some recommended types of Meta BLS questions, aligned with specific brand objectives:

1. Brand Awareness

This measures whether people are familiar with your brand after being exposed to your campaign.

Sample Question:
“Have you heard of [Brand Name] in the past few days?”

This helps assess general recognition and mindshare, especially for new brand entrants or rebranding initiatives.

2. Brand Recall / Ad Recall

This measures whether users can recall seeing your ad specifically on Meta platforms.

Sample Question:
“Do you remember seeing an ad for [Brand/Product] on Facebook or Instagram in the past 7 days?”

This is ideal for video and display campaigns where visibility and recall are key performance indicators.

3. Brand Association or Reminder Messaging

This gauges whether your brand is top-of-mind when associated with a specific keyword, emotion, or context.

Sample Question:
“What product or brand do you associate with the phrase ‘2 minutes’?”

These questions help uncover how well your campaign has linked your brand to a specific identity, concept, or value.

4. Consideration & Favorability

These questions assess the likelihood of a user considering your brand over competitors or their favorability toward it.

Sample Question:
“How likely are you to consider [Brand/Product] for your next purchase?”

Use this if your objective is to shift perceptions or move users down the funnel toward intent.

5. Purchase Intent

This helps measure the final influence of your campaign in motivating users to act.

Sample Question:
“How likely are you to purchase [Brand/Product] in the near future?”

These questions are especially useful for evaluating the impact of promotional or launch campaigns on driving sales.

Meta BLS questions

Final Tips for Meta BLS Questions in 2026:

  • Keep your questions clear, concise, and unbiased
  • Choose questions that align directly with your campaign objective
  • Ensure the creative messaging matches the question’s intent to maximize accuracy and response relevance
  • Remember that results from Meta BLS questions are statistically analyzed to show incremental lift compared to the control group

By crafting thoughtful and strategic Meta Brand Lift Study questions, advertisers can generate powerful insights that go far beyond impressions or clicks measuring real changes in consumer perception, behavior and intent.

How Do I Measure Brand Lift in Meta Ads?
A Step-by-Step Guide to Brand Lift Study (Meta BLS) in 2026

Measuring brand lift is crucial for advertisers who want to understand the true impact of their campaigns beyond clicks and impressions. Meta’s Brand Lift Study (Meta BLS) provides an industry-leading, data-driven way to quantify how your Facebook and Instagram ads influence brand awareness, favorability, recall, and purchase intent.

Brand Survey option available at Business Manager Level for ‘Brand Lift Study

Here’s How You Can Accurately Measure Brand Lift Using Meta’s Tools in 2026:

Step 1: Access Brand Lift Study via Meta Business Manager

Start by logging into your Meta Ad Manager. Navigate to the ‘Test and Learn’ section where the Brand Survey or Brand Lift Study option is available at the account level. This centralized tool helps you design, launch, and monitor your brand lift experiments with ease.

Step 2: Set Eligibility Criteria and Budget

Before launching your Meta Brand Lift Study, define your campaign’s eligibility criteria including:

  • Minimum campaign budget (as per Meta’s 2026 guidelines)
  • Target audience demographics and location
  • Campaign objective aligned with brand lift goals (e.g., awareness, consideration)

Meta’s internal algorithms recommend minimum spend thresholds to ensure the survey reaches enough people for statistically significant results, especially in markets like India and the US.

Step 3: Exclude Brand Lift Audiences from Active Campaigns

To maintain unbiased, reliable data, exclude your brand lift study audience from any other active Facebook campaigns during the test period-and for 28 days after completion. This prevents audience overlap and ensures the study accurately isolates your campaign’s incremental impact.

Step 4: Align Poll Questions with Business Goals

Clear business objectives are essential. Customize your Meta BLS poll questions to directly reflect what you want to measure-whether that’s brand awareness, ad recall, favorability, or purchase intent. The closer the poll questions align with your goals, the more actionable the insights.

Step 5: Determine Test Duration and Maintain Campaign Stability

The recommended duration for a Meta Brand Lift Study is between 2 weeks and 90 days. During this test period, it’s important to keep your campaign active and avoid making changes to targeting, creatives, or budget. Consistency ensures the accuracy and reliability of your results.

Step 6: Customize Brand Lift Study Settings

Meta allows you to set up brand lift studies at multiple levels, including:

  • Account level
  • Campaign level
  • Campaign Group level

You can also customize:

  • Geographic region(s)
  • Vertical or industry
  • Language preferences (ensure campaign and poll question languages match exactly)
  • Poll content focus areas such as awareness, favorability, familiarity, recommendation, or recall

Available Poll Question Types in Meta Brand Lift Study

To maximize the effectiveness of your brand lift measurement, choose from Meta’s predefined poll question types that match your campaign’s core objectives.

Available Poll Question Type in Meta’s Brand Lift Study

Examples include:

  • Brand Awareness: “Have you heard about our brand recently?”
  • Ad Recall: “Do you remember seeing our ad in the last 7 days?”
  • Favorability: “How favorable is your opinion of our brand?”
  • Purchase Intent: “How likely are you to purchase our product in the near future?”

Key Best Practices for Measuring Brand Lift in 2026

  • Ensure consistency between the language of your ads and the poll questions.
  • Target an audience aged 18 years and above to comply with Meta’s study criteria.
  • Avoid overlapping campaigns that target the same audience to reduce data bias.
  • Regularly review Meta’s updated guidelines for minimum budget and audience size to ensure eligibility.

By following these steps, advertisers can leverage the Meta Brand Lift Study (Meta BLS) to gain invaluable insights into how their campaigns influence consumer perception and behavior empowering smarter budget allocation and optimized marketing strategies in 2026.

Best Practices for Creating a Brand Survey Test in Meta Brand Lift Study (Meta BLS): 2026 Guide

Conducting a successful Meta Brand Lift Study (Meta BLS) requires careful planning and adherence to best practices that align your brand survey with your advertising goals.

Below are key strategies to ensure your brand lift tests deliver meaningful, actionable insights:

1. Align Brand Survey Questions with Your Advertising Objectives

Choosing the right poll questions is crucial for the effectiveness of your brand lift study.

Always tailor your Meta BLS questions to directly reflect your campaign’s objectives:

  • For Top of Funnel (TOFU) goals like brand awareness, use questions focused on ad recall, brand recognition, and favorability.
  • For Middle of Funnel (MOFU) and Bottom of Funnel (BOFU) objectives, focus on purchase intent, consideration, and recommendation to understand deeper engagement.

It is essential that your ads prominently showcase your brand name, logo, or unique value proposition to ensure survey respondents can correctly attribute their answers to your brand. Meta recommends displaying your official Page name clearly in the ad creative since the Page name becomes subject to Meta’s AD Policies during the brand survey. If the Page name violates these policies, the Meta Brand Lift Study may be disqualified or restricted.

2. Set Up a Dedicated Campaign Specifically for Brand Lift Testing

Meta strongly advises launching a new campaign specifically for your brand lift study rather than increasing the budget of an ongoing or older campaign. Testing on an existing campaign risks capturing only a portion of the campaign’s impact, which can lead to skewed or incomplete results.

Additional considerations include:

  • Ensure your target audience is 18 years or older, as Meta’s brand lift surveys do not poll respondents under 18.
  • Set an appropriate minimum budget based on your country or region to meet Meta’s thresholds for statistically valid data.
  • Avoid running multiple brand lift tests simultaneously on the same campaign; this preserves the scientific integrity and accuracy of your Meta BLS results.

3. Schedule Your Brand Lift Study Thoughtfully for Reliable Insights

A well-planned campaign schedule is essential. Meta recommends running your brand lift study campaign for a minimum of two weeks to gather sufficient data. For more robust insights, especially in markets with lower engagement, extending the test up to four weeks or even 90 days can help you reach at least 500 survey responses, the benchmark for statistically significant results.

Your brand lift test schedule should align perfectly with the live dates of your ad campaigns to ensure survey responses reflect actual exposure. Also, consider external factors that could impact survey results, such as:

  • Seasonal ad competition during holidays
  • Periods of unusually high marketing spend by competitors
  • Market fluctuations or special events impacting audience behavior

Meta recommends conducting brand lift tests under typical advertising conditions to yield the most practical, reliable insights for your marketing strategy.

Summary of Key Best Practices for Meta Brand Lift Study in 2026

Best Practice

Description

Align Poll Questions with Objectives Choose questions based on TOFU, MOFU, or BOFU goals
Highlight Brand Identity Prominently feature brand name/logo in ad creative
Use Dedicated New Campaigns Avoid testing on older or multi-use campaigns
Target Audience 18+ Ensure survey respondents meet age requirements
Set Appropriate Budgets Follow regional minimum spend guidelines
Maintain Campaign Schedule Run tests for 2-90 days, matching campaign timeline
Avoid Concurrent Tests Don’t test the same campaign in multiple lift studies
Consider External Market Factors Schedule during typical market activity for valid data

By following these best practices for your brand lift study, you maximize the potential of Meta’s powerful tool to reveal true brand impact, boost marketing ROI, and fine-tune your advertising strategies in 2026.

What Results Will an Advertiser Receive from Meta Brand Lift Study (Meta BLS) in 2026?

A Meta Brand Lift Study (Meta BLS) provides powerful, data-driven insights that help advertisers assess how their ads influence brand perception, awareness, and purchase intent. Understanding the outcome of your brand lift study is crucial for refining campaign strategy and maximizing ROI.

When Can You Expect the Results?

According to Meta’s 2026 guidelines, initial results begin populating once your brand survey has received a minimum of 250 completed responses. However, for more comprehensive analysis, the full Brand Lift Study report is delivered within 10 business days after the test concludes.

What Does the Meta BLS Report Include?

Once the study ends, advertisers receive a detailed presentation/report featuring:

  • Campaign Performance Overview:

    A full breakdown of the campaign’s reach, frequency, and poll response metrics, along with the brand lift impact observed.

  • Demographic-Wise Breakdown:

    Insights segmented by gender, age, region, and device type to show how different audience groups responded to the campaign.

  • Industry-Specific Benchmarks:

    Meta compares your campaign results against industry benchmarks within your vertical and regional context to help contextualize performance.

  • Winning Poll Responses:

    Detailed analytics on how users responded to each of the Meta BLS questions (e.g., ad recall, brand awareness, consideration).

  • Actionable Recommendations:

    Data-backed suggestions to help advertisers improve future campaign strategy, creative design, and audience targeting for better lift.

Why These Insights Matter

The ultimate goal of the Meta brand lift study is to determine if the test group (those exposed to the ad) shows statistically significant improvement in brand metrics when compared to the control group (unexposed). By comparing these two groups, advertisers can isolate the true impact of their advertising efforts.

Moreover, budget concerns should not deter advertisers-in many cases, the ad spend already allocated for ongoing marketing campaigns is sufficient to run a successful brand lift study. The insights gained far outweigh the cost, offering clarity on your brand’s position and informing smarter marketing and business strategies moving forward.

Final Thoughts

Investing in a Meta Brand Lift Study is more than just measuring performance-it’s about uncovering how your advertising is actually perceived by real audiences. With customized polling, industry benchmarks, and targeted recommendations, Meta BLS empowers brands to refine their strategy and build stronger connections with their audience in 2026 and beyond.

Take Control, Drive Results: DV360 programmatic Self-Serve Account at Your Fingertips

Why to Implement Google Tag Manager DataLayer? Best Practices to Follow (2026 Guide)

Why to Implement Google Tag Manager DataLayer Best Practices to Follow - Tatvic
TL;DR

A well-implemented Google Tag Manager (GTM) DataLayer is the cornerstone of accurate, scalable, and privacy-compliant digital analytics - powering everything from Google Analytics 4 (GA4) to AI-driven conversion rate optimization (CRO) strategies. In 2026, marketing success depends on measurable insights that can drive optimization across channels, devices, and user journeys. A robust DataLayer provides consistent, structured data for conversion tracking, experimentation, personalization, retargeting, customer lifecycle analysis, and informed decision-making. Without it, brands risk poor CRO outcomes, misaligned spend, and inaccurate attribution.

Why the DataLayer Matters More in 2026

Modern digital measurement has become more complex than ever before. Traditional analytics and tag implementations which rely on hard-coded event triggers or scattered scripts - fail to deliver consistent, reliable data in a world where:

  • User journeys span devices and platforms
  • Privacy regulations restrict data capture
  • AI and machine learning require structured inputs
  • Attribution models depend on high-quality signals
  • Conversion Rate Optimization Agencies demand clean data for testing and personalization

In this environment, the Google Tag Manager DataLayer acts as a single, trusted source of truth. It empowers tools like GA4, advertising platforms, experimentation systems, and CRO services with consistent, structured data enabling accurate measurement, optimization, and growth.

What Exactly Is a GTM DataLayer?

The data layer is a JavaScript object that stores and standardizes key data about user interactions, app states, eCommerce actions, and business context. Rather than flipping through HTML structure or scraping user events from the DOM which is unreliable and fragile the data layer lets developers and marketers push clean, structured data directly.

In technical terms:

The data layer is a central repository of data that GTM (and other tools) can read and act upon.

In practical terms:

  • It tells analytics tools what happened
  • Not just what a page looked like

For example, instead of scraping a button click based on a CSS class, the data layer can push:

window.dataLayer.push({
  event: "add_to_cart",
  ecommerce: {
    items: [
      { item_id: "SKU1234", item_name: "Blue T-shirt", price: 19.99, quantity: 1 }
    ]
  }
});

This structured push is meaningful both to analytics (like GA4) and to Conversion Rate Optimization Agencies that rely on high-quality data for experimentation and personalization.

Key Reasons to Implement a GTM DataLayer

1. Data Accuracy and Consistency

Without a data layer, event tracking depends on fragile implementations tied to UI elements, which often break when websites change.

A data layer is abstracted from UI changes, ensuring:

  • Consistent event definitions
  • Accurate parameter values
  • Better measurement across versions of your site
  • Reliable inputs for multiple tools (not just GA4)

This clean data foundation directly improves outcomes for Conversion Rate Optimization Services, which depend on accurate inputs to evaluate A/B tests, personalization logic, and behavioral analysis.

2. Greater Agility for Marketing Teams

Marketers using GTM can launch new tags and tracking logic without repeated development cycles.

By pushing business-relevant data into the DataLayer:

  • New tags can be fired easily
  • Analytics changes don’t require code deployments
  • CRO experiments can be turned on/off faster
  • Personalization layers can use structured signals

This agility is particularly valuable for CRO Agencies, where rapid iteration and data quality are core success factors.

3. Advanced Tracking and Measurement Capabilities

A strong data layer enables:

  • Enhanced eCommerce tracking
  • Custom event capture (e.g., scroll depth, video engagement)
  • User lifecycle and funnel stage tracking
  • Multi-domain cross-platform tracking
  • Consent-gated measurement

These capabilities feed directly into analytics and optimization systems to surface insights that drive conversion improvements.

4. Better Attribution and ROI Clarity

In 2026, the reliance on advanced attribution models is greater than ever. Whether you’re using data driven attribution modelling natively within GA4 or via an enterprise analytics platform, accuracy depends on:

  • Consistent event parameters
  • Reliable conversion signals
  • Cross-device stitching (where possible)

A structured data layer amplifies signal completeness and reduces noise improving both attribution accuracy and ROI measurement.

5. Foundation for AI and Machine Learning

AI systems whether for automated bidding, personalization, or predictive modeling require clean, structured inputs.

The better your data layer architecture:

  • The better the models perform
  • The more reliable your predictions
  • The stronger your optimization outcomes

This directly benefits CRO efforts that are increasingly driven by AI insights.

What Belongs in a DataLayer? (Modern 2026 Expectations)

A high-quality GTM DataLayer should capture:

1. Page and Context Information

  • Page type (e.g., product, category, checkout)
  • Language or locale
  • Campaign parameters
  • User consent state

2. User-Level Signals (Privacy-Safe)

  • Logged-in status
  • User segments (e.g., VIP, frequent shopper)
  • Experiment cohorts

3. Event and Interaction Data

  • Standardized event names
  • Event categories (e.g., navigation, engagement)
  • Parameters that define interaction context

4. eCommerce Data

  • Product IDs
  • Prices and quantities
  • Transaction identifiers
  • Cart details
  • Promotion details

Each of these components empowers analytics tools and Conversion Rate Optimization Services to measure what matters and act on it.

How a DataLayer Works With Google Tag Manager

1. Initialization Before GTM Load

A key best practice is to define the data layer before the GTM container code in the HTML <head>:

<script>
  window.dataLayer = window.dataLayer || [];
</script>
<script async src="https://www.googletagmanager.com/gtm.js?id=GTM-XXXX"></script>

This ensures initial page variables are available immediately.

2. Pushing Dynamic Events

As the user interacts with the site, you push structured information:

window.dataLayer.push({
  event: "begin_checkout",
  ecommerce: {
    currency: "USD",
    value: 59.98,
    items: [...]
  }
});

GTM listens for these events and fires tags accordingly.

3. Tags, Triggers, Variables

In GTM:

  • Triggers detect specific data layer events
  • Variables capture values from those pushes
  • Tags send the data to platforms (like GA4, Meta Pixel, measurement servers)

This decouples your tracking logic from UI structure and eliminates brittle implementations.

Best Practices for Implementing Your DataLayer in 2026

1. Always Standardize Naming Conventions

Use clear, consistent naming across events and parameters:

  • Prefer add_to_cart over cartAdd
  • Use snake_case or camelCase consistently

This reduces confusion and supports automation and tooling.

2. Use Event-Driven Tracking for Every Meaningful Interaction

Pageviews alone are no longer sufficient. Track:

  • Clicks
  • Scrolls
  • Video plays
  • Form interactions
  • Engagement depth

Properly structured data allows CRO teams to link interaction patterns with conversion lift.

3. Avoid DOM Scraping Wherever Possible

DOM scraping (reading data from HTML) is fragile and breaks easily with design changes. A DataLayer push is far more reliable.

4. Implement Reset Logic for Single Page Applications

In SPAs, values can persist between views. Clear or overwrite the data layer when context changes.

5. Build for Consent and Privacy from Day One

Include consent state in the data layer so tags only fire based on user preferences.

6. Use Server-Side GTM Where Appropriate

Pushing DataLayer events to a server-side container can:

  • Improve performance
  • Reduce third-party script reliance
  • Enhance privacy compliance
  • Support more advanced use cases

Common Mistakes and How to Avoid Them

Even experienced teams can fall into:

Hard-coding Event Tracking

This leads to inconsistent data and high maintenance costs.

Fix: Always push to the data layer and let GTM handle tag execution.

Inconsistent Naming and Loose Taxonomy

Variable naming drift causes confusion and misreports.

Fix: Build a documented naming standard upfront.

Ignoring Consent and Regional Regulations

Tracking without consent risks legal penalties and data suppression.

Fix: Integrate consent signals directly in the data layer.

No QA or Validation Process

Publishing without testing leads to broken analytics.

Fix: Use GTM Preview Mode and data layer inspection tools.

DataLayer for GA4: A Natural Pair

GA4’s event-centric model expects structured event data - which matches the way DataLayer works.

A strong DataLayer enables:

  • Enhanced ecommerce reporting
  • User lifecycle analysis
  • Custom event definitions
  • Precision in conversion tracking

This directly boosts the quality of insights available to Conversion Rate Optimization Agencies and internal teams alike.

How DataLayer Empowers Conversion Rate Optimization Services

At its core, Conversion Rate Optimization depends on:

  • Accurate event capture
  • Reliable segmentation
  • Clear funnel behavior
  • Data for experimentation

A strong GTM DataLayer ensures that:

  • CRO experiments measure real business outcomes
  • Personalization engines receive consistent signals
  • Segment definitions align across platforms
  • AI-driven recommendations are fed clean data

In short: Optimization decisions become evidence-backed, not guess-based.

Implementation Checklist (2026 Edition)

Use this list to ensure a robust data layer:

✔ Data layer defined before GTM snippet
✔ Event naming conventions documented
✔ All key user interactions pushed to data layer
✔ Consent state included
✔ Enhanced ecommerce objects captured
✔ SPA reset logic in place
✔ GTM Preview Mode validation done
✔ Server-side integration planned
✔ Documentation available for dev and marketing teams

Final Thoughts: DataLayer Is Behind Every Great Analytics Stack

In 2026, tracking isn’t just about collecting data it’s about collecting correct, reliable, structured data that can power:

  • Analytics
  • Attribution
  • Personalization
  • Experimentation
  • CRO
  • Predictive insights

Without a DataLayer, your analytics stack is fragile.  With it, your entire measurement ecosystem becomes scalable, future-proof, and insight-ready.

Want an expert review of your GTM DataLayer implementation and strategy?
Connect with Conversion Rate Optimization Specialists and data architecture specialists to unlock reliable measurement that drives growth.

Bot Icon
Bot Icon

Tatvic Bot

Explore About Tatvic and Services