Hello There!

Lorem ipsum dolor sit amet, consectetur adipiscing elit,

Lead Generation Form Analysis - Part II

Lead Gen Form Analysis

In my previous blog post, I explained about why it is important to carry out lead gen form analysis and methodology we used to collect the required data. Here I will give a detailed overview on how we carried out the data analysis stepwise. I have also included list of action items that generated ROI for the client.

Data Analysis

Two most important points you must take into account before starting any analysis:

  • Data of sufficient time frame
  • Define important KPIs that can be segregated further to get meaningful insights.

We have defined three KPIs in our case. These KPIs will act as decision making variables that will help us in evaluating the performance of forms.  Here are the KPIs:

  1. Form view to Conversion Rate: It is the ratio of no. of forms  submitted to unique pageviews of that form page
  2. Form Start Rate: It is the ratio of no. of users who started to fill up form vs. no. of users who viewed the form page
  3. Form Conversion Rate: It is the ratio of no. of users who started to fill up form to no. of users who submitted the form.

Our first step was to find out if any correlation exists between avg. page load time, avg. time on page and exit rate vs. the three KPIs. The only observation found was the inverse relation between avg. time on page and form start rate, which means less and less users started to fill the form as page load time increased?

Lead Gen Forms’ Performance

KPIs Values: Lead Gen Form analysisWe carried out analysis at the Macro level by calculating the KPI: form view to conversion rate. In this case we observed this rate as 15% (which means only 15 out of 100 who visited the page, submitted the form). Now moving towards Micro level, we identified 22% form start rate. Next question was how many of them actually submitted the form after starting to fill it. And Form conversion rate for the site was observed to be 80%. These observations gave us clear overview of how users actually interacted with the form.

On digging further, we observed the placement and orientation of forms and checked whether it affected our KPIs or not.

Orientation of Forms vs. KPIs

Orientation vs. Form Start Rate & Form Conversion RateWe observed that when comparing the form start rate, the forms which are right aligned or are on right hand side of the page tend to have 31% form start rate vs. 22% for forms which have central orientation (as shown in Graph 1). It suggests that the general tendency of the user is to start filling forms which are on right hand side on the page.

Moreover, we also found that orientation of the forms affected the form conversion rate. As the forms which were right aligned had 15% higher conversion rate than the ones which were center aligned.

 Placement of the Forms vs. KPIs


To categorize the forms further, we checked how placement of the form affected the KPIs. From the analysis we found that forms which were placed Above the Fold (ATF) have 29% Form Start Rate vs. 3% for the forms below The Fold (BTF) (as shown in Graph 2). This clearly shows that users are not able to identify the form by scrolling down the page.

Effect of Form Length on KPIs

We also looked out for any correlation that may exist between no. of form fields, form start rate & form conversion rate. Start rate for the forms decreased significantly as no. of fields increases which indicates that form length is directly affecting the user’ s decisions (as shown in Graph 3). But on the other hand, form length doesn’t affect the form conversion rate, which is against the common belief that user likes to fill the forms which are shorter.

Analysis of Form Fields

In the next step, we studied the behavior of each form field to identify if certain field causes significant drops and check if optional fields can be removed. And our hypothesis is proved valid when we observe that certain form fields that were causing large exits from the form and that demanded attention & action.

In one form, ‘No. of Employees’ field had caused a drop-off of 20% (whopping! isn’t it??). It means, 20 out of every 100 visitors were abandoning the form after reaching this field. The same field in another form caused a drop off of 11%. This clearly shows that there is an issue with this field due to which user are abandoning the forms.

Looking at the data of the forms, we also find that presence of the side bar links on the form pages cause severe distraction as approx. 30% of users abandoned the form pages by clicking on sidebar links.  This is an important observation as site owners tend to put many links on the form pages without knowing its implications.

Assigning $ values to lead submission

This analysis brought forth some important observations. But what about economic impact this analysis generates? Simple insights and data points are not sufficient to convince any stake holder in terms of how much revenue benefit the analytics will generate. The most important aspect of any this analysis is that it should generate significant ROI for the client.  So, in this analysis we assigned lead values to each form based on its impact on the business. We used this lead values to calculate revenue benefits that were generated from each form submission and found the revenue leakage due to form field abandonment. By this way, we can directly attribute our observations with the revenue loss incurred.

For e.g.: For one form, 2500 visitors started form filling and 2100 visitors submitted the form. With the lead value of the form being $1000, revenue leakage due to 400 abandons resulted in $400,000 loss (Shocking!!). This is just for one form and when we calculated the same for all forms, we found revenue leakage caused due to form abandonment in Thousands of Dollars(Just Imagine!!) and how much revenue leakage can be contained from the analysis will help generate ROI.

Action Items from Analysis:

From this analysis, it appears that there are lots of opportunities where we can contain revenue leakage that occurs due to drop of visitors from the lead gen forms. The most important action items we get from the analysis is developing several ideas for A/B tests based on the observations. To generate test ideas we also took into account the best practices for form field. Some of these are:

  • Changing the placement and orientation of the forms
  • Removing the forms fields which are causing extra ordinary drop offs
  • Changing the input method of fields
  • Removing the sidebar links from the form pages
  • Removing the top menu from the form pages
  • Keeping the name of the form field above it

Another action item that was derived from the analysis was the creation of Re-marketing list of the users who had abandoned the form after starting to fill it.

This analysis proved to be very insightful and it will continue to do so due to the sheer impact it can cause on revenue. I hope this blog post can help you in carrying out analysis on your own.

Do you want us to carry out similar analysis on your website? Get in touch with us.

Lead Generation form Analysis Guide using Google Analytics

leads in GA

leads in GA

If you are in B2B business the best way to check the performance of your site is to check how many leads it generates. But it is not at all easy for any lead gen sites to convert visitors in to leads and get business. To attract more visitors and generate potential leads you invest heavily in the appearance of your website, hire best developers and use best web site technologies. And still, you find that you are not generating enough leads to grow your business. Its because sometimes business owners ignore one very important part of the web site, which is lead gen forms. Lead gen forms are one of the prime way to grow your business. That’s why as a B2B site owner, it is imperative to check the performance of the lead gen forms.

Pic1

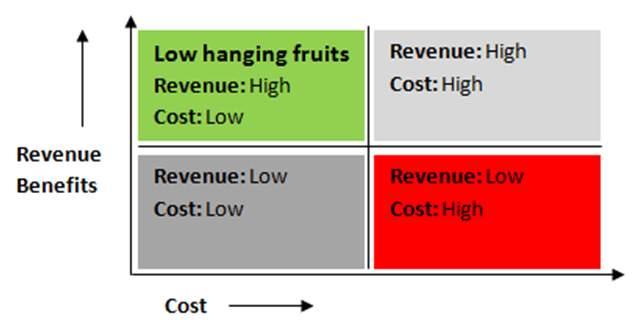
Another reason why it is advisable to check the performance of forms and fix the issues is that leads gen forms are ‘Low hanging fruits’ for the business. ‘Low hanging fruits’ are those opportunities for business where you achieve high ROI without incurring much cost. Lead gens forms belong to this category due to the impact it can cause on the revenue. Benefits derived from optimization of forms can yield great financial benefits to the business as it can directly impact the no. of leads submitted. But question is how to check the performance of the forms using form field analysis.

In this blog post i am sharing with you one interesting case study of the lead gen forms’ analysis that we have carried out for one of our client. I will now try to to lay down the road map in a simple and systematic manner so that it will become easier to understand and execute as well. I hope that this blog post will give you a clear idea on how to check the performance of your lead gen forms.

Objective of the analysis

Our objective behind carrying out this analysis is to identify if there are any anomalies in forms fields or forms positioning that is leading to extra-ordinary drop-off rate during the form filling process. Along with it we also want to understand whether it is required to restructure the order of certain set of forms to have them understandable & easy to navigate to ensure higher form fill up rate.

Data collection/Methodology

To carry out any analysis it is utmost important to gather right data. It was not possible for us to get the data required to carry out this analysis in GA so we implemented advanced tracking mechanism to track all the necessary data points. Implementation of tracking was easier for us as we already had GTM implemented on the client’s site. GTM made all the tagging easier. If you wish to carry out this analysis after reading this blog post, I would strongly suggest you to implement GTM as it will make your dev. team’s life much smoother. (Here is a blog post on why I love GTM)

Now, since GTM was implemented, we customized JavaScript to track different steps (fields of forms) using virtual page views in Google Analytics. Virtual Pageviews get fired whenever user completes any field and moves to the next field or perform any other action. This implementation ensures that we track the interaction of user with each form field.

pic2

Using virtual page views, we built different funnels for each form to learn the number of users starting the funnel & understanding users’ abandonment at different forms fields. We created funnel goal for each form and ensured that funnel steps match the sequence of fields in the form. It ensures that we track the user flow from the first field of the form to form submission. One example of such funnel is shown here. This funnel shows the no. of users abandoned the form from each field. In this figure, the steps of the funnel describes the name of the form fields and no. on the RHS describes no. of users who abandoned the form from each field.

We also collected data of form positioning on different pages, no. of fields in forms, no. of errors occurring while filling the form, no. of visits distracted towards form sidebar links.

At the page level we considered Pageviews, Avg. page load time, avg. time on page and exit rate as primary set of dimensions and metrics which give us clear idea on the form pages.

So this was about what data points needs to be collected to carry out this analysis. I have divided this blog post in to two parts. In the second part, I will explain about how we carried out data analysis and set of action items that has generated from this analysis.

(Part 2: Lead gen form Analysis using Google Analytics)


Web Page Sequencing Analysis Using Google Analytics

Recently on a project, we were trying to implement the network path diagram and carry out an analysis with the website’s page sequence data to know if there exists a specific traversing pattern among visitors.

While there is a lot of visual representation available (such as Paditrack) of a sequence of pages visitor follows the real beauty is having a such sequence as row data to have them analyzed.

For example, if you know a specific visitor pattern is always observed before a visitor initiates the sale, it would be great to know that. If you know a specific content consumption results in visitors returning to the website the next day, it would be awesome for you.

By having data for sequences in raw format, you are aided with a tool that you can collect those data and eventually carry out such beautiful analysis.

We are using an anonymous visitor id for each visitor in one custom variable on the visitor level and set another custom variable on the page level to have the incremented counter value which is stored and accessed from the cookies.

Implementation:

  1. Download the script “Page Counter Script” from the JavaScript Resource section (PageCounter Script).
  2. Unzip the content and include the script on all the pages of your website.
  3. When you are done with the implementation on all pages of your website check with the implementation using “Omnibug” in Firefox or using the Developer tool in Google Chrome.
  4. Once you see the gif requests are made to the GA server and data would show under All Pages in Google Analytics.
  5. Don’t forget to create a different view to separate the page counter virtual Pageviews from the main view so that it does not affect the bounce rate.

Note: We have used one custom variable and virtual pageview as follows:

Custom Variable 5 Visitor Level Constant through the visitor-level cookie existence. Stores randomly generated anonymous visitor id
Virtual Pageview Page Level Page sequence counter stores page URL with sequence counter incremented by 1 on each visit of a page as a virtual pageview

How does it work?

  1. We initialize a visitor id in one custom variable which sets to visitor level upon first visit using the Visitor Id script and set a page counter cookie value to 1 and send it to GA using virtual pageview. You can download the Visitor Id script from the JavaScript Resource section (Visitor ID tracking). In our case “vid” is customVar5.
  2. Once the visitor browses through other pages in session; the page counter value is incremented by one and the value is submitted to GA using trackpageview or trackEvent call.
  3. On the next visit, the page counter cookie value resets to 1 and begins the new counter for the new session
  4. This page counter value and the page URL are sent to GA using trackpageview (Virtual pageview). Note: You can also use Events to send page counter data to GA using trackEvent.
  5. All the data can be extracted using GA API as mentioned below. Which can be used to represent the visual flow from a page to another page.

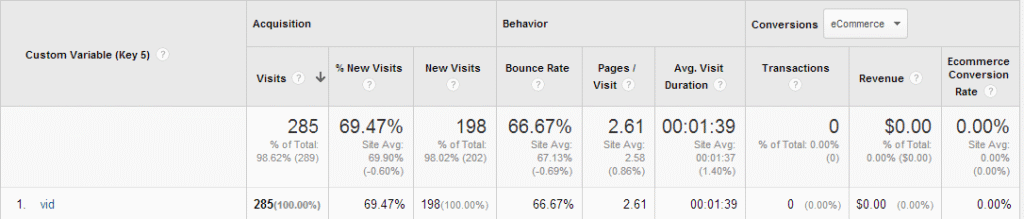
Google Analytics would show reports as follows:

Visitor Id Data:

Page Counter Data:


Note: it would show the above data only when using trackpageview. You can use event data for the calls made through trackevents.

Data extraction of the data collected:

Once the tracking is implemented on all pages and data is collected on the GA interface. You can use data query feed explorer from Google Analytics using GA API v3 or use our Excel plugin Data should be similar to the image below.

Reference:

  1. Visitor Id: Unique visitor id.
  2. Virtual pageview: Pageviews with the page URL and page sequence data.
  3. Visit Count: Visit count of a visitor.
Dimensions, Metrics, and Filters
Dimensions: ga:customVarValue5, ga:pagePath, ga:visitCount Note: Change the custom Variable number if you have changed while implementation
Metrics: ga:pageviews (Virtual pageview call to send page counter info to GA in the script)
or
ga:totalEvents (Event call to send page counter info to GA in the script)
Filter: ga:customVarName5== vid;ga:pagePath=@ /vp/pgc Note: if you have changed the custom variable names then please update here too.


How it is different from Page-Depth
Page Depth gives you a count of pages viewed by visitors in a session. Whereas Page Sequence gives you which pages a visitor visited in a session along with its sequence.

Benefits:

  • You can know how user follows through pages and can know the navigation trail easily.
  • You can find what are the pages which are important and makes users interact with your website
  • Helps you identify pages from where a user leaves your website if conversions are not happening. So that you can implement strategies to win your customers.

Want to implement this solution on your website and do the data analysis? Contact us

Predict User’s Return Visit within a day part-2

Welcome to the second part of the series on predicting user’s revisit to the website. In my earlier blog Logistic Regression with R, I discussed what is logistic regression. In the first part of the series, we applied logistic regression to available data set. The problem statement there was whether a user will return in the next 24 hours or not. The model is built and till now it was showing us 88% accuracy in predicting user’s revisit.

In this post, I’d try to showcase ways to improve this accuracy and take it to the next level. This is more about technical optimization so  if you are a business reader you may want to skip and check how can you use this for your benefit. But, if you are techwiz or Data modeling guy like me, let’s get rolling.

As I have discussed in blog Improving Bounce Rate prediction Model for Google Analytics Data, the first step of the model improvement is variable selection and the second step is outlier detection (If you want to know more details of steps, refer mentioned blog). Let’s apply these steps one by one.

Variable selection

I have used stepwise backward selection method for variable selection. R code for the stepwise backward selection method is as below.

>Model_1 <- glm(revisit ~ DaySinceLastVisit + visitCount +f.medium +f.landingPagePath +f.exitPagepath+pageDepth, data=data ,family = binomial("logit"))
>library(MASS)
>stepAIC(Model_1, direction="backward")
Output
Start:  AIC=2119.37
revisit ~ DaySinceLastVisit + visitCount + f.medium + f.landingPagePath +  f.exitPagepath + pageDepth

                     Df Deviance    AIC
- f.exitPagepath    152   1732.4 1966.4
- f.landingPagePath  87   1751.0 2115.0
                    1581.4 2119.4
- pageDepth           1   1583.4 2119.4
- f.medium           11   1656.5 2172.5
- visitCount          1   1740.1 2276.1
- DaySinceLastVisit   1   1826.4 2362.4

Step:  AIC=1966.42
revisit ~ DaySinceLastVisit + visitCount + f.medium + f.landingPagePath + pageDepth

                     Df Deviance    AIC
                    1732.4 1966.4
- pageDepth           1   1738.9 1970.9
- f.landingPagePath 101   1987.5 2019.5
- f.medium           12   1821.2 2031.2
- visitCount          1   1929.3 2161.3
- DaySinceLastVisit   1   1978.4 2210.4

Before we understand the output, let me explain how the variables are selected in stepwise backward selection? In the stepwise backward selection method, AIC is used as the selection criterion. General rule is lower the AIC, best the model(i.e. For a group of variables, if AIC decrease by removing any variable(s) from group,then remaining variables are used in the model. This process continues until AIC stops decreasing). From the output, we can see that AIC is decreased and variable exitPageapath is excluded from the model. Now, we will create new model(Model_2 ) which does not include exitPageapath. R code for new model is as below.

>Model_2<-glm(revisit ~ DaySinceLastVisit + visitCount +f.medium +f.landingPagePath +pageDepth, data=data,family = binomial("logit"))

After generating the new model ,let’s check the accuracy of the new model and it is as below.

>predicted_revisit<- round(predict(Model_2,in_d,type="response"))
>confusion_matrix<- ftable(revisit, predicted_revisit)
>accuracy<- sum(diag(confusion_matrix))/2555*100
Output
86.57534

From the output, we can see that accuracy of the new model is decreased. This does not seem good to us. Variable selection method did not help us in improving the model. Let’s try second step for model improvement which is outlier detection.

Outlier detection

As we know that data set contains some unreliable observations which make model’s quality poor. We always need to detect outlier and remove them. For numerical variables, outliers can  be removed by observing the histogram of  frequency distribution of the values of each variable (Process is described in blog Improving Bounce Rate Prediction Model for Google Analytics Data). In our data set, there are three numerical variables named visitCount, daySinceLastVisit and pageDepth. I have generated new data set after removing outliers. Let’s create new model based on new data set and check the accuracy of the new model. R code for new model is as below.

>Model_3 <- glm(revisit ~ DaySinceLastVisit + visitCount +f.medium +f.landingPagePath +f.exitPagepath+pageDepth, data=data_outlier_removed ,family = binomial("logit"))

Now, we will check the accuracy of the new model and it is as below.

>predicted_revisit <- round(predict(Model_3,in_d,type="response"))
>confusion_matrix <- ftable(revisit, predicted_revisit)
>accuracy <- sum(diag(confusion_matrix))/2292*100
Output
98.42932

From the result, we can see that model has more accuracy than previous models (Model_1 and Model_2) and it is good for us. So, removing the outliers from the data set, the model got more improvement and prediction accuracy.  For now, we can conclude that through this model (Model_3), we can predict more accurately whether a user will return to website in next 24 hours. If you want to do exercise, Click here for R code and sample data set. In the next blog, we will discuss about logistic regression with Google Prediction API, check the accuracy of the Google Prediction API for our data set and try to predict for a user that will user return to website in next 24 hours?

Would you like to understand the value of predictive analysis when applied on web analytics data to help improve your understanding relationship between different variables? We think you may like to watch our Webinar - How to perform predictive analysis on your web analytics tool data. Watch the Replay now!

Bot Icon
Bot Icon

Tatvic Bot

Explore About Tatvic and Services