Hello There!

Lorem ipsum dolor sit amet, consectetur adipiscing elit,

 About Riddhi Mehta

Riddhi is an experienced User Experience Designer with a demonstrated history of working in the information technology and services industry. Skilled in Prototyping, Concept Development, Design Thinking, User Experience Design, and Web Design, she has a bachelors in Product Design and a Masters in Communication Design.

Asynchronous code enhancement for Outbound Link Tracking Google Analytics

You all are aware of “Update to Brian Clifton’s Outbound Link Tracking Code” post

I would like to update that script for Asynchronous Google Analytics Implementation, which is available here

It will serve four purposes:

  1. External Link Tracking: To track all links on your webpage which are external links i.e. sub-domain or 3rd party domain links.
  2. Email Link Tracking: To track all links which are “mailto” links.
  3. Document Download Tracking: Track all documents which ending with .jpg, .doc, .docx, .xls, .zip, .pdf etc. (you can change according to your need in the code).
  4. Time Tracking: It will also track how much time later user clicked on the link.

All you have to include the code just before the </head> tag in your website.

<script language="javascript" type="text/javascript" src="/external_link_tracking.js" ></script>

Note: This script requires JQuery library to work. Please comment if you need such library for any other JavaScript framework like Mootools or Prototype.

Online Surveys - Great way to engage & know what customers want

We run huge marketing campaigns to serve our customer better. We use Premium Analytics tools because we don’t want to lose any important insights, the ads are becoming more contextual to target right user for the right product. At the end of the day, it’s the customer who has to be happy with our product or services. What would be a better way than asking them directly?

Surveys help us communicate directly with our customers. What kind of features they want? What turns them off? Do they really need your newsletter?

Online survey is a very important marketing tool to know what customers want, especially what they don’t want. There are a lot of tools available for online surveys.

A good survey tool will let you Create customized questions, and provide detailed responses with results and insights.
We studied a lot of tools and found a few tools very essential and full of features. Theses tools are widely used amongst big brands, and the best part is, they all have a free plan, which is great for small organizations, and also for first timers!

    1. Survey monkey
      • Free plan limit:
      • Surveys: 1
      • Questions: 10
      • Responses: 100
      • At plans starting from $ 19.95 per month, you can get up to 1000 responses. You can even choose $200 per month and get unlimited questions and responses.

Survey monkey is one of the best and most popular tools available.

Our review:

It provides real time results. Important for very large sample size. You can even embed surveys on your web site. You can even customize the template to match the look & feel with your website. You can also send surveys via email and website pop ups, which is a unique feature. Survey monkey is used by many big brands and is considered one of the best survey tools around. It offers a great user-friendliness with a very neat and clean UI. It offers a nice Dashboard to manage your survey campaigns. There’s an analyze section which gives a nice analysis of your survey responses.<a href=” https://tatvic.com/google-analytics-implementation/”>Google Analytics Integration</a> is much easier with Survey monkey. There’s an app available in Google apps marketplace. Which easily integrates with you Google analytics account. You can gather very important insights about your surveys in Google Analytics using this app.

Overall, SurveyMonkey is highly recommended if you need to run a lot of surveys regularly. The highest plan $200 per month is also not a bad price for this product for large users.

    1. Survey gizmo
      • Free plan limit:
        • Surveys: Unlimited
        • Questions: Unlimited
        • Responses: 250
      • All paid plans offer 14-day free trial. So if you are confident about the product, you can even go directly for the paid plan.Plans are from $19 to $159.Our review:

Survey Gizmo

Survey gizmo has a very easy and user-friendly tool. Unlike other tools, you can create unlimited Surveys and ask unlimited questions. At only $19/month you can upgrade to unlimited responses. It’s the best part of this service. It offers a nice dashboard the moment you sign in, to easily manage your survey projects. There’s a smart thing they have done. When you click on Pricing, you can’t see a free plan.

They are hiding the free plan in the Features section. While you are creating the survey, it guides you throughout with examples making it easy even for first-timers. It has a fresh web 2.0 look and user-friendliness, which makes creating and managing surveys a treat. If you send a lot of surveys. With a cool look, it also delivers on the functionality. There’s no app available for Google Analytics implementation, but there’s an easy code pasting method to analyze your survey responses in Google Analytics. The $19 plan provides unlimited responses which is not a deal at all.

    1. Question Pro
      • Free plan limit:
        • Surveys: 1
        • Questions: 10
        • Responses: 100
Our review:

Question Pro

QuestionPro doesn’t live up to look and user-friendliness as much as the above 2 tools do, but it’s no less in terms of functionality. It offers a simple interface with lots of question types. It is also the cheapest tool available. In the $12.50 plan, you get unlimited surveys, questions, and responses. . It also offers Google Analytics integration.

If you are a non-profit organization, you get a license for free. Previously it offered unlimited responses in a free plan, now it offers only 100. QuestionPro’s paid plan is a perfect fit if you are a start-up or a small organization.

Summary:
All of these tools are great fit for different kind of needs. All of them offer Google Analytics integration.

SurveyMonkey is the best choice enterprise. Premium pricing with much more premium features. It offers web pop-up surveys which non of other do, provides 24×7 customer support, real-time responses, and lot many things. Offers great usability and simplicity in creating and managing surveys. It has a great analysis and reporting section, which is very unique among other tools.

Surveygizmo is a little moderate on pricing but still is a very nice choice for medium and even big organizations. It offers Facebook, Twitter, and Mailchimp integration in a free plan as well. Just pay $19 and you can get unlimited responses.

The questioner should be yours if you don’t want to pay $19 per month or are trying out a paid survey application. Pay $12 per month for unlimited responses. You can even go for a $99 plan for advanced features and support. Perfect for small budgets.

Top Google Analytics Event Tracking Tips from 7 Analytics Influencers

I’m very excited to bring you this expert roundup post. I asked 7 Google Analytics Experts for their tips for Event Tracking. Here are my broad takeaways:

  • Tracking the ‘Core Business’ Signals / User Interaction
  • Enhanced Ecommerce Events
  • Popup Tracking

Read on to discover each expert’s response. You can skip ahead to your favorite expert with the links below and please, get comfortable and read through all the great responses.

  1. Paul Koks
  2. Himanshu Sharma
  3. Doug Hall
  4. Julius Fedorovicius
  5. Stéphane Hamel
  6. Mikko Piippo
  7. Jeff Suaer


Event tracking is one of the most powerful features of Google Analytics.

Keep in mind the business/website goals when defining your Event Tracking measurement plan.

Here are a few events that I nearly always recommend setting up.

  • Add-to-Cart and Checkout Errors
      • Especially on E-commerce websites, users can encounter a ton of errors while going through the checkout flow. I recommend keeping track of the errors, finding common patterns, and correlating them to user/purchase behavior. 
      • This is how you can prioritize what needs to be fixed to enhance the user experience and eventually your sales numbers. In addition, you might want to have some other, external tools running for demystifying the errors on your site.
  • Email Modal Appearances and Submits
      • There is more than direct sales. 
      • It’s common now to convince visitors to become subscribers by showing a promotional popup/modal to get the visitors’ email addresses. 
      • It’s one thing to monitor the number of submits, but you also want to implement an event for monitoring when the modal appears
      • Then you can effectively start calculating the conversion rate of the modal and start optimizing it. 
      • In other words, don’t just focus on direct conversion and sales-related events, you also want to track important micro-actions on your site.


Enhanced e-commerce events are the top events for me because it provides the ability to set up enhanced ecommerce reporting in GA

Enhanced e-commerce is complete revamp of traditional e-commerce tracking in the sense that it provides many more ways to collect and analyze e-commerce data. 

It is like e-commerce tracking on steroids. 

Enhanced e-commerce provides twice as many reports as traditional e-commerce. Thus enhanced eCommerce provides deeper insight into the e-commerce engagement of your users.


Firstly, there is no “one segment fits all purposes perfectly” solution. 

The context of the business and the business question is fundamentally important to building the right segment that delivers the right answers.

Often, the challenge, sites, and stores face is to provide the right message to the right person at the right time and then deliver an onsite experience that is friction-free. 

One key ingredient to solving this challenge is (in the world of GMP) to use audiences. 

Grouping users by intent and by their stage in the purchase/engagement process requires clear signals in the quantitative data.

Notice I don’t use the word funnel.  

Funnels are linear models we cling to in the hope of rationalizing our Utopian view of how our business should be used.

It’s a naive view of the world and is completely wrong.  Users are non-linear.

They are not blithely proceeding like tame sheep through the prescribed steps that we arrogantly dictate as THE FUNNEL. Nope. Don’t happen.  

Users flit in and out of the site.  They dabble and tinker.  

They cogitate and ruminate on slapping their hard-earned dollars on this widget or that service.  

We need signals that tell us where they are in the process and what they’re in the market for.

The best events for collecting these signals are those that tell us what they want (intent) and how close they are to getting it (a stage in the process).

  • Have they used an onsite search?  
  • Have they spent an unusual amount of time revisiting certain categories of products an unusual number of times?  
  • Are they zoned in on one category of service or are they generally interested in everything and anything?  
  • Have they added to their cart but not yet purchased?  
  • Have they clicked through on certain campaigns?  
  • Have they signed up for a newsletter?  

Collect and rank all the possible signals that expose intent and behavior. 

Model the next best action based on these signals and then you can start to build audiences.

These audiences enable you to CONNECT campaigns with the right message with the right user at the right time rather than running ads across the internet and hoping. Audience targeting based on behavioral signals is way more efficient.  

Then, once they get the message at the right time, they click and are greeted by a contextually relevant landing page. They don’t even have to think - they are where they wanted to be at the right time and are primed to engage and transact.


I know that this will sound like a total cliché but I always focus more on the essentials/basics of GA tracking first.

This includes proper attribution, cleaner data (e.g. exclude internal traffic, ignored query parameters, campaign tagging), etc. 

The only exception to this rule would be Enhanced E-commerce (because it is not a basic part), however, having it configured properly and making sure that there is a consistency in data between different steps of a funnel is crucial. 

You can do all the customizations you want but if the foundation is wrong (e.g. attribution), that advanced/custom stuff will fall flat as well. 

Only after these are taken care of, I can start thinking of some advanced/custom events (that rely on the specifics of a project), for example (but definitely not limited to):

  • Form abandonment 
    • (I usually do this together with developers) because “Universal” solutions available online are not that much universal (because there are many different types of forms). What we basically do is that when a form field is filled in, data is pushed into the Data Layer and a GA event is tracked (but only once per page per field). Then in one of the GA’s flat tables, I check where are the biggest drop-offs. Goal:
    • Identify the most harmful fields in the signup process
    • After that, get rid of those fields or make them more appealing (“somehow”). This depends on the project.
  • Enhanced E-commerce
    • If the client’s budget allows for implementing Enhanced E-commerce to its full potential, promotion tracking is also in place. 
    • However, the problem with promotion impression tracking (by default) is that the impression might be counted even if the internal banner was never displayed to a visitor (because it never appeared in the browser’s viewport). That’s why I implement True view impression tracking (it captures the impression when a banner is actually visible on the screen). 
    • People can learn more about it in Simo Ahava’s blog post. 
    • Benefits:
      • The number of internal promotion views will be more accurate
      • Internal promotion CTR will be more accurate 
      • Looking from a technical perspective, with this solution, there will be a much lower chance of reaching the maximum Google Analytics payload size which is 8 kilobytes.
      • Final result: a better understanding of which internal promotions are actually working and driving more sales.
  • Interactions that reveal the visitor’s intention (e.g. tracking the website’s auto-complete search). 
    • There are two ways of implementing this:
      • Follow Simo’s guide (an out-of-the-box solution). It will fire an event with the search query every time a visitor chooses one of the suggested search results OR a visitor pauses for X seconds while entering the search query.
      • Cooperate with a developer and get more in-depth information. 
      • Together with every search query event, you could ask a developer to push the number of suggested search results that a visitor saw by entering that particular query. That way you could find the most common search phrases that got the least (or no) suggested results. That’s your gold mine. 
      • This is what your visitors/users are looking for but do not get at your website/store. If those queries make sense to your business, some resources could be invested in producing that content or doing other needed adjustments
  • Bonus: 
    • I have just recently come up with this one (therefore, don’t know the scale of an impact (but I’m definitely curious)). 
    • I’m planning to start implementing page translation tracking on various websites/online stores (including my current ones). 
    • Every time a visitor/user translates a page (with Chrome, Google Translate page, etc.), I’ll capture this as a GA event. 
    • Insights that I’m looking forward to:
      • What is the demand for a localized version of a website?
      • How are visitors (who translate websites) converting compared to the regular ones?
      • I didn’t want to overlap with the opinion of other experts in this article, therefore, I picked some of the less common custom GA events:  


Over the years, I have found the same “patterns” repeat over and over on all websites. 

The most obvious ones are those covered by the Autotrack library.

  • Do you have outbound links? Of course, you’ll want to track them! Do you have downloadable content? Yep, you’ll want to track those too.
  • So beyond those low-hanging fruit, the one and absolutely important thing to track - whether it’s through events, e-commerce, or simple page funnel, is your “core business”.

For eCommerce, it’s kind of obvious that you will want to track your checkout process very thoroughly - but don’t forget to add/remove from the cart, account creation, product impressions, detail views, etc.

For many sites, it might be the lead generation form and workflow - end to end, including the resolution of the lead, even if it happens offline. Otherwise, you’ll have no real way of measuring success online.

For other sites, it might be some kind of product configuration - think of automotive “build my car” workflows.

Those tend to be more complex to the instrument and yet, they are the closest to the core business and therefore, most important.

Sadly, in my experience, I have found marketers were too often contemptuous of measuring traffic and failed at measuring complex workflows.


Tracking user interaction with events is important for conversion optimization. Even the most basic tracking can help here a lot.

Tracking Call To Action Button:

  • Nowadays, I like to track all call-to-action buttons on the website as events. 
  • In the events, I track at least the text used in the CTA. If different colors or other visuals are used, it is useful to track this, too. Collecting this kind of data helps me to optimize the CTAs for higher CTR and ultimately for more conversions. 
  • In addition, CTA texts can also be more useful than URLs for creating highly converting remarketing audiences for display and social media advertising.

Popup Tracking:

  • For popups, I track two different types of events: one event using a visibility trigger and events for user interaction (click the CTA, close button, etc). 
  • Based on this, it is possible to calculate a visibility rate for the popup and its conversion rate.  Without this, it is difficult to optimize the popups for more conversions.


Customer logged in (both the action during the session and a custom dimension to indicate they are logged in)

As an event, you can see the impact of logins on the checkout process. As a custom dimension, this helps you better determine the conversion rate for existing customers vs. new customers - the differences in conversion rates are often staggering between new and existing customers. Building a segment of this dimension can help surface opportunities to better improve your experience for new customers going through the cart process.

When you look at the segmented data, you’ll see the conversion rate is likely lower than you thought for new customers and conversion rates are propped up artificially by the number of existing customers making purchases.

Clicking between tabs on a product detail page

When content is relegated to tabs, does anyone notice it’s available? Use event tracking to measure if your tabs are effectively sharing the right information. My guess? They aren’t. Collect the data you need to make a better decision about your site layout by adding events each time a tab is clicked. Then build a custom report to see the percentage of users who actually click on your tabs. You’ll be surprised!

Track any in-store promotion pop-ups and call-outs

While you can also do this with enhanced e-commerce, event tracking for pop-ups viewed can be an easier dimension for ad hoc measurement of your store. How many visitors saw the promotion? How many clicked? Once you have this data, you can build the exact report you need

Concluding Thoughts

We would love to expand this list of the best eCommerce tracking events in Google Analytics & how they helped your e-commerce business. Here’s a quick recap of all the tracking tips by each expert:


Google Analytics Expert Tracking Tips
Paul Koks Add-to-Cart and Checkout Errors

Email Modal Appearances and Submits

Himanshu Sharma Importance of implementation of enhanced ecommerce for insight generation
Doug Hall Building the right segment
Julius Fedorovicius Form abandonment

Promotion tracking

Stéphane Hamel Autotrack library

Checkout process

Mikko Piippo Call To Action

Popup Tracking

Jeff Suaer Promotion pop-ups and call-outs

Clicking between tabs on a product detail page

Customer logged in

Not from an eCommerce company, write to us about the top events that you track for your digital business and how they are helping your business team & we will feature the best one in this blog with credit where it’s due!

Google Marketing Platform: DoubleClick Merges with Analytics360 Suite

Google Marketing Platform

Users are becoming more and more aware of how brands are communicating with them and what mechanism is used in utilizing their data for marketing and we now more than ever users want more control. With multiple channels and formats of marketing and advertising digitally, putting privacy first becomes the first priority for the brands.

To facilitate the same, on June 27, 2018, Google announced their new Google Marketing Platform (GMP) which unifies Google Analytics 360 Suite and DoubleClick giving rise to one of the most powerful digital marketing deliveries and measurement mechanism that we’ve ever seen.

Decoding the Google Marketing Platform

Image Source

DoubleClick Search is now Search Ads 360.

Bringing together the strongest features from their display advertising tools - DoubleClick Bid Manager, Campaign Manager, Studio and Audience 360 - have combined to give rise to Display & Video 360. This will now allow you to execute ad campaigns end-to-end in one place, creating efficiency in how you work and helping your teams do more together.

Google Analytics 360 Suite will continue to consist of Analytics 360, Data Studio, Optimize 360, Surveys 360 and Tag Manager 360 under its umbrella.

What does this mean for DoubleClick Users?

Not to worry. DoubleClick Campaign Manager and other DoubleClick products aren’t going anywhere right away. Google will gradually transition the users to Display & Video 360 as and when additional features become available.

How does this help the Analytics industry?

Historically, marketers have seen great results when they use ads and analytics technology together.

This upgrade will only equip us to do our jobs better by serving relevant ads to the right set of audiences and subsequently effectively measure the efforts and outcome of the same since Google Marketing Platform is built on the existing integrations between the Google Analytics 360 Suite and DoubleClick advertiser products.

While Google AdWords will be rebranded as Google Ads, it essentially stays the same in its functionality of delivering search and display ads across different Google platforms, and has nothing to do with the changes that DoubleClick is seeing with Google Marketing Platform.

What to expect in the near future?

Starting July 24, 2018, you will see the new Google Marketing Platform branding along with the new product names and logos in product UIs & Help Centers along with the Suite Home being renamed to Platform Home.

Google will be sharing more about Google Marketing Platform and Display & Video 360 at Google Marketing Live on July 10, 2018.

Doesn’t this sound exciting? Start preparing yourself and your team to plan, buy, measure and optimize digital media and customer experiences in one place.

How CRM Database & Google Analytics showing Discrepancy?

CRM data

CRM dataLately, we have observed that when trying to match Google Analytics numbers with that of CRM, they don’t match and sometimes the discrepancy is of up to 20%! To get to the root of it, we started looking at possible reasons for these inaccuracies and we’ve listed the same here along with an array of solutions that can be implemented to get rid of them. So let’s roll!
First, let’s see what could be the possible reasons.

1. Conversion Tracking Moment

In many cases, there is a difference in the way ‘conversion’ is recorded in Google Analytics and in a CRM. For example, CRM records a transaction first and Google Analytics records a transaction from the client’s side when Ajax response is returned as success. What if the Ajax response never reached the client?

2. Google Analytics has Filters

Google Analytics configuration has several filters like an Internal IP filter. So, make sure that when you’re comparing numbers, you actually take into consideration this fact because your CRM tends to show you everything but Google Analytics only has your user’s filtered data.

3. Excuse me, it’s JavaScript!

Google Analytics works on plain vanilla JavaScript code. It is very easy for JavaScript code to be broken by other erroneous scripts on the page. In such cases, the Google Analytics tracker cannot initialize itself and data recording stops completely.

4. Google Analytics code at the bottom of the page

In this scenario, it may happen that before Google Analytics records the transaction, the user may close the browser or navigate to other pages, hence resulting in a transaction mismatch between CRM and Google Analytics.

5. Exceeding Quota Limits

Google Analytics has a pre-defined limit of 500 hits per session. If you exceed this limit early, before the user converts, it is possible that the transaction may not get recorded in Google Analytics but your CRM records a transaction in such cases.

6. Not all Browsers are the same!

Google Analytics works well in browsers like Chrome, Mozilla, IE, etc. However, there are some browsers and browser versions in which Google Analytics simply does not load or has errors while sending the data. Such browsers and browser versions are a potential risk to your transaction data.

7. Adblock

Pro versions of plugins like Ad-block, also block Google Analytics calls, which results in absolutely no data tracking and thus leads to a discrepancy.

8. Don’t track me

If your website or some browser is providing an option of not tracking the user, it is possible that some users opt for these options because they want their privacy to be maintained.

Well, we might not be able to reduce the pain of discrepancy completely, however, now you know how to explain the difference to your boss!

Below, I’ve jotted down some solutions that’ll help you tackle the above-mentioned issues:

  • Create a segment in Google Analytics to identify if the 500 hits limit is exceeded or not. Use the condition: Include sessions where hits = 500 and use “User Explorer” report to analyze if this is the Quota Limit Exceeded case.
  • Use Measurement Protocol or Amazon CloudFront (own server) to track browser, version, conversion id, user id, etc. when the user converts and find out browser patterns from these that are not tracking the conversions. Research and test your Google Analytics code on such browsers and browser versions.
  • Implement JavaScript error tracking to know if there are cases where the Google Analytics object is not initialized and hence data is not tracked properly. Here’s a great article by Simo Ahava on this one.
  • Put Google Analytics code into its recommended positions such as “<head>” so that transaction recording is quick and as soon as the page loads.
  • Accept the data mismatch and use CRM as a conversion reporting tool. (The simplest method!) However, you’ll lose on the attributions part if users take more than one channel to convert for you.

Have you faced such discrepancy issues too? We’d love to know how you went about solving them. Do let us know by dropping a comment below.

Web Page Sequencing Analysis Using Google Analytics

Recently on a project, we were trying to implement the network path diagram and carry out an analysis with the website’s page sequence data to know if there exists a specific traversing pattern among visitors.

While there is a lot of visual representation available (such as Paditrack) of a sequence of pages visitor follows the real beauty is having a such sequence as row data to have them analyzed.

For example, if you know a specific visitor pattern is always observed before a visitor initiates the sale, it would be great to know that. If you know a specific content consumption results in visitors returning to the website the next day, it would be awesome for you.

By having data for sequences in raw format, you are aided with a tool that you can collect those data and eventually carry out such beautiful analysis.

We are using an anonymous visitor id for each visitor in one custom variable on the visitor level and set another custom variable on the page level to have the incremented counter value which is stored and accessed from the cookies.

Implementation:

  1. Download the script “Page Counter Script” from the JavaScript Resource section (PageCounter Script).
  2. Unzip the content and include the script on all the pages of your website.
  3. When you are done with the implementation on all pages of your website check with the implementation using “Omnibug” in Firefox or using the Developer tool in Google Chrome.
  4. Once you see the gif requests are made to the GA server and data would show under All Pages in Google Analytics.
  5. Don’t forget to create a different view to separate the page counter virtual Pageviews from the main view so that it does not affect the bounce rate.

Note: We have used one custom variable and virtual pageview as follows:

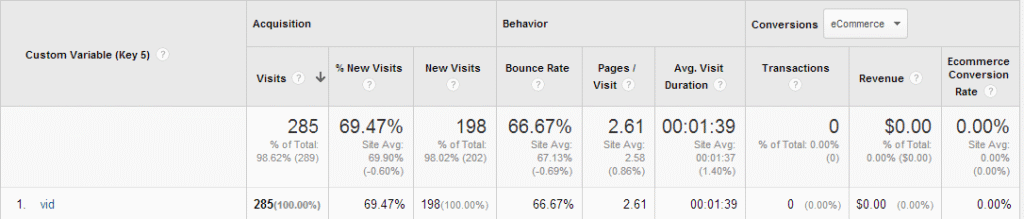
Custom Variable 5 Visitor Level Constant through the visitor-level cookie existence. Stores randomly generated anonymous visitor id
Virtual Pageview Page Level Page sequence counter stores page URL with sequence counter incremented by 1 on each visit of a page as a virtual pageview

How does it work?

  1. We initialize a visitor id in one custom variable which sets to visitor level upon first visit using the Visitor Id script and set a page counter cookie value to 1 and send it to GA using virtual pageview. You can download the Visitor Id script from the JavaScript Resource section (Visitor ID tracking). In our case “vid” is customVar5.
  2. Once the visitor browses through other pages in session; the page counter value is incremented by one and the value is submitted to GA using trackpageview or trackEvent call.
  3. On the next visit, the page counter cookie value resets to 1 and begins the new counter for the new session
  4. This page counter value and the page URL are sent to GA using trackpageview (Virtual pageview). Note: You can also use Events to send page counter data to GA using trackEvent.
  5. All the data can be extracted using GA API as mentioned below. Which can be used to represent the visual flow from a page to another page.

Google Analytics would show reports as follows:

Visitor Id Data:

Page Counter Data:


Note: it would show the above data only when using trackpageview. You can use event data for the calls made through trackevents.

Data extraction of the data collected:

Once the tracking is implemented on all pages and data is collected on the GA interface. You can use data query feed explorer from Google Analytics using GA API v3 or use our Excel plugin Data should be similar to the image below.

Reference:

  1. Visitor Id: Unique visitor id.
  2. Virtual pageview: Pageviews with the page URL and page sequence data.
  3. Visit Count: Visit count of a visitor.
Dimensions, Metrics, and Filters
Dimensions: ga:customVarValue5, ga:pagePath, ga:visitCount Note: Change the custom Variable number if you have changed while implementation
Metrics: ga:pageviews (Virtual pageview call to send page counter info to GA in the script)
or
ga:totalEvents (Event call to send page counter info to GA in the script)
Filter: ga:customVarName5== vid;ga:pagePath=@ /vp/pgc Note: if you have changed the custom variable names then please update here too.


How it is different from Page-Depth
Page Depth gives you a count of pages viewed by visitors in a session. Whereas Page Sequence gives you which pages a visitor visited in a session along with its sequence.

Benefits:

  • You can know how user follows through pages and can know the navigation trail easily.
  • You can find what are the pages which are important and makes users interact with your website
  • Helps you identify pages from where a user leaves your website if conversions are not happening. So that you can implement strategies to win your customers.

Want to implement this solution on your website and do the data analysis? Contact us

Anonymous Tracking of visitor using visitor id

Visitor Id reporting in Google Analytics

When a user visits your website and performs any activity involved with your website. i.e. viewing videos, purchasing products, requesting services that you may offer. Now in this competitive age it becomes necessary to keep up to the pace with the taste of your user base and constantly upgrading with your offerings. Using Google Analytics as a constant input always helps website owners to decide on the critical business needs, to grow or to reach to end user. Now if you can identify user’s behavior tagging them anonymously would give a detailed analysis which would give you additional advantage while fulfilling your user’s requirement.

For example, if an e-commerce owner would know that people from certain region prefer free-shipping and from other region they prefer using discount coupon codes and purchases more. While identifying such users would help website owner to create unique offers on his web store.

How to do anonymous tracking

Now we have come up with a small piece of JavaScript code that tags each visitor as a uniquely generated number and sets it into custom variable on visitor level and pushes it to Google Analytics. Once the data is collected in your Google Analytics profile. You can analyze these data for each user’s behavior, which would help you to create unique offerings from your website.

Solution

You can download the code “Visitor Id Tracking” from our JavaScript Resource section. Once you download the code you need to integrate it on your website using the instructions provided with it.

Note: This solution uses custom variable 1 on visitor level so make sure if you are already using custom variable on your site update the code accordingly to use available custom variable on your website.

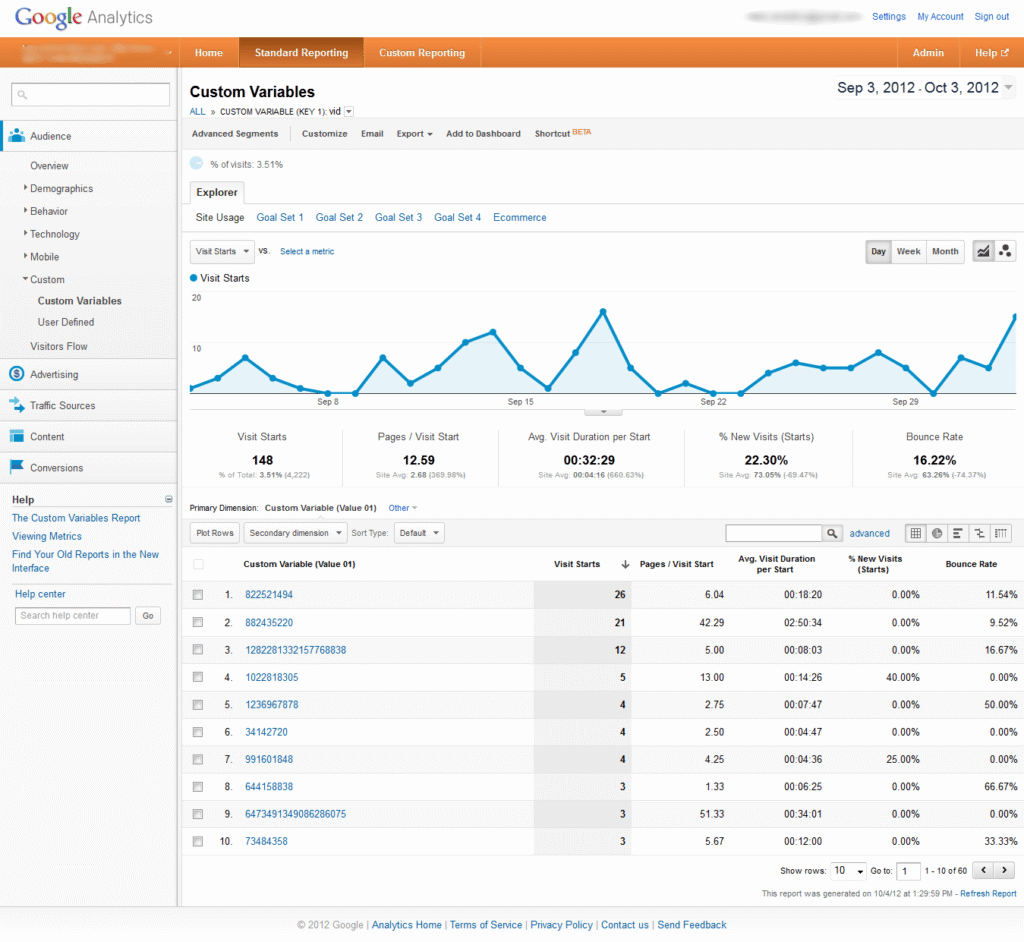
Once you have all the data collected you can view it in your GA interface like below:

Now you can either use GA interface to create different reports or extract data using GA API v3 and use the data for your next level of analysis.

Some use cases of implementation:

  • You can use this script to identify browsing behavior of your users.
  • You can know what kind of offerings works best on your e-commerce store and how individual user reacts to it.
  • You can create unique offers based on user’s behavior i.e. providing free shipping if you see constant drop after shipping calculations in checkout process.
  • Promote specific products for specific users.
  • Provide unique contents.

Want us to help you implement or analyze the data for your visitors. Contact us

How to use GA URL Query Strings & Parameters to track a Site’s User Behavior?

event action data

One of our client has an e-commerce store which sells mobile phones. We suggested to enable query parameter event tracking so that they can identify what brands of mobile visitors are looking for most.

For all websites which are having non-SEO friendly URLs or URLs which have query parameters to control the website’s content dynamically, it’s important to know how user is navigating through the site.

We can track such parameters with human friendly information in GA interface that can be used in many ways.

How we did it?

In the case of the mobile phone selling website, we uploaded a small javascript file which split query parameter string in array and we tracked required parameters with event tracking.

After we did it for our client, we decided to keep it open for all. Here’s how you can achieve it too:

How you can use it?
  1. You can download the script.
  2. You may need to modify the script for the parameter “name” in switch case to assign with appropriate assignment of “Event Category”, “Event Action”, and “Event Label” values. Additionally you may append multiple parameters in one category/action/label to include more than 3-4 parameters at once. Note: Appropriate group of category, action and label value will be needed for helpful GA reporting.
  3. Include the javascript after your asynchronous GA code and before the </head> tag of your pages.
  4. You’re done!!

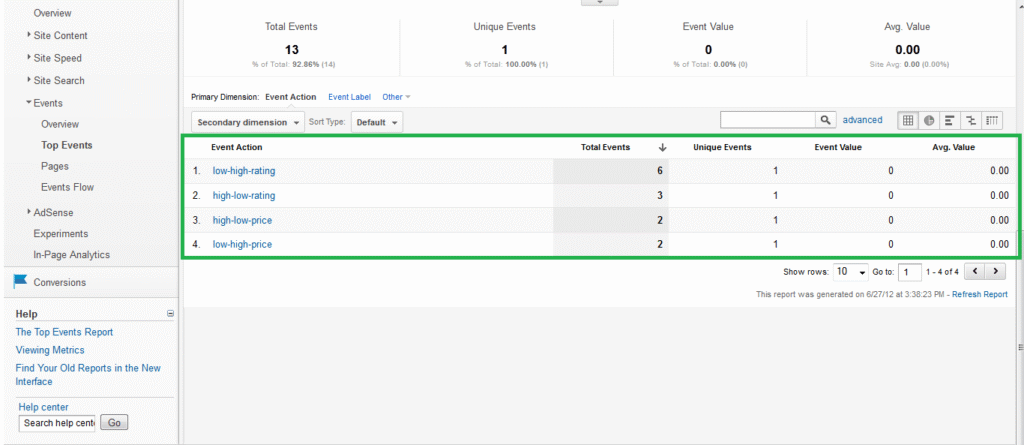
Here are some sample screenshots of the data collected in GA interface for a test on our client’s site.

URLs which were parsed with script are:

  1. products.html?category=mobile&sort=high-low-rating&type=os
  2. products.html?category=mobile&sort=low-high-rating&brand=samsung
  3. products.html?category=mobile&sort=high-low-rating&brand=sony


1. Event category data

2. Event Action Data

3. Event Label Data

With the help of additional enhancement in query parameter tracking, we were able to identify what kind of phones users are looking for. Additionally we got to know what brands and price range user is looking for over other phone categories.

Let us know in comments how this script helped you.


Google Analytics Services to Improve Conversion Rates

Since the creation of Webtrends in 1993, analytics has becamean integral part of websites. In 2005, Google launched Google Analytics. Since then, there have been prolific changes in the way we analyze data. Nowadays, you can’t imagine a website without analytics.

The Power of Data

Collecting more and more data is the key to keep improving your e-business. More data gives more insights, more insights leads to more detailed optimization, and thus more conversions. It’s because of tons of in-depth data why Facebook is earning millions of advertising revenue by offering great level of personalization to it’s advertisers.

Importance of Analytics

Today, the depth of analytics has gone far beyond visits and conversion rates.Google Analytics now gives great insights that can be a fuel to keep optimizing the customer experience and conversion rates.
Below are some easy reports available in Google Analytics, which are very important in order to create a list of actions to optimize the customer experience.

Metrics from Google Analytics which can help improve conversion rates:

Conversion reports

All reports in section are important.

What to check for:Have a Regular observation. Especially, check E-commerce reports because that’s where the revenue is coming from.


Action to be taken: With product performance report, you can promote hot selling products on your home page and even in advertising campaigns. You can even bundle other products with highest selling products to upsell. If you know best times for maximum purchases, you can pull off discounts during that time, or provide free shipping during the time of fewer purchases. A funnel visualization report is the most important report for optimization. It’s described below.

Funnel visualization

This reports come under conversion reports as mentioned above.

A funnel will tell you which pages you need to optimize to improve your conversion rates. E.g., a 30% exit from payment page is an alarm that something is wrong on that page.

What to check for: Check where people are dropping out more than at a normal rate in any part of the funnel.


Action to be taken: Optimize the problem pages for better user engagement. May be you are not carrying an offer like “free shipping” through out the shopping process which might lose users’ trust. Or, asking for too much information on the payment page is making the user insecure and he’s hopping on a competitor’s website. A thorough review of information architecture of the entire process is required here. It can also be a case that some people are landing somewhere in between the funnel, through an advertising campaign or a referral. It might happen that these users might not find an offer on the Landing page, which they saw in the ad.

Site speed

SPEED is the king. The increase or decrease in the page load speed will have a direct impact on visits. Keep observing this report. Also observe high traffic pages for load times.

What to check for:Have a benchmark load time, and see if your site is maintaining it.


Action to be taken:When the speed exceeds more than expected load time, it’s time to see recent changes made in the design or code. Sometimes, a small code for an advertising campaign will load heavy content from its server, which might slow your site down. Use tools to check the site speed and optimize the content it reaches a limit you’ve set.

Bounce rates

The bounce rate has a direct relation to usability.Users do not get what they were expecting on the page.

What to check for:Look for pages with higher than normal bounce rate to start with.


Action to be taken:Study all the sources of visits on those pages. E.g. PPC. May be users are not able to find on your page what they saw in the end. Observe the relation between keywords searched, your ad content and the landing page. The communication scent should be the same as initiated in the ad. E.g., If you are showing “50% discount” in the ad, then it must be followed on the landing page.

Exit rate

There an be few possible reasons why someone will exit from your page, (not considering standalone pages like “About us”, but the page which are part of a process. i.e. Purchase)

  • They didn’t find the relation between the current page and the previous page.
  • They are comparing your website with another. May be they observed that you are charging very high shipping rates for a product, which might be available for free shipping.

What to check for:Find pages which have higher exit rates.


Action to be taken:Check all pages that send traffic to “higher exit rate pages”

In-page analytics

Not exactly, but it’s closer to heat maps. In-page analytics tells you what’s the user really interested in.

What to check for:Check top clicked links


Action to be taken:Are those links relevant to the activity you want your users to take? E.g., you might find out people clicking a lot on “About us”. That means they are not clear what does your company do. In that case, making the value proposition more clearly on home page would make more people clear about what’s in it for them. They’ll directly proceed to the sections they are interested in, which will eventually decrease bounces and increase conversion rates.

Bonus:

Scroll tracking script

Apart from the reports mentioned above, there’s a scroll tracking script, which we (Tatvic) have written in-house. It’s a unique script made by us (Tatvic), which checks how many people scrolled down.

Action to be taken:Having this script on a home page or a product page would tell you how many people are interested in knowing more about what you offer.

At the end, numbers matter
We use Analytics numbers to derive insights, optimize the customer experience based on them, and monitor the numbers. And we do it again, again. At the end, we want our customers to be happy, buy more, and buy again. The key is, keep optimizing, and make the experience better.

Scroll Tracking Implementation for Async Google Analytics Snippet

Event category of scroll tracking

We’re building websites with the prospect to provide essential information to visitors in the form of content i.e. videos, facts, statics, and many more, etc with the intention of converting that visitor either to buy something from the website or to subscribe to the newsletter.

Sometimes what happens is that we aren’t aware of the content consumption capacity of visitors. Regardless we provide all the avail content to visitors on a single page then It becomes too long a page with 3 -4 scrolls.

Now here the problem arises either how to get information about visitor’s content engagement or how visitors engage with the page that has 2 -3 scroll-long content. This analysis is mandatory to get an insight into the content engagement of visitors or how visitors look at the content in the 2nd or 3rd fold of the page.

With the help of scroll tracking implementation for google analytics, based on that analysis website owners can re-organize content placement to increase content engagement of the website.

Scroll Tracking Implementation for Google Analytics

I have developed a jquery based script that would help to identify % page viewed, % page scroll, and the page fold user is in.

Instructions to use:

  1. Please download scrolltracking.js
  2. Include the code block as shown below.
    <!-- your default google analytics tracking code -->
    <script type="text/javascript">
    var _gaq = _gaq || [];
    _gaq.push(['_setAccount', 'UA-XXXXXXX-X']); //replace your profile id
    _gaq.push(['_trackPageview']);
    (function() {
    var ga = document.createElement('script'); ga.type = 'text/javascript'; ga.async = true;
    ga.src = ('https:' == document.location.protocol ? 'https://ssl' : 'http://www') + '.google-analytics.com/ga.js';
    var s = document.getElementsByTagName('script')[0]; s.parentNode.insertBefore(ga, s);
    })();
    </script>
    
    <!-- include the jquery library reference -->
    <script type="text/javascript" src="http://ajax.googleapis.com/ajax/libs/jquery/1.3.2/jquery.min.js"></script>
    
    <!-- include scrollscript.js reference -->
    <script type="text/javascript" language="javascript" src="scrolltracking.js" ></script>

See it in action:

  1. Scroll tracking as Event Category

    Event category of scroll tracking

  2. pv|ps|pf as Event Action

    Event action of scroll tracking

  3. Event Values

    Event value of scroll tracking

Scrolltracking.js would attach a function to scroll changes on the document. So whenever the user scrolls down it’ll collect the following values as “pv|ps|pf” with a non-interactive flag.

  • pv - maximum % page viewed by the user.
  • ps - maximum % page scrolled by user.
  • pf - maximum page fold user viewed.

Here all the values measured and tracked in GA would be the maximum value of %page viewed, %page scrolled and page fold user was in. So we can identify how much content is viewed by users on a given page. If a user lands to page and goes to another page without scrolling. It’ll track default values “X|0|1” in GA where “X” is % page viewed (user viewed some portion) and 0% page scroll and 1 as page fold.

Note:

  • This script works with jQuery versions greater than 1.3.2 and tested with Chrome, firefox, internet explorer 8
  • You can exclude information if you don’t want to track any of the values pv (% page viewed), ps (% page scrolled), or pf (page fold) - You’ll need to update the script.
Bot Icon
Bot Icon

Tatvic Bot

Explore About Tatvic and Services