
We are all witnessing the data explosion: social media data, system data, CRM data, and lately, tons of web data! Google Analytics 360 produces a humongous amount of data which undergoes evaluation for a variety of reasons. For example, to optimize costs and benefits, predict future events, and identify unexpected campaign traffic, server outages, crashes, and code breakdowns on certain web pages.
Solutions to all these problems are already defined and easily available. Today, I want to talk about the challenge of detecting the “unknown”, i.e. an anomaly – an event that is not a part of the system’s normal pattern.
Define Anomaly Detection:
Anomaly Detection is the process of finding patterns in data that do not conform to a model of “normal” behaviour. Detecting such deviations from expected behaviour in temporal data is very crucial for ensuring the normal operations of the system. Identifying the right set of anomaly triggers can help in taking timely corrective actions.
In each case, it is important to characterize what is normal, what is deviant or anomalous and how significant is the anomaly. This characterization is straightforward for systems where the behaviour can be specified using simple mathematical models – for example, the output of a Gaussian distribution with a known mean and standard deviation.
However, the most interesting real-world systems have complex behaviours over time. It is necessary to characterize the normal state of the system by observing data over a period of time and use this characterization as a baseline to flag anomalous behaviour, if any.
Anomaly Detection Method
Machine learning is useful to learn the characteristics of the system from observed data. Common anomaly detection methods on time series data learn the parameters of the data distribution in windows over time and identify anomalies as data points that have a low probability of being generated from that distribution.
Another class of methods include sequential hypothesis tests like cumulative sum (CUSUM) charts, sequential probability ratio test (SPRT) etc., which can identify certain types of changes in the distributions of real-time data. All these methods use some predefined thresholds to alert to changes in the distributions of time series data.
At their core, all methods test if the sequence of values in a time series is consistent to have been generated from an i.i.d (independent and identically distributed) process.
This approach becomes infeasible and impractical for environments and infrastructures which are complex and of extremely large scale. As the complexity increases, fixed thresholds can’t adapt to the volume of data changing over time.
At Tatvic, we define anomaly detection as the identification of data points which deviate from normal and expected behaviour. For example, in our system, we use historical data to construct a quantitative representation of data distribution exhibited by each metric being monitored. Real-time data points are compared against these quantitative representations and are assigned a score. A decision is made on whether the real-time data point is an anomaly or not, based on a threshold we derive from recent observations of the data. One of the key advantages of this approach is that the thresholds are not static, but rather, evolve with data.
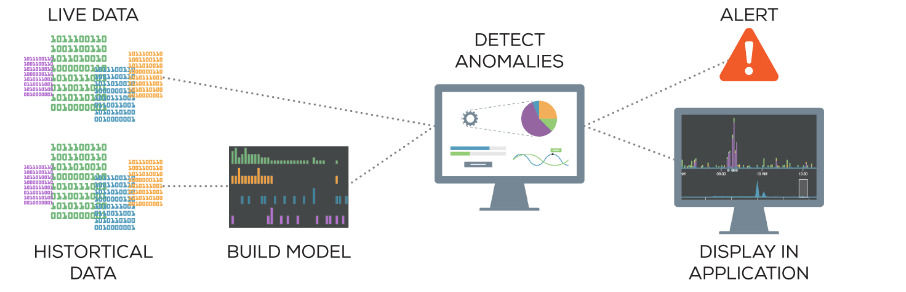
Let me simplify further with an example of a website traffic data pattern. Tatvic’s solution starts with collecting the website’s behavioural data. Three primary components of trend, namely fixed trends, cyclical trends, and seasonal data are measured individually and aggregated. The system collects behavioural and conversion data with Google Analytics 360 and uses the Real Time Management APIs to export relevant metrics into a separate database. Then, the algorithm looks for unexpected changes in the data and sends automated real-time alerts to concerned users using an SMS API and email server.
Some of the meticulously tracked metrics could be online-form completion rates, goal conversion rates, and page-loading time for specific browsers and operating systems.
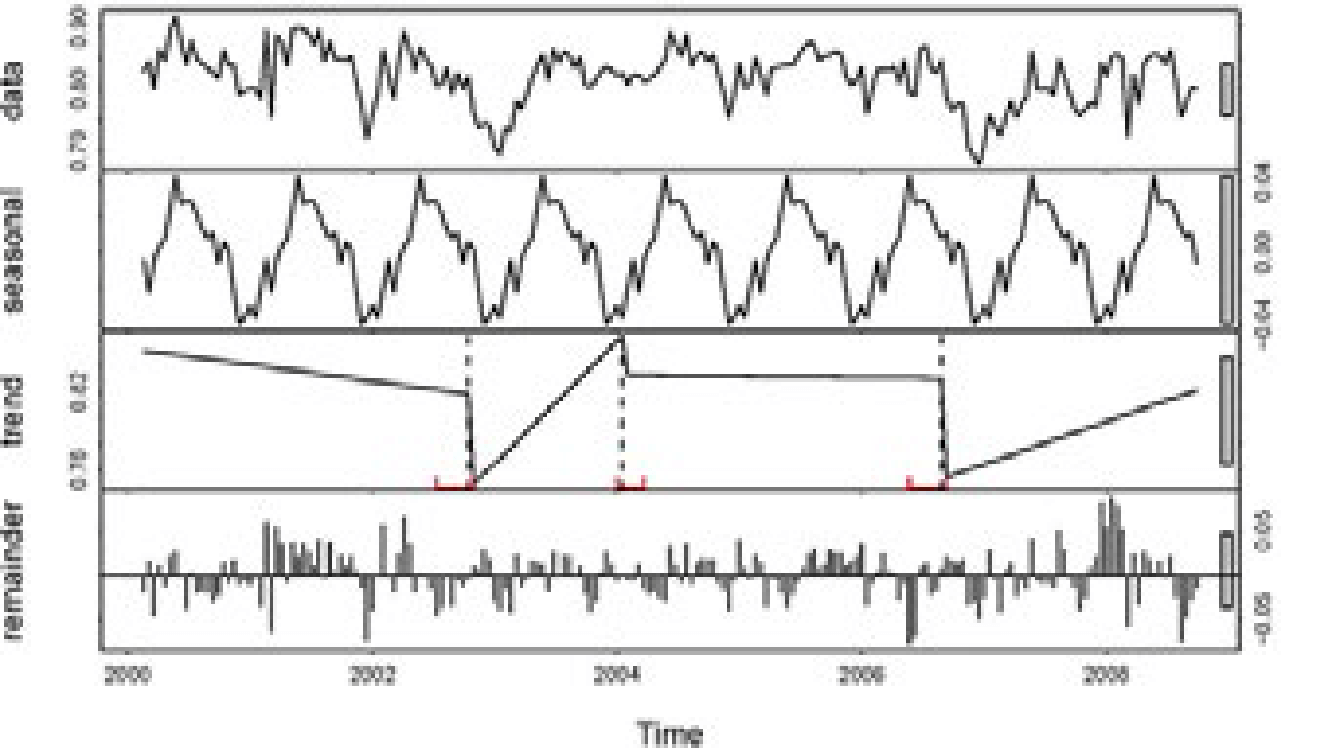
This solution is built using R – a popular, robust and free programming language – for statistical computing and visualization. Google Analytics 360 data can be exported into R for advanced analysis through the RGoogleAnalytics Library. With this, Tatvic can decouple data between trends and seasonality as shown below.
Anomaly Detection Case Study!
Magicbricks is India’s top high-end property portal. The website caters to a global market with its unique services and novel online features for both- buyers and sellers. Given their commitment to user experience and performance across their site’s global operations, they needed a real-time solution to monitor and optimize against their key digital KPIs.
Tatvic helped the company to develop a way to reduce website downtime and promptly alert management when outages would occur. Using our real-time anomaly alerts platform, the company could clearly see variances in KPIs and move quickly to troubleshoot and fix them. One day, the page leads generated reduced below the threshold limit and this triggered alerts and an email was immediately sent to the relevant team to take corrective steps on the same day; otherwise, probably a substantial chunk of leads would have been lost.
Result: 70% faster response time
The automated SMS alert system is used to alert outages, determine severity, and provide real-time performance updates to senior and middle managers throughout Magicbricks. Today, the entire Magicbricks team can make the most of these real-time insights to keep the site up and running ― and earning more every day.
The full story of anomaly detection for Magicbricks can be found on the Google Analytics blog here.
Closing Thoughts
Run the anomaly detection systems on data and use the results to further fine-tune your model; that’s how your model will improve with machine learning.
For more information on Anomaly detection, feel free to contact us or drop a message in the comment section below. We will be glad to assist you!