Hello There!

Lorem ipsum dolor sit amet, consectetur adipiscing elit,

 About tatvic

Tatvic, a Google Premier Partner, empowers industry leaders with end-to-end Data & Marketing Analytics, leveraging Cloud, Analytics, Maps, and AI/ML for data-driven insights and future-proof digital growth.

Google Analytics 4: Enhanced Ecommerce Business Guide

Ecommerce is one of the most promising industries when it comes to digital presence. Even though you may already have basic analytics reports available, how do you know who your valuable customers are? How do you parallelize your marketing efforts to increase profits and ROAS?

With a lot of analytics intelligence and machine learning algorithms, Google Analytics 4 (GA4) provides everything that the eCommerce industry is looking for to increase its customer base and improve its lifetime value.

GA4 is constantly evolving and there are quite a few features already which can transform your eCommerce business. Let us go through them together.

1. True conversion credits across your marketing channels:

Let’s say, a user performs the following journey on your website:

Which channel would you attribute your revenue to? Selecting an attribution model specific to your business goals is, therefore, helpful for you to understand the effectiveness of each channel or campaign.

By default, Google Analytics 3 (Universal Analytics) was based on the last non-direct click attribution model and marketers could only use multi-channel funnel reports to view reporting for various touchpoints. This might not be the best choice for certain business types and models. With GA4, you have the option to choose the attribution model that suits your business which will be then reflected in all the reports. 

This will enable you to measure the true success of your campaigns and cut the costs of underperforming campaigns.

2. Effectively retarget high-intent customers:

With GA4, you can target your customers smartly and easily using predictive remarketing. You can create custom audiences based on user behavior and use predictive audiences like ‘Users who are likely to purchase in the next 7 days, ‘Users who are likely to make their first purchase in the next 7 days, etc. Predictive audiences are automatically generated through GA4’s machine-learning capabilities.

You can build an audience by combining certain event data with the GA4-provided Predictive Metrics for advanced retargeting. For example, you can create an event in GA4 to target users who browsed your website, and added products to the cart but never performed a transaction with an additional condition of the probability of those users making purchases in the next 7 days.

3. Unified journey of users on the App & Web:

With a minimal implementation effort of setting up a user id and selecting the appropriate identity option in the GA4 property, you are ready to unify your user journey across platforms.

Let us take an example of a user who visits your website and performs the following actions:

  • Landed on your website through a promotional ad (Brand discovery)
  • Browsed some products (Interest & Desire)
  • Completed his/her first transaction on the website (Conversion)
  • Downloaded your app
  • Made all future purchases on the app (Retention)

The above journey will be captured under the same user in GA4 reports giving you a unified understanding of customer interaction as well as the correct set of audiences for any remarketing. This will ultimately increase your chances of conversion.

4. Measure the most followed user journey:

Let us consider 3 flows that users can perform on your website.

GA4’s Path Exploration report is an interactive diagram where you can play around with your data and the performance of the website by clicking on nodes and adding filters and segments. You can also analyze the results for website redesigning and user flow enhancements. For example, the following path shows that the view_promotions event is firing but the next page is still the Home page conveying that users are not really clicking any of the promotional offers. This is a clear indication that some changes are needed in the way promotions are displayed or interacted with.

5. Addressing user drop-offs for enhanced website experience:

To investigate drop-off rates from various steps of the user journey, you can use a funnel exploration report. Add the funnel steps for the following events :

  • Session start
  • Product category page visitors
  • Product detail page visitors
  • Added product to cart
  • Checkout page visitors
  • Completed purchase.

If you see a very high drop-off rate from the add-to-cart step, for example, then you might want to evaluate for any error correction or design changes leading to a higher step completion rate and ultimately the conversions.

6. Strategize your marketing with revenue prediction:

Predicting future revenues generated by a customer is an important e-commerce task. Revenue forecasts will help the marketers of your business to redefine marketing and promotional strategies.

Questions like ‘What is the expected revenue that will be generated within the next 28 days from a certain user who was active on your website in the last 28 days ?’ are now easy to answer with GA4. You can have reports for revenue prediction and can also create audiences for remarketing based on these metrics.

7. Optimize content based on user engagement

GA4 has introduced a new metric - Average engagement time calculating the amount of time (in seconds) users were interacting with your website (scrolling, clicking, browsing, etc.).

Let’s say you have recently launched a new feature on your website and would like to know the customer’s response on that functionality. GA4’s user engagement metric will help you analyze how engaged/interactive users are with the feature. You might also want to look at the average engagement rate of your channels/touchpoints. This would give you an opportunity to optimize your content or plan for an alternative approach.

Apart from the advanced functionalities and analysis mentioned above, there are a number of other reports that would prove to be beneficial for the eCommerce industry. With the rapid advancement in analytics, GA4 is the perfect shift for you to be future-ready.

Wondering if you really want to invest time in this migration? Here is our blog post that can help you make that decision. To start with, we recommend a parallel setup for marketers who want to keep using Universal Analytics. As an added advantage you can explore & utilize all advanced functionalities of GA4 to get deeper insights into your customers before you are comfortable making a complete transition.

Google Analytics 4 Migration. Worth the Effort?

Google has announced the new, revamped version of Google Analytics (aka. GA4). The new version is with integral machine learning models, AI-based predictive data, and cross-device measurement capabilities. Any data-driven marketing team will soon start relying heavily on it. As Google Analytics 4 is the answer to increased challenges in data privacy and tracking user behavior in a cookie-free world.

This enhanced version of the tool has come with some exciting changes in all 3 important aspects of analytics:

  1. Collect & Measure with the event-based data model that can easily combine your app and web data addressing any internal silos or data management issues
  2. Analyze for insights with the machine learning capabilities embedded at the core of GA4 giving you access to predictive metrics & automated insights
  3. Insights activation through direct integrations with other platforms enabling unified audience export & conversion reporting

1. COLLECT & MEASURE

a. Flexible data collection

With GA4 you can now measure business performance with flexible data collection and measurement solutions. Some of the  key highlights include:
  • Tagging solutions to streamline implementation across web and app, including the new Consent Mode
  • Multiple privacy settings to meet user privacy requirements and regulations including control over data collection, retention, and removal
  • New event-based data model resulting in granular tracking options and  consistency across platforms & applications
  • Automatically collected events to get you started with commonly tracked actions that users take on your application

b. Unified analytics for deeper user journey insights

Analyzing your website and app data in one reporting environment, without manual effort is one of the key benefits of GA4.
  • Cross-platform gives you an overview of the complete user journey from start to end in a single reporting environment. This is possible without creating a separate user-id view
  • Data is now more accurate since it is based on first-party cookies & Google signals
  • Helps break down data silos and track the performance of cross-platform campaigns. This depicts user-centric behavior and conversions.

Below is an example of Cross-Device Path Conversion reporting in GA4

2. ANALYZE FOR INSIGHTS

a. Multiple analysis techniques for deeper and intelligent insights

Section ‘Explore’ of GA4 is available to all users, which gives access to data & analytical techniques that are not available in the standard reports.
  • Different charts like bar charts, pie charts, line charts are available in the free-form exploration reports. These result in easier access to data points and insights
  • Options to deep-dive with access to individual user activities and segment overlap with Cohort and Pathing exploration
  • Access to Predictive metrics like Purchase & Churn Probability that can be used with User Lifetime reports

Below is one example of Cohort reporting in GA4

b. Built-in analytics intelligence using machine learning

The new intelligence built with GA4 will surface deeper insights automatically.  There is no need to configure them explicitly.
  • Detects unusual changes or trends in data and sends an automated notification to users for taking actions
  • Looks for anomalies with the help of historical data over single or multiple metrics and/or segments
  • Is able to identify user segments contributing to the anomalous behavior
  • Automated attribution insights based on the attribution reports

Below is an example of ML-driven insights within the GA4 interface

c. Integrated data across devices and teams for effective business decisions

In organizations, data is usually spread across different teams, tools, and platforms. This makes it difficult for marketers or analysts to make effective business decisions. GA4 helps break down the data silos and unlock insights. 
  • Measurement Protocol for both web and app to capture data from offline systems like kiosk and POS
  • DV360 integration for standard Google Analytics 4 makes cross-channel reports & audiences more meaningful 
  • Youtube clicks and engaged views are now available as a part of the user journey. This gives access to Youtube campaign performance against all other channels

3. INSIGHTS ACTIVATION

a. BigQuery Linking for unsampled data

Users can now export all their raw data, and unsampled events to BigQuery to perform advanced analysis. In the previous versions, Google Analytics 360 was required. 
  • New streaming export that makes data available within seconds 
  • Raw-level combined data from the app and web can now open new activation opportunities. 
  • Generate high-value audience segments and perform advanced analyses with SQL-like query language 

b. Build Advanced Audiences for re/targeting 

With the possibility of directly exporting audiences to different media tools like Google Ads and DV360, Google Analytics already had an edge over other analytics tools. Now with GA4,  it is also possible to surface complex segmentation of users and target/retarget them expecting high-value performance.
  • Scope-based and sequential conditions based audiences are similar to Universal Analytics
  • Additionally, build time-windowed audiences for a metric condition to be true for a specific number of days
  • Static & dynamic evaluation for the condition to be true when users meet them else it is false

A screenshot from the audience builder feature in GA4

To ensure that your business has the most detailed, comprehensive, and accurate data for your business decisions, migrating to GA4 is a no-brainer. This will provide valuable insights,  bring you the latest advances in reporting, and will help you understand the significant changes. This would also enable you to understand how your users are engaging with your business based on devices, platforms, and content. Here is a detailed infographic mapping between UA and GA4 features for your reference.
Even if you decide not to actively use Google Analytics 4 right now, creating a GA4 property in parallel will have you collect enough historical data by the time Google Analytics 4 evolves further and you are completely ready to switch. However, any new GA account will only be starting with GA4. Even for existing users, eventually, the existing property will be deprecated and removed.

conversion optimization services product conversion rate ecommerce conversion analysis

This post aims to develop an understanding of how to calculate product-specific conversion rates and discuss the potential analysis & insights that can be generated from it.

Quite often the business problems or questions that most e-commerce websites encounter are one of the following:

  1. How much product to stock?
  2. Which products are fast-moving? 
  3. How can I move some of the products quickly?
  4. How to measure how many views different products have received?
  5. Are the product views turning into transactions & revenue? What actions can I take based on such data?

What is the product conversion rate?

There are many ways to define what we can call the product conversion rate. For example, you can check the number of transactions for any given product divided by the number of visits to that specific product. Moreover, you can also use the quantity to no. of visits ratio to calculate the product conversion rate.

Based on the product conversion rate, an automobile e-commerce website was able to update its recommendations section, which in turn led to a 20% increase in transactions.

For our understanding, we will use the ratio of quantity sold to the no. of visits for the different products as a product conversion rate.

Why product conversion rate?

There are many ways to define what we can call the product conversion rate. For example, you can check the number of transactions for any given product divided by the number of visits to that specific product. Moreover, you can also use the quantity to no. of visits ratio to calculate the product conversion rate.

Based on the product conversion rate, an automobile e-commerce website was able to update its recommendations section, which in turn led to a 20% increase in transactions.

For our understanding, we will use the ratio of quantity sold to the no. of visits for the different products as a product conversion rate.

How to get data from Google Analytics?

There are two approaches that can be used for obtaining the data for product views:

Approach 1: Ecommerce / Enhanced Ecommerce:-

Here is the syntax that you can use to generate product views statistic in event tracking:

  1. Event Category: Enhanced Ecommerce
  2. Event Action: Product Detail View
  3. Event Label: {{current page path}}

This needs to fire on all your product pages in Google Analytics.

As a result of this, you will be able to create a custom report with “Product” as the dimension, and “Product Detail Views” as the metric.

Report Image Source: Google Merchandise Store

Approach 2: Custom Events Implementation:-

You can implement the following data layer snippet to pass an event every time a product detail page is loaded.

  1. Event Category: Product Detail View
  2. Event Action: {{Product Name}}
  3. Event Label: {{current page path}}

Based on this implementation, you will get the Product Names in your event tracking report. You will not need to go through the process of implementing E-Commerce tracking on your website, and will still be able to get unique product views as well as total product views of each product.

By putting this data together, here is what you can get as an output for different products. Please note that in the third column you can create conversion rates for your different products.

Product Name (based on Event Action) Unique Views (based on Unique Events) Quantity Sold Product Conversion Rate Product Revenue

Google Utility BackPack

260

9 3.46% 2231

Chrome Dino Collectible Figurines

658

29 4.41%

1840

Google Black Eco Zip Hoodie

713

27 3.79%

1721

Google Incognito Zip Pack

322

35 10.87% 1611

Google Eco Tee Black

133

15 11.28%

1364

Google Incognito Techpack V2

413

15 3.63% 1160

Google Campus Unisex Zip Hoodie

142 17 11.97% 1119
Chrome Dino Marine Layer Tee

300

12 4.00% 1079
Noogler Android Figure 250 20 8.00%

1872

Google Cloud Unisex Zip Hoodie 129 24 18.60%

1654

Some of the products have a high conversion rate as shown in highlighted portion. These are your winners.

Plot this conversion data with the product’s revenue and you will be able to analyze various aspects of your product performance indicators, including:

  • Know whether high converting products are getting sold or not
  • Use the advanced segments to calculate the product conversion rate for different traffic sources
  • Figure out low-converting products, reduce them from your stocks and save money from the warehouse!

Ecommerce Predictive Analytics Transformation Guide

When the COVID-19 pandemic broke out, much of the world moved online, accelerating a digital transformation that has been underway for decades. From a buzzword to a current-day reality, e-commerce in India has been experiencing remarkable growth, successfully changing the way people transact. People today can shop literally everywhere within minutes, be it their workstations or homes, and most importantly, at any time of the day at their leisure.

eCommerce as an industry is taking a huge evolutionary leap. We’ve come to a point where digitally native companies are working around voice commerce, partnering with local businesses on exclusive ads, and most of all testing a mix of Virtual and Augmented Reality giving impactful experiences. 

How can eCommerce Analytics help here? 

Considering the current state of the eCommerce Industry, Analytics can help in keeping an eye on the value generated by business and business growth. There are tremendous ways through which eCommerce Analytics can help in increasing the user base by targeting the specific audience to increase the conversion rate like:

  • Marketing analytics
  • Segmentation Analysis
  • Predictive Analytics

What are the capabilities of Predictive Analytics?

Predictive Analytics provides e-commerce businesses with a deeper understanding of customer habits and preferences. When coupled with advanced Machine Learning capabilities, it can correlate data from different sources to create personalized recommendations for particular customers or segments.

What problems can be addressed through Predictive Analytics?

  • How to give each customer the best shopping experience possible
  • What products are in demand currently- and are likely to be in demand in future
  • How to Create Customized Marketing Messages
  • Who is the right set of people to remarket to?
  • How much to spend on remarketing channels?
  • What would be the right medium to invest in?
  • Users who are likely to buy a particular product 
  • Users who are likely to purchase a product twice a month
  • Users who are likely to use credit as a mode of payment
  • Users who are likely to add the product to wishlist

How can Tatvic help in Predictive Analytics?

PredictN is a machine learning model that generates an Audience Segment (Qualified Visitors) who carry the probability of getting converted as a customer within the next ‘n’ days. 

How does it work?

For more details visit here

Why should the eCommerce industry do Predictive analysis?

The internet, custom-made Apps, and Mobiles have undoubtedly changed the way we buy whether it is food, clothing, automobiles, etc. Due to the ease of availability options at finger tips, people have moved from Retail to Online, as it offers more convenience and offers. 

To understand the data and make business-centric decisions, many companies are looking forward to cross-sell and up-sell their products and services to their customers by analyzing the data and targeting specific sets of audiences for remarketing. eCommerce analysis will help the companies gain an edge over their competitors, as they will know exactly whom to target to get maximum conversions, and what are the trends/products/services likely to create a boom in the future. Below mentioned are some of the techniques common techniques that companies use:

Social Selling

Social commerce offers a much more engaging experience, as the majority of the people, are socially active on the various social media platforms. People love the way in which products are displayed with short videos to highlight the central message. This way of social nudge helps drive instant sales.


Dynamic Pricing for Optimal Sales and Profit

To stand out in this highly-competitive environment, eCommerce companies need to monitor their competitors’ prices, analyze seasonal and historical demand, and react to These insights in nearly real-time. With the historical data of supply and demand, prediction can be more accurate with the needs of essential products geographically.


Subscription-Based Business Models

Subscription-based eCommerce is booming and has recently gained a lot of traction with the ease of automated direct debit on the monthly basis and many more. The subscription model holds the power to lure in new customers through Word of Mouth and have high conversion rates.


Real-time conversation using Chatbot

Consumers have multiple queries while buying the product online and support executives may not be available all the time. With the help of AI Chatbots, the problem can be resolved. Chatbots are widely used by many eCommerce companies to provide real-time support for customers.


Conclusion

The future of eCommerce is not just limited to this, there is a way more to come. But summarizing the bit, analytics would also be evolving and finding new capabilities to generate insights on the same.


5 Google Analytics Reports that are Helping eCommerce Merchants Increase Conversions

For eCommerce business, the most important business objective is to increase the conversion/User spends and ROI of the business. To do that it is of utmost importance that you analyse your data and make data-driven decisions because you just don’t want to waste your hard-earned traffic on a plethora of multivariate tests that just won’t contribute to increasing your conversions.
After all, you’ve spent a lot of time and resources growing your business.

But the question might arise, How do I get data and analyse it to make business decisions?

Considering you are already a Google Analytics user, It comes with a lot of default reports that you can use to analyse and make data-driven decisions.

If you are running an eCommerce business, then a big congratulations!

Because Google Analytics comes up with a dedicated section designed for eCommerce clients which provides you with all kinds of eCommerce reports that you have ever thought of. It includes conversion funnels starting from user acquisition to conversion action. Using this you can analyse all the data points which you might ever need. Check those reports under the Conversions → Ecommerce section.

This analysis can lead you to pinpoint areas that are not working too well. Going deep inside will reveal the most likely problems. This will narrow down the changes and improvements you can make with your eCommerce optimisation strategy.

Sounds easy? It is never that easy.

Don’t worry! We are here to help you.

There are 5 most important default reports, that you can never miss on to dig down further and identify the data points like drop off of the users in their journey towards the final conversion, The performance of an individual product or product categories into the conversion or the source/Medium or Campaign that are driving the most conversions and much more.

Check the analysis that you can make out of those reports and how to use that as follows:

Shopping Behaviour Report:

Access: Conversions → Ecommerce → Shopping Behavior

First of all, having overall knowledge of the key touchpoints of the user journey is very important in order to identify the gaps and potential areas of improvement to increase the conversion rate. This identification starts with analyzing the journey of users and key drop-off points while carrying the users from the acquisition stage to the final conversion stage.

The Shopping Behaviour report plays a key role in identifying the key touchpoint from where the user abandons the website before converting. The report covers journeys starting from total user visits to product detail page visits and at last transacting on the website.

In the above screenshot, you can see that the maximum number of drop-offs is happening between the product detail page and add to cart stage, out of which the mobile device is showing the highest drop-off.

Now, the questions still remain, apart from overall website drop-offs, what else can this report answer. Well, don’t worry. The Shopping Behaviour report can also help us with the following questions.

  • Which device is performing worst on which step?
  • Which channel drives visitors to the first step, but not much further?
  • Do we have any browser issues at a certain step?

Once these pieces of information are available, you can create remarketing audiences to increase conversions which act as the first step for increasing conversions.

Product Performance Report

Access: Conversions -> Ecommerce -> Product Performance

While analyzing the touchpoints from where users tend to drop off from the website, it is very important to get the information of the product level granularity. In order to increase conversion rate, it is necessary to optimize the eCommerce store by measuring the performance of products viewed and purchased, product list views visited the most by the users, along with the optimization of the website experience, so that users get the most out of each journey done on the website.

In the above screenshot, as you can see that only a handful of the products are generating the maximum amount of revenue. It’s great news that we are aware of the top-performing products, it is also important to be aware of the low performing products and by checking the Cart-to-Detail Rate and Buy-to-Detail rate columns you can see which products are likely to sell well if promoted.

By analyzing these reports, you can devise further campaigns to show the desired products to users to increase the conversion rate.

Funnel Visualization Report

Access: Conversions -> Goals -> Funnel Visualization

Users go through a journey before buying something from your store and converting. This process, or path, can be visualised like a funnel. As there are many steps, there are many ways your funnel could have a leakage. This report gives you an on-point view of the conversion path and the data of each step. 

This report will not tell you why they exited but it’ll give you a clear view of where they exited.
You can always use this information to know what exactly happened before they exited the page.

  • Check the content
  • Look for bugs
  • Check for technical problems

Or anything that might create friction in user experience while buying.
Don’t just start at the first step, go step by step - starting from the place in the funnel that has the lowest users on the page and proceeding forward.

Landing page, Source medium and campaigns report

Access: Behavior -> Site Content-> Landing Page

Access: Acquisition -> All Traffic -> Source / Medium

Access: Acquisition -> All Traffic -> Campaign 

As you all know that all the eCommerce merchants are continuously running multiple campaigns simultaneously in order to increase brand name, product visibility to the multiple audiences and increase transaction volume as the key objectives. Although you can understand the overall website performance and product performances from the above reports, measuring the campaign performance also plays a key role in improving the conversion rate.

But, how to measure the performance of the campaigns run for each brand?

 This can be done by analyzing three main reports i.e. landing page report, source/medium report and campaign report.

With the use of the Landing page report, You get an idea of the first-page user visited on your website/App and how many of them finally converted and the amount of revenue that they generated.
Use source/Medium report to get an idea of the source/medium which is driving the most traffic to the website and influencing the conversions and revenue.
With the help of a campaign report, you get to know the effectiveness of your campaign and the revenue and conversions that the specific campaign generates.

Site search reports

Access: Behavior -> Site search

Being an eCommerce business, your website/App will be having in-app/website search functionality. To track the performance of the search terms which are driving users to engage more on your website/app or driving more conversions, you can do all of it through site search reports available in GA.

With the help of this report, you get insights on how much time users spent, which pages are visited or directly exited after writing a specific search team. You also get an idea of the number of visits with or without site search or how many times the search refinement was done after the user search and so on.

The Bottomline is…

Google Analytics is a wealth of data available for you to increase conversions. While the reports we’ve mentioned here aren’t the only reports you should see but they should be at your top priority. There are a plethora of metrics and reports available in GA and you should track metrics that align with your business goals.
These reports can help you make data-driven decisions that will certainly provide much-needed momentum to your conversions.
To know more on how to optimise GA for your eCommerce store, get in touch with one of our representatives today!

Guide to Create CTA buttons to improve E-commerce value proposition

5 Best Ways to Create Effective CTA Buttons and Effective Value Proposition for e-Commerce

What is a Value Proposition

A value proposition demonstrates the benefits your prospects get when they buy from you. It depicts the value you provide to your customers and gives customers a reason they might want to purchase from you. Value proposition answers an important question that each eCommerce customer wants to know from you: Why should I buy from you and not from your competitors?

Your value proposition is the main thing you can show on your website - if you get it right, it will bring an enormous boost. Value proposition details how you solve major pain-points your customer have and how you can improve their experience by adding more value to it.

The best value proposition should be clear on what is it and for whom? And How it helps.

Ways to Create Effective CTA Button for eCommerce

1. CTA [Call to Action] needs to be clear and Understood in five seconds or less.
Get straight to the purpose. Cut every unnecessary word, for example - Compare Buy Now with Add to Cart. One is far more urgent than the opposite. And how about replacing Try it for Free with a Free Trial. One is far punchier than the other and stands out effectively.


Do not ask for too much commitment and stick with one primary CTA, or if you are using more than one, then the secondary CTA can be a Ghost Button, but make sure the primary CTA remains highlighted.


2. The CTA should answer the customer’s principal need.

When it comes to your website, no element can be deemed as a part of a vacuum. It’s surrounded by other elements of varying sizes, importance, and messages, and jointly, all of them play a crucial role in determining the success and failure of that one element.

The same goes for the call-to-action buttons. What goes in the remaining part of the page, plays a big role in the effectiveness of the CTA buttons. 

Also, focus on what customers get, instead of what they lose. For example, Use Get it Now, Free Shipping, Instead of Buy for $100 or Cancel Anytime, and Add To Cart - Save 25% instead of Buy Now.

Identify the highest motive for people that come to your website. The homepage CTA should address this motive and help move visitors towards their goal. People want to understand the maximum amount possible of something before they buy it, whether it’s about dimensions, features, or anything.

Users must be shown what they will get back in exchange for taking this action. To grab the user’s attention, play with powerful words and craft a highly compelling copy for your CTA button.

Using something attractive and unique instead of simple CTA like Submit Now, Shop Now, Buy Now, etc., will surely catch the user’s eyes and compel them to take action, but some powerful and unique words should be incorporated to get the users attention and get them more inclined towards the CTA button.

3. Stand Out with Contrasting Colors.

Colors do matter when you ought to achieve a huge conversion rate. Colors often won’t have much effect to assist the balance and the dimensions of your buttons. A highly effective CTA ensures an excellent use of contrasting colors that stands out from the rest of the background.

For larger buttons, choose a color that’s less prominent within your design but still stands out against the background. There’s no exact answer about which color works best. So, you’ve got to use and test different colors to examine which color can offer you better conversions. 

For a smaller button, you may want to decide on a brighter, contrasting color to make the button pop. In either case, confirm the color you utilize, set the button apart without clashing with the site’s overall design.

So you’ve got to use and test different colors to ascertain which is performing best and provides better conversions, also it all depends on the design of your website. While doing so, make sure that it still resonates with the general look and feel of your brand.

4. Make sure the CTA is in the right size, place, and shape.

The CTA must be large enough to grab the visitor’s attention quickly and also make it easy for the user to click on it since the shape of the CTA also plays an important role in getting the conversions.

Depending on the design of your site, any shape might work well for you. Most e-commerce websites use rectangular buttons to make them more visible.

Also, keep in mind that CTA which is just too big will overpower everything around it. A small CTA will get lost in the shuffle of the other content on a page. So make sure that your CTA is large enough to face out without overwhelming the overall design.

As we know, using the mobile app to purchase or shop online is increasing, you must make the mobile experience as seamless as possible, which means that the CTAs need to be put where the thumb can easily reach. 

Make sure that the user can click mobile CTA, with the thumb, by making them the entire width or nearly the entire width of the screen, simply it must be easily reachable to the user’s thumb where they can click with less effort.

Spacing matters a great deal, and to balance the amount of negative space you have around the CTA buttons so that it doesn’t look cluttered because negative space helps your CTA stand out from the rest [Especially on Mobile].

On pages for where you have a single desired action, remove any other unnecessary distractions. Note that this is less important on some buttons like Add to Cart buttons, with others, like those to Know More, works better with more space.

5. Prioritize and Create a Sense of Scarcity

The call to action (CTA) on the page must prioritize if they are more than one. Done in a few ways, but yes, the most common is by using color and size.

You can use colors to highlight the CTA button on a page or make them less important or less prominent. Also, resize the button to stand out by making it large.

Use simple, direct language and large bold fonts. Make sure the language calls for specific action.

 width=Including visual cues in a CTA button is also an excellent idea, this helps to increase the conversion rates. The icon of a shopping cart - like the Add to Cart button, or an arrow on a download button, are both examples of visual cues. Make sure that the icon adds to the user experience by clarifying what the button is for, and doesn’t add any kind of confusion. Don’t be afraid to use less-commonly used icons, as long as their meaning remains clear.

Invoking a sense of scarcity can help. Show a deadline for a scheme or lack of stock, and by doing this, you can make the users more inclined to shop for your products. Create a sense of scarcity and urgency, by words like Hurry, Quickly, Limited Edition, etc.

When users know that this stock is limited, they rush to grab the product instantly, hence ultimately leading to an increase in conversions. For example: Showing sales end dates next to the CTA’s to remind customers that they have limited time to act. You can use this type of urgency-building element.

You want your buttons to offer them the impression that they have to act directly. You want to encourage them to make their decision immediately, Urgency is needed but doesn’t give false information or mislead the user, it will become a reason to pause.

In The End

The final tip for high conversion CTAs is the A/B Test and Optimize approach. The abovementioned tips will help you in boosting your conversions, there is no fixed approach for success in an eCommerce store, by conducting regular optimization tests, you will make incremental positive changes that will have a long-term impact than simply getting into blind.

The solution is to keep experimenting with variants of CTAs, copies, shapes, colors, etc., and find out what works better for you. 

Do not forget to Incorporate a Value Proposition to help you get an instant boost in conversions by stating the value proposition in the call-to-action button.

How To Increase Your Advertising Effectiveness?

Focus on Reaching The Right Person, At The Right Time, With The Right Message

Poorly targeted ads that reach the audience at the wrong time; compromise the overall effectiveness of any ad diluting the message that reaches the audience. An advertising nightmare!

Tatvic devised a unique approach and named it the Large Scale Experiment Method (LSEM) - to resolve the issue of poorly targeted ads, and LSEM increases the effectiveness of online advertising. 

Brand identity is deeply affected by the kind of advertising and creatives used. It can build the affinity of people towards your brand or can appear repulsive. 

Like most advertisers, if you want to increase your chance of creative success by reaching the right people with the right message at the right time, then this brief write-up about LSEM can help. It covers key points of LSEM and its role in developing creatives. 

Large Scale Experiment Method (LSEM) is a method to reach the right person, at the right moment, with the right message by practicing the principles of persuasion and value proposition.

What is a Large Scale Experiment Method?

Large scale experiment method is a way to know your audience better. It provides actionable insights about the people with whom you want to communicate, what interests your audience, and be considerate of what and when they want to hear from you.

Harness the power of Data 

You can leverage data to understand your audience. And figure out how you can sell to them or help them while entertaining them with your ad, that conveys your message most effectively. LSEM uses principles of persuasion and value proposition. So you harness the power of your data with accuracy and effectiveness. 

Why LSEM?

If you are not getting the result you aim for, and your messages are not reaching the right audience, then pause and consider why? 

There are some key questions to look upon to increase the effectiveness of your ads. Like - Have you paid much thought and consideration in the drafting of your creatives?

Are you able to get useful and actionable insights from your data? 

Ineffective advertising messages that fail to gain attention might indicate a lack of consideration of the immense benefits of using data to generate useful insights. We will tell you how to do that by LSEM and in a way that helps you reach your audience when they like it.  

Large scale experiment method helps draft non-intrusive messages by understanding the user’s interest. People might even appreciate you for being considerate about their interests, needs, and wants as it signals that you pay attention to them, listen and care enough to give the product or service of their choice.  

Large Scale Experimentation Method (LSEM)

LSEM (Large Scale Experiment Method) is a method to Reach the Right person, at the right moment, with the right message by using the Principles of Persuasion and Value Proposition.

Method To Deliver More Relevant Creative

1.  Identify The Moments

Identify the moments in which you want to engage the target audience.

To know your audience and understand what they are doing? And why are they doing it? You will need to understand the platform or channel where they are spending time? And why do they prefer that specific channel? 

Once you have an understanding, what they are doing in these areas, you will be able to engage better. 

Essentially it is all about reaching the right audience, at the right time and the right place. So you can more effectively know who your audience is by using targeted advertising. 

Whether it is Google ads or social media ads, all of them offer advanced targeting options to reach your target audience. Also, you can target the ads based on the location, demographics, and interests of your audience.

Make sure that your ads are displayed only to people who would be interested in your brand. You will be saving your spending on ads and need not spend a fortune to reach your target audience.

2. Leverage Signals

Leverage signals to customize creative messaging.

Reach further with upper-funnel audiences to Increase your campaigns. If your main goal is brand awareness and you need help to expand your Display campaigns’ reach, consider using upper funnel segments, such as Detailed Demographics, Life Events, Affinity, and Custom Affinity.

Detailed Demographics:  Detailed Demographics helps you reach users based on facts like - Homeownership, Marital status, Educational status, and Parenting stages. And it is not limited to only the age and gender of the user. 

Life Events: Knowing and understanding the main transition points in your audience’s life, allows you to reach them at their crucial decision-making time when they are most likely to make important purchase decisions. Like when they are purchasing a home, starting a new job, and retiring.

Affinity and Custom Affinity: Affinity segments give specific insights into your user, their interests, and what they are passionate about? 

These insights predict and depict your audience’s shopping behavior, lifestyle, and consumption habits. 

Affinity audiences are mostly people who are frequent at shopping, dining out, visiting salons, or attending live events. 

Similar audiences:  Find new customers by building a model of your retargeted audience behaviors and characteristics and then applying them to potential new customers.

Brief of Signal types:

  • Audience signals: Types of people you’re trying to target.

  • Media signals: Info about the content your user is looking at, where your ads might appear.

  • Environmental signals: External factors that might influence the user’s mindset and behavior when your ads are displayed

3. Creative For Full Customer Journey

Develop creatives for the full consumer journey.

The customer journey is a detailed outline of every step a lead takes to become a paying customer, or we can say customer journeys elaborate the path of sequential steps taken and interactions made by the customers with a company, product, and/or service.

4. Test & Learn Marketing

Implement a more fluid process & adopt a test and learn approach. Test and learn marketing, is a data-driven approach to continuously improve your campaigns, website, and brand performance through a series of ongoing tests. 

Chances are you already familiar with conversion rate optimization (CRO). CRO is a perfect example of test & learn marketing.

Turn insight into action from all of your tests that helps you to make informed predictions and decisions for future campaigns, for example : 

  • Selection of the most effective ad format for your campaign.
  • Deeper insights into how you can segment your target audience to determine relevant messaging techniques. 
  • See the performance of your creatives against your target audience lists.

This test and learn approach works on any marketing strategy. And automation tools make the task of managing tests and compiling data easier, that too without draining your funds or resources.

Benefits of LSEM

1. Engages an audience

To engage an audience, you would want to make smart use of your audience data. Audience data can include both first- and third-party data sources. Audience signals personalize campaign messaging. And make it more relevant based on the insights about the audience and their interests.

2. Saves time

No more mapping keywords, bid, and add text to each product on your website. Plus, By changing the category in the feeds, it is easy to target a particular audience. 

To save you time, and keep your ads relevant, Dynamic Search Ad headlines, landing pages are generated using content from your website. 

3. Shows relevant ads

Google Ads dynamically generates, shows relevant ads, with a clear and concise headline for the most relevant page on your site. This ad is generated based on the relevancy of the customer search with your product or service. 

4. Control your ads

You can show ads based on your entire website, or specific categories, or landing pages. Prevent your ads from showing for products that are temporarily not performing well.

You can easily customize your ads by knowing which elements in the ads are not performing better. For example, CTA text, copies, and Images to improve your ad performance.

Conclusion

No brainer, your creatives reflect and affect your brand identity and your brand communicates through it. The ads should be less intrusive, well-timed, and reach the right person conveying thoughtful and well-crafted messages. 

You get the crux here - Reach the right person, in the right moment and through the right message, and BOOM, your ad creative wins admiration from your audience, and you will rightfully gain their attention. Be remembered for better. 

Send your queries our way at hello@tatvic.comto know more about LSEM based Digital Advertising services and how can it amplify your digital advertising. You can also check a few examples of our Principle-based, Rich media, Interactive, Data-driven creative advertising here.

How to Track App Unintals in IOS & Android using Firebase? - Part 1/2

Blog App Uninstall Feaure Image

Blog App Uninstall Feaure Image

App uninstalls are the easiest thing to do on our smartphones, right? Enough blogs have mentioned the reasons behind these app uninstalls and a multitude of companies have done surveys too, reporting to reach at 10 worst reasons causing app uninstalls. For e.g. Google App Marketing Survey says an average app user has 36 apps installed on his/her smartphone. But they use only one-fourth of these apps daily. The remaining one-fourth that are never used are the ones likely to be uninstalled. Placing few other links in the references section.

app uninstallA Kantar/ITR study showed that an average of 26% of app installs are uninstalled in the first hour. That uninstall rate rises to 38% in the first day, 64% in the first month, and about 89% over 12 months. Those figures represent the average across all app types.
App Marketer’s KPI woes:

If you are a fellow app marketer or a product manager like me, you can feel the pain of a leaky bucket of users uninstalling your app mercilessly. We toil day and night to ensure a sprint app development process, user-friendly app features, and carve the simplest user journeys. We then market it just enough to make our app stay on top of Google Play Store rankings. All seems well and we are right on track to achieve that glorious milestone of 1 million app downloads. But our app analytics tools like Google Analytics, Firebase, Apsalar have a completely different story for us.

The report suggests that app uninstalls are on the rise this month, and your (well, mine too) KPIs for “number of active installs” indicates a churn rate of more than 40%.

What’s the Next Plan of Action?

Armed with the intelligence of the analytics tools, we decode the behavioral attributes of the users/ user segments who have uninstalled your app. The reasons behind most of the uninstall become our next app optimization and development tasks. But we almost forgot about the churned users. How do we win them back?

The first instinct is to take resort in our run-of-the-mill marketing activities.

  1. We run mailer campaigns with offers/marketing gimmicks if they had logged in with their email ids
  2. We send promotional SMS to user inbox if we had managed to capture their phone numbers.

And say, a majority of these users never logged in or gave their personal details to us. Now, as a consequence, we can never retarget them with personalization and the only thing left for us to do is just wait for these users to reinstall our app.

app uninstall

What’s the solution? Do we have a way to stop the users from churning in the first place?

Predictive Action to Stop Users from Churning?

Machine Learning Prediction Model is the answer. At Tatvic, our data science team has come up with a prediction model which feeds in scores of users, devices, and behavior features from the analytics tools and Tatvic’s internal Uninstall Library and predicts the probability of users who will uninstall within the next ‘n ‘ days. We call it PredictN Model.

Here is how it functions - in brief - we input the cohort of users who were acquired between any 15-day period along with their attributes. With previously trained data of identified churned users, PredictN Model will point out unique users from the said cohort who have more than 75% probability of uninstalling within 7 days.

  1. Retarget these users at once via Paid channels and Push notifications
  2. Understand the pattern of these unique users as to why they might be leaving your app from a geographic, demographic, device-specific, and/or behavioral perspective.
How does the model work?

Check this space to know more about model attributes and results in our next blog chapter.

A takeaway for reading till the end - heartfelt thanks, Feel free to reach out to us in case of any query or leave a comment in the section below on how you take predictive actions for uninstalls in your business.


Sources:

  1. https://apsalar.com/2016/01/all-about-app-uninstalls-2/
  2. https://www.linkedin.com/pulse/predicting-app-uninstalls-data-little-bit-science-arunachalam
  3. https://techinfographics.com/why-do-people-uninstall-apps/

Predictive analysis on Web Analytics tool data

ecommerce

In our previous webinar, we discussed on basic things to perform predictive analysis. We also discussed on an eCommerce problem and how it can be solved using predictive analysis. In this post, I will explain R script that I used to perform predictive analysis during webinar. I will also highlight how web analytics support can enhance data accuracy and streamline the analysis process for better business insights.

Before I explain about R script, let me recall the eCommerce problem that we discussed during webinar so can get better idea about the data and R script. For eCommerce retailers product return is headache and higher return rates impact the bottom line of their business. So if return rate is reduced by a small amount then it would impact on the total revenue. In order to reduce return rate, we need to identify transactions where probability of product return is higher, if we can able to identify those transactions then we can perform some actions before delivering products and reduce the return rate.


In webinar, we discussed that we can solve this problem using predictive analytics and use Google Analytics data. To perform predictive analysis we need to go through modeling process and following are the major steps of it.

  1. Load input data
  2. Introducing model variables
  3. Create model
  4. Check model performance
  5. Apply model on test data

I have included these steps in R script. So, let me explain R script that we used in webinar. R script is shown below.

# Step-1 : Read train dataset
train 
# remove TransactionID from train dataset
train 
# Step-3 : Create model 
model 
# Step-4 : Calculate accuracy of model
predicted 
#Step-5 : Applying model on test data
#Load test dataset 
test 
#Predict for test data
test_predict 
#creating label for test dataset
label 
# set label equal to 1 where probabilty of return > 0.6
label[test_predict>0.6] 
# attach label to test dataset
test$label 
# Identify transactionID where label is 1.
high_prob_transactionIds 
high_prob_transactionIds

As you can see that first step is load input data set. In our case input data are train data and train data are loaded using read.csv() function. Train data contain the transaction based data and it contains TransactionID. TransactionID is not needed to use in the model, so it should be removed from the train data.

We also discussed about the variables during the webinar. Train data include pre-purchase, in-purchase and some general attributes. We can retrieve these data from the Google Analytics.

Next, model is created using glm() function and three arguments are given to it which are formula, family and data. In formula, we specify response variable and predictor variables separated by ~ sign. Second argument we set family equal to binomial and last we set data equal to train. Once model is created, its performance is checked where accuracy of the model is calculated. it is shown in the script.

Finally, model is applied on the test dataset and predict the probability of the product return for each transaction in test dataset. In the script, you can see that I have performed several steps to identify the transactionIDs from test data having higher probability of product return. Let me explain them, first test data are loaded. Second, predict() function is used which will generate the probabilities of product return and store in test_predict. Third, new variable label is created which contain 0 for all transactions initially and then using test_predict variable, 0 is replaced with the 1 where probability of return is greater than 0.6 or 60%. Now this label is attached to the test data. Finally all the transactionIDs are retrieved where label is 1 which means that probability of product return is greater than 60% in these transactionIDs.

So this is the script which I used during the webinar and performed the predictive analysis. I have created dummy datasets which you can use to perform these steps yourself. You can download data and R script from here

Here I want to share you one thing, this is not optimized model. This is a practice model for understanding how to leverage web analytics support services for your business needs. You can improve the model by taking other variables from Google Analytics or performing some optimization tasks, so you can get better results. However if you want to look at some other predictive models on web analytics tool data click here


Google analytics data extraction in R

oauth2

Unlike other posts on this blog, this particular post is more focused on coding using R so an audience with a developer mindset would like it more than pure business analysts.

My goal is to describe an alternative method to use to extract the data from Google Analytics via API into R. I have been using R for quite some time but I think the GA library for R has been broken and while they did make an update, it’s sort of not being used right now.

Considering this, I thought to write it down by myself on moving on as more data-related operations are now being done using R.

Moreover, the Rgoogleanalytics package that is available is built for Linux only and my Windows friends may just like me to have something for them as well.

Ok so let’s get started, it’s going to be very quick and easy.

There are some prerequisites for GA Data extraction in R:

  1. At least one domain must be registered with your Google analytics account
  2. R installed with the following the Googleng packages

Steps to be followed for Google Analytics data extraction in R :

Set the Google Analytics query parameters for preparing the request URI:

To extract the Google Analytics data, first, you need to define the query parameters like dimensions, metrics, start date, end date, sort, and filters as per your requirement.

# Defining Google analytics search query parameters

# Set the dimensions and metrics
ga_dimensions <- 'ga:visitorType,ga:operatingSystem,ga:country'
ga_matrics <- 'ga:visits,ga:bounces,ga:avgTimeOnSite'

# Set the starting and ending date
startdate <- '2012-01-01'
enddate <- '2012-11-30'

# Set the segment, sort and filters
segment <- 'dynamic::ga:operatingSystem==Android'
sort <- 'ga:visits'
filters <- 'ga:visits>2'
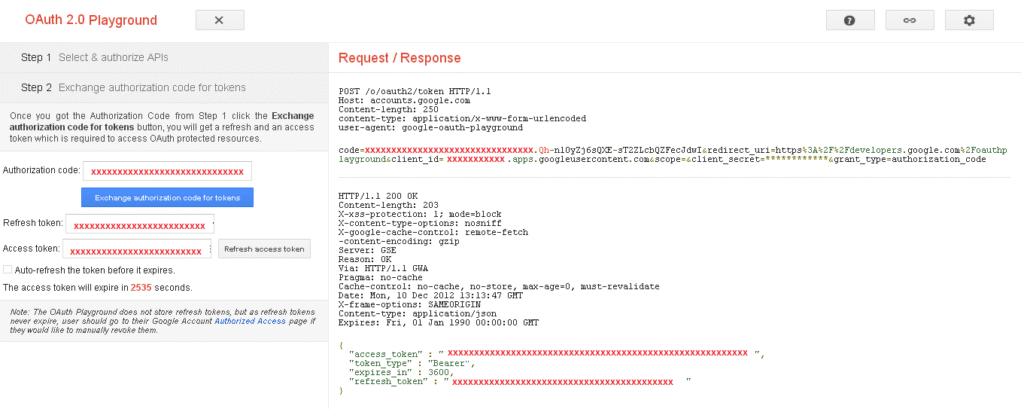
Get the access token from Oauth 2.0 Playground

We will obtain the access token from Oauth 2.0 Playground. Following are the steps for generating the access token.

  1. Go to Oauth 2.0 Playground
  2. Select Analytics API and click on the Authorize APIs button with providing your related account credentials
  3. Generate the access token by clicking on the Exchange authorization code for tokens and set it to the access token variable in the provided R script
Retrieve and select the Profile

From the below, you can retrieve the number of profiles registered under your Google Analytics account. With this, you can have the related GA profile id. Before retrieving profiles ensure that the access token is present.

We can retrieve the profile by requesting to Management API with accesstoken as a parameter, it will return the JSON response. Here are the steps to convert the response to the list and store it in to the data frame object profiles.

# For requesting the GA profiles and store the JSON response in to GA.profiles.Json variable
GA.profiles.Json <- getURL(paste("https://www.googleapis.com/analytics/v3/management/accounts/~all/webproperties/~all/profiles?access_token=",access_token, sep="", collapse = ","))

# To convert resonse variable GA.profiles.Json to list
GA.profiles.List <- fromJSON(GA.profiles.Json, method='C')

# Storing the profile id and name to profile.id and profile.name variable
GA.profiles.param <- t(sapply(GA.profiles.List$items,
                              '[', 1:max(sapply(GA.profiles.List$items, length)))) 
profiles.id <- as.character(GA.profiles.param[, 1])
profiles.name <- as.character(GA.profiles.param[, 7])

# Storing the profile.id and profile.name to profiles data.frame
profiles <- data.frame(id=profiles.id,name=profiles.name)

We have stored the profiles information in profiles data frame with profile id and profile name. We can print the retrieved list by following code

profiles
OUTPUT::

         id       name
1 ga:123456    abc.com
2 ga:234567    xyz.com

At a time we can retrieve the Google analytics data from only one GA profile. so we need to define the profile id for which we want to retrieve the GA data. You can select the related profile id from the above output and store it in to profileid variable to be later used in the code.

# Set your google analytics profile id
profileid <- 'ga:123456'
Retrieving GA data

Requesting the Google Analytics data to Google analytics data feed API with an access token and all of the query parameters defined as dimensions, metrics, start date, end date, sort, and filters.

# Request URI for querying the Google analytics Data
GA.Data <- getURL(paste('https://www.googleapis.com/analytics/v3/data/ga?',
                        'ids=',profileid,
			'&dimensions=',ga_dimensions,
                        '&metrics=',ga_matrics,
			'&start-date=',startdate,
                        '&end-date=',enddate,
                        '&segment=',segment,
			'&sort=',sort,
			'&filters=',filters,
                        '&max-results=',10000,
                        '&start-index=',start_index*10000+1,
                        '&access_token=',accesstoken, sep='', collapse=''))

This request returns a response body with the JSON structure. Therefore to interpret these response values we need to convert it to a list object.

# For converting the Json data to list object GA.list
GA.list <- fromJSON(GA.Data, method='C')

Now its easy to get the response parameters from this list object. So, the total number of the data rows will be obtained by the following command

# For getting the total number of the data rows
totalrow <-  GA.list$totalResults
Storing GA data in a Data frame

Storing the Google Analytics response data in R dataframe object which is more appropriate for data visualization and data modeling in R

# Splitting the ga_matrics to vectors
metrics_vec <- unlist(strsplit(ga_matrics,split=','))

# Splitting the ga_dimensions to vectors
dimension_vec <-unlist(strsplit(ga_dimensions,split=','))

# To splitting the columns name from string object(dimension_vec)
ColnamesDimension <- gsub('ga:','',dimension_vec)

# To splitting the columns name from string object(metrics_vec)
ColnamesMetric <- gsub('ga:','',metrics_vec)

# Combining dimension and metric column names to col_names
col_names <- c(ColnamesDimension,ColnamesMetric)
colnames(finalres) <- col_names

# To convert the object GArows to dataframe type
GA.DF <- as.data.frame(finalres)

Finally the retrieved data is stored in GA.DF dataframe. You can chek it’s top data by the following command

head(GA.DF)
OUTPUT::
        visitorType operatingSystem   country visits bounces      avgTimeOnSite
1       New Visitor         Android Australia      3       1              106.0
2       New Visitor         Android   Belgium      3       1 155.33333333333334
3       New Visitor         Android    Poland      3       0               60.0
4       New Visitor         Android    Serbia      3       2 40.666666666666664
5       New Visitor         Android     Spain      3       1               43.0
6 Returning Visitor         Android (not set)      3       3                0.0

You will need this full R script for trying this yourself, You can download this script by clicking here. Currently, I am working on the development of R package, which will help R users to do the same task with less effort. If anyone among you is interested provide your email id in the comment, and we’ll get in touch.

Would you like to understand the value of predictive analysis when applied to web analytics data to help improve your understanding relationship between different variables? We think you may like to watch our Webinar - How to perform predictive analysis on your web analytics tool data. Watch the Replay now!


Bot Icon
Bot Icon

Tatvic Bot

Explore About Tatvic and Services