Hello There!

Lorem ipsum dolor sit amet, consectetur adipiscing elit,

 About tatvic

Tatvic, a Google Premier Partner, empowers industry leaders with end-to-end Data & Marketing Analytics, leveraging Cloud, Analytics, Maps, and AI/ML for data-driven insights and future-proof digital growth.

Simply, know more with GA4 Advertising Reporting Features

To give deeper insights into your data, Google is constantly releasing new reporting features in Google Analytics 4, widely known as GA4 reporting. The main objective of these features is to help marketers in filling up the gap of those who opt-out of being tracked by analytics tools. (visit: ga4.tatvic.com for step-by-step planning of your GA4 migrations journey)

The new Advertising features in Google Analytics 4 include reports that are dedicated to advertising activities and inbound marketing activities. It also includes insights related to the campaign performance, along with other organic and paid traffic sources. GA4 reporting emphasizes attribution modeling. It enables the marketers to get an insight into the conversions using different attribution models and view various touchpoints assisting conversions.

GA4 Reporting on Advertising Activities: New Features

ABOUT ATTRIBUTION:

Attribution helps in assigning the credit to our conversions to different ads, clicks, or factors a user has undergone to complete the conversion. An attribution model can be a pre-decided rule, a set of rules, or a data-driven algorithm that determines how a conversion is attributed.

Google Analytics 4 provides three types of attribution models available in the Attribution reports: cross-channel rules-based models, an Ads-preferred rules-based model, and data-driven attribution.

Data-driven attribution model:

This model distributes credit for the conversion based on data for each conversion event. It’s different from the other models because it uses your account’s data to calculate the actual contribution of each click interaction.

Cross-channel rules-based models:

This model has the following types of attribution model:

  • Cross-channel last click: Ignores direct traffic and attributes 100% of the conversion value to the last channel that the customer clicked through (or engaged view through for YouTube) before converting.
  • Cross-channel first click: Gives all credit for the conversion to the first channel that a customer clicked (or engaged view through for YouTube) before converting.
  • Cross-channel linear: Distributes the credit for the conversion equally across all the channels a customer clicked (or engaged view through for YouTube) before converting.
  • Cross-channel position-based: Attributes 40% credit to the first and last interaction, and the remaining 20% credit is distributed evenly to the middle interactions.
  • Cross-channel time decay: Gives more credit to the touchpoints that happened closer in time to the conversion. Credit is distributed using a 7-day half-life. In other words, a click 8 days before a conversion gets half as much credit as a click 1 day before a conversion.

Ads-preferred last click

This attributes 100% of the conversions to the last Google Ads that the user clicked through before converting. If there is no Google Ads click in the path followed by the user, the attribution model falls back to the cross-channel the last click.

DO YOU KNOW?

Users with the Editor role on the property can now select an attribution model and lookback window at the property level to apply to several reports. To access this setting, go to Admin > Attribution Settings.

NAVIGATION TO ADVERTISING REPORT:

To navigate to the Attribution reports, click Advertising on the left. Under Attribution, click either Model comparison or Conversion paths.

What answers can you get from an advertising report?

  • Which channels drive the most conversions?
  • What touchpoints do the customers take to convert?
  • What roles did referrals, searches, and ads play in the final conversions?
  • How long did it take for a customer from showing initial interest to final conversion?
  • How many touchpoints contributed to conversions?
  • How much revenue was generated by each conversion path?

The advertising report interface lets you choose the attribution model you want to apply to the metrics. However, the models you choose won’t change the data used for the reporting.

The Google Analytics 4 interface currently has three reports under the “Advertising” section. Let’s explore each report in detail!

ADVERTISING SNAPSHOT:

The GA4 reporting on Advertising Snapshot includes automated insights generated using Google’s advanced Machine Learning algorithms. It also lets you compare two attribution models to see the impact on the conversions. Most of the time, you would want to quickly dive deeper into the data to see dedicated reports to get more insights.

GA4 Reporting: View Advertising Snapshot by conversion Events
View Advertising Snapshot by conversion Events

MODEL COMPARISON

In this report, you will be able to compare different attribution models which will help you understand the impact of different attribution models on conversions. The report will show you the number of conversions and the associated revenue with each marketing channel; also the percentage change between the models.

You can choose the models you would like to see in the report above the table:

GA4 Reporting: Model Comparison by Default Channel Grouping
Model Comparison by Default Channel Grouping

The Model Comparison reporting interface includes the following customizations:

  • Reporting Time: While navigating through the reports, you can switch between “Conversion Time” and “Interaction Time”. 
      • Conversion Time means that events will be included based on the lookback window defined whereas choosing “Interaction Time” means that the events need to occur within the selected date range for the report.
  • Conversion Events: You can choose which conversions you want to be used for the report to narrow down the report’s focus. For example, if you have multiple conversions, you may want to focus on only specific conversions and analyze the performance.
  • Filters: You can apply segments/ filters to include specific events or user segments.
GA4 Reporting: Customize Report in Model Comparison
Customize Report in Model Comparison

CONVERSION PATHS

The conversion paths report shows the touchpoints that the users engage with before converting. The top section of the GA4 reporting shows you the marketing channels based on their position in the conversion path. You will see the channels that created initial awareness on the left, and the channels that contributed to final conversions on the right. Using the drop down, you can also change the attribution model to update the visualization.

TOUCHPOINTS

The conversion credit is attributed to each step in the Conversion Path based on the Attribution model that is selected. These touchpoints are defined as:

  • Early Touchpoints: these are the first 25% of touchpoints in the conversion path. (Note: This segment is empty if the path has only one touchpoint.)
  • Mid Touchpoints: are the middle 50% of touchpoints in the conversion path. (Note: If the path has <3 touchpoints, this segment is empty.)
  • Late Touchpoints: are the last 25% of touchpoints in the conversion path. (Note: If the path consists of just one touchpoint, this segment gets all the credit.)
Conversion Paths by different Models

In the second section of the report, you will see a visualization that shows different conversion paths. You will be able to notice that some channels have multiple touchpoints. This shows how many times people engaged with any particular channel.

The report also includes other metrics such as the number of days to conversion and the number of touchpoints for each path apart from the conversion metrics.

So, what’s the key takeaway:

The advertising Report feature in GA4 is your go-to place to get rich insights into the relationships between your various marketing channels and how they are driving conversions. From getting automated insights in the snapshot to analyzing the different conversion paths, GA4 reporting offers a lot of flexibility for reports and data understanding. 

(visit: ga4.tatvic.com for step-by-step planning of your GA4 migrations journey)

Firebase Mobile In-Apps Messaging Ab Testing: Guide with Examples

[vc_row][vc_column][vc_column_text]Welcome back to the Firebase quadrilogy. We have been learning a lot about Firebase through our 4-part series! Firebase enables you to perform A/B testing in mobile apps with minimal effort and better results.

So far we have learned about Ways to Implement A/B Testing in Mobile Apps and How to Configure it. In case you missed the first two parts, take a quick look at it from here.

A/B Testing In Mobile Apps - Notifications

The app analyzes notifications to increase user engagement. Its primary focus is to accomplish the app’s goals. The notifications act as a bridge between the users and the app to determine its effectiveness towards the end goals.

They allow app users to spend more time inside the app and make purchases. This leads to a higher conversion rate. The only requirement is:

“Send a message to the right user at the right moment.”

Personalizations via notifications are possible to ensure users constantly engage with mobile applications.

Below is the step by step guide to implementing Personalization via Notifications:

Setup Notification in Android Application

1. Add Cloud messaging dependency to app-level build.gradle file. Use the latest sdk version.

2. To implement Firebase notification, import FirebaseMessaging library in Java file

Firebase Notification: A/B testing in Mobile Apps

3. After creating the class, this step is mandatory to allow the notification service to be active when the app is in the background. Add service class which is created in the above step.

4. This step is Optional. It allows users to set a default notification icon and color.


Firebase A/B test experiment manifest meta-code snippet

Setup Notification in Firebase Console

A simple step-by-step directive to set up notification in Firebase Console:

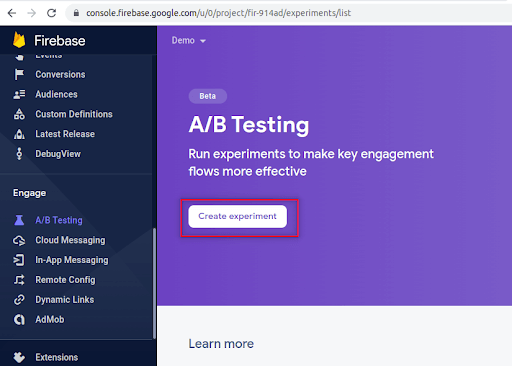
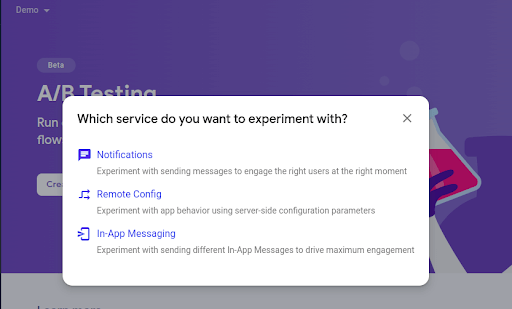
1. Sign in to the Firebase console: In the Engage section, select AB testing. Click on Create Experiment. Select In-App Messaging from pop up.

Firebase A/B test experiment types

2. Add experiment: Enter name, description, target users and other requisite details. Click Next.

Firebase A/B test Notification details & experiment targeting conditions

Condition to Target Users: In Notification A/B test, there are various conditions to isolate users whom you want to send notification for app engagement. Such as App ID, User audiences (It allows to choose all users, purchasers, or any custom that are created), user properties, etc.

Firebase A/B test experiment targeting user types

3. Define Variants: Add messages that should be displayed to target users through multiple variants or you can prefer original text. Click Next.

Firebase A/B test experiment variant details

4. Define Goal: Do the users fall under a variant or original, which goal should you consider for accomplishment?

Goal types and metrics are the same as set in remote config. One new event Notification opens and a metric is added to better measurement.

Firebase A/B test experiment Goal condition selection

5. Send Now or Schedule: Selecting Message option allows you to select either Send Now or to be Scheduled for the specific time to send notification.

Firebase A/B test experiment message options

Let’s explore Advanced Message Options:

a. Advanced options: Some advanced configurations can be set to send notifications with dynamic data.

b. Title: The notification title that is shown on Android devices and Apple watchOS devices.

c. Custom data: A set of key-value pairs that is delivered to the app along with the notification.

d. Android Notification Channel: It provides the ability to group the notifications that our application sends into manageable groups. By default, it will be blank

e.  Sound: Disabled or Enabled

f.  Expires: An interval that determines how long the message is kept for redelivery

v
Firebase A/B test experiment Notification configuration advance options

6. Click on Review.

Firebase A/B test experiment overview

7. Test the Experiment: Access the device registration token. FCM SDK generates a registration token for the client app instance using that we are allowed to target single or multiple devices at once.

Firebase A/B test experiment testing on device

8. Post Testing Completion: Review the experiment and start it. Analyze the results for a few days. Here is a sample notification of our A/B test that Firebase has sent to all users who fall into the variant.

Firebase A/B test experiment sample screenshot

In-App Messaging

Firebase A/B Testing in Mobile Apps lets you evaluate multiple variants of a In-App Messaging.

It helps you engage your app’s active users by sending them targeted, contextual messages that encourage them to use key app features.

For Example, you could send an in-app message to get users to subscribe, watch a video, complete a level, or buy an item. You can customize messages as cards,

banners, modals, or images, and set up triggers so that they appear exactly when they’d benefit your users most.

Setup In-App Messaging in Android Application

1. Add Firebase SDK & In App Messaging Library in android app as shown below.

In App Messaging Library in android app

2. Sign in to the Firebase console

In the Engage section, select In-App Messaging. Click Create Experiment. Select Notifications from pop up.

Firebase A/B test experiment types

3. Add Experiment name & its description as shown below

Firebase A/B test experiment details

4. Add banner details, button text, image url, etc in baseline & other variant models. 

Firebase A/B test experiment variant details

Create a card-like structure which will be visible to the users inside the app.

5. Add details for targeting users in apps.

Firebase A/B test experiment targeting conditions

6. Add Goals to experiment. 

Select Primary metric to decide a leader / winner for variants shown to users. Add additional secondary metrics to compare the numbers for multiple variants in A/B Test experiment.

Firebase A/B test experiment Goal condition selection

7. Schedule In-App Messaging. 

You can schedule In-App Messages or send it on the go as well. Additionally, you can mention the end date on the console to automatically stop the campaign for all users. 

Add activation conditions for In-App Messages for users who have triggered that event. 

For example, below we have shown a button_click as an activation event for In-App Messages to be displayed to users.

Firebase A/B test experiment in-app messaging scheduling

8. Click on Review

Firebase AB test experiment review

9. Test In-App Messages

Now we can test the In-App Messages as well in testing devices with the help of Instance ID token or FIS auth token. We have shown below the same for reference. Add testing device token & save that.

Firebase A/B test experiment testing on device

For sample, we have shown below two variants of configured In-App Messaging Banners.

Firebase A/B test baseline vs variant

10. Post verification in the testing device. Click on Start Experiment to make this experiment live.

Firebase A/B test experiment Overview

On a Closing Note

Firebase has proved to be a crucial addition to enhance In-App messaging capabilities. You can perform A/B testing in notifications with quick and accurate results. 

So, how has your experience been so far? Drop your feedback and experiences below and we will reach out to you!

This is the third part in the series to guide you through Firebase A/B Testing in Mobile Apps! Part 4 will help you with -  How to Set Configure A/B testing.[/vc_column_text][vc_raw_html]JTNDZGl2JTIwaWQlM0QlMjJteU1vZGFsJTIyJTIwY2xhc3MlM0QlMjJuZXdtb2RhbCUyMiUzRSUwQSUwQSUyMCUyMCUzQyUyMS0tJTIwTW9kYWwlMjBjb250ZW50JTIwLS0lM0UlMEElMjAlMjAlM0NkaXYlMjBjbGFzcyUzRCUyMm5ld21vZGFsLWNvbnRlbnQlMjIlM0UlMEElMjAlMjAlMjAlMjAlM0NkaXYlMjBjbGFzcyUzRCUyMm5ld21vZGFsLWhlYWRlciUyMiUzRSUwQSUyMCUyMCUyMCUyMCUyMCUyMCUzQ3NwYW4lMjBjbGFzcyUzRCUyMm5ld2Nsb3NlJTIyJTNFJTI2dGltZXMlM0IlM0MlMkZzcGFuJTNFJTBBJTIwJTIwJTIwJTIwJTIwJTIwJTNDcCUyMGlkJTNEJTIydGl0bGUlMjIlM0UlM0MlMkZwJTNFJTBBJTIwJTIwJTIwJTIwJTNDJTJGZGl2JTNFJTBBJTIwJTIwJTIwJTIwJTNDZGl2JTIwY2xhc3MlM0QlMjJlbnRyeS1oZWFkJTIyJTNFJTBBJTIwJTIwJTIwJTIwJTIwJTIwJTNDcCUyMGNsYXNzJTNEJTIyZW50cnktbWVzc2FnZSUyMHRleHQtY2VudGVyJTIyJTNFJTNDJTJGcCUzRSUwQSUyMCUyMCUyMCUyMCUzQyUyRmRpdiUzRSUwQSUyMCUyMCUyMCUyMCUzQ2RpdiUyMGNsYXNzJTNEJTIybmV3bW9kYWwtYm9keSUyMiUzRSUwQSUyMCUyMCUyMCUyMCUyMCUyMCUyMCUzQ3AlMjBjbGFzcyUzRCUyMmJvbGQtaGVhZGluZyUyMHN1Yi1oZWFkaW5nJTIyJTNFJTIwUGxlYXNlJTIwZW50ZXIlMjB5b3VyJTIwZW1haWwlMjBpZCUyMHRvJTIwZG93bmxvYWQlMjBFYm9vay4lM0MlMkZwJTNFJTBBJTIwJTIwJTIwJTIwJTIwJTIwJTIwJTNDZGl2JTIwY2xhc3MlM0QlMjJmb3JtLWNsdXN0ZXIyJTIyJTNFJTBBJTIwJTIwJTIwJTIwJTIwJTIwJTIwJTIwJTIwJTIwJTIwJTVCY29udGFjdC1mb3JtLTclMjBpZCUzRCUyMjQ4MDI3JTIyJTIwdGl0bGUlM0QlMjJFYm9vayUyMERvd25sb2FkJTIyJTIwaHRtbF9pZCUzRCUyMmVib29rRG93bmxvYWQlMjIlMjBodG1sX2NsYXNzJTNEJTIyZm9ybSUyMGluZm9ncmFwaGljJTIyJTVEJTBBJTIwJTIwJTIwJTIwJTIwJTIwJTIwJTNDJTJGZGl2JTNFJTBBJTIwJTIwJTIwJTIwJTNDJTJGZGl2JTNFJTBBJTIwJTIwJTIwJTNDZGl2JTIwY2xhc3MlM0QlMjJuZXdtb2RhbC1mb290ZXIlMjIlM0UlMEElMjAlMjAlMjAlMjAlM0MlMkZkaXYlM0UlMEElMjAlMjAlM0MlMkZkaXYlM0UlMEElMEElM0MlMkZkaXYlM0UlMEElMEElM0NkaXYlMjBpZCUzRCUyMnRoYW5reW91TW9kYWwlMjIlMjBjbGFzcyUzRCUyMm5ld21vZGFsJTIyJTNFJTBBJTBBJTIwJTNDJTIxLS0lMjBNb2RhbCUyMGNvbnRlbnQlMjAtLSUzRSUwQSUyMCUyMCUzQ2RpdiUyMGNsYXNzJTNEJTIybmV3bW9kYWwtY29udGVudCUyMiUzRSUwQSUyMCUyMCUyMCUyMCUzQ2RpdiUyMGNsYXNzJTNEJTIybmV3bW9kYWwtaGVhZGVyJTIyJTNFJTBBJTIwJTIwJTIwJTIwJTIwJTIwJTNDc3BhbiUyMGlkJTNEJTIydGhhbmt5b3VDbG9zZSUyMiUyMGNsYXNzJTNEJTIydGhhbmt5b3VDbG9zZSUyMiUzRSUyNnRpbWVzJTNCJTNDJTJGc3BhbiUzRSUwQSUyMCUyMCUyMCUyMCUyMCUyMCUyMCUzQ3AlMjBpZCUzRCUyMnRoYW5rc1RpdGxlJTIyJTNFJTJGcCUzRSUwQSUyMCUyMCUyMCUyMCUzQyUyRmRpdiUzRSUwQSUyMCUyMCUyMCUyMCUwQSUyMCUyMCUzQ2RpdiUyMGNsYXNzJTNEJTIybmV3bW9kYWwtYm9keSUyMiUzRSUwQSUyMCUyMCUyMCUzQ2RpdiUyMHN0eWxlJTNEJTIydGV4dC1hbGlnbiUzQWNlbnRlciUzQm1hcmdpbi10b3AlM0ElMjAyMHB4JTNCJTIyJTNFJTBBJTIwJTIwJTIwJTNDc3BhbiUyMHN0eWxlJTNEJTIyZm9udC1zaXplJTNBJTIwMjBweCUzQiUyMiUzRVRoYW5rJTIweW91JTIwJTNDc3BhbiUyMGlkJTNEJTIyZC1uYW1lJTIyJTIwY2xhc3MlM0QlMjJ0aG5rdWgxJTIyJTIwc3R5bGUlM0QlMjJsaW5lLWhlaWdodCUzQSUyMDElMjAlMjFpbXBvcnRhbnQlM0JtYXJnaW4tdG9wJTNBJTIwMjBweCUzQmZvbnQtd2VpZ2h0JTNBJTIwNDAwJTNCJTIyJTNFJTNDJTJGc3BhbiUzRSUyMGZvciUyMHdyaXRpbmclMjB0byUyMHVzLiUzQyUyRnNwYW4lM0UlMEElMjAlMjAlMEElMjAlMjAlMjAlM0NkaXYlMjBjbGFzcyUzRCUyMnRoYW5rdU1zZyUyMiUyMHN0eWxlJTNEJTIybWFyZ2luLXRvcCUzQSUyMDIwcHglM0JtYXJnaW4tYm90dG9tJTNBJTIwMjBweCUzQnBhZGRpbmclM0ElMjAxNXB4JTNCJTIyJTNFV2UlMjd2ZSUyMHJlY2VpdmVkJTIweW91ciUyMHJlcXVlc3QlMjBmb3IlMjBmcmVlJTIwJTNDc3BhbiUyMGlkJTNEJTIyZnJlZS10eXBlJTIyJTNFJTNDJTJGc3BhbiUzRSUzQ2JyJTNFJTBBJTIwJTIwJTIwJTIwT3VyJTIwdGVhbSUyMHdpbGwlMjBnZXQlMjBiYWNrJTIwdG8lMjB5b3UlMjB3aXRoaW4lMjAxJTIwYnVzaW5lc3MlMjBkYXkuJTNDJTJGZGl2JTNFJTBBJTIwJTIwJTIwJTIwJTBBJTIwJTIwJTNDJTJGZGl2JTNFJTBBJTIwJTIwJTNDJTJGZGl2JTNFJTBBJTIwJTNDJTJGZGl2JTNFJTBBJTIwJTNDJTJGZGl2JTNF[/vc_raw_html][vc_raw_js]JTNDc2NyaXB0JTNFJTBBalF1ZXJ5JTI4JTIwZG9jdW1lbnQlMjAlMjkucmVhZHklMjhmdW5jdGlvbiUyOCUyOSUyMCU3QiUwQXZhciUyMHR2Y01vZGFsRmxhZyUyMCUzRCUyMGZhbHNlJTNCJTBBalF1ZXJ5JTI4JTIyLmZpcmViYXNlLWVib29rJTIyJTI5LmNsaWNrJTI4ZnVuY3Rpb24lMjglMjklN0IlMEFldmVudC5wcmV2ZW50RGVmYXVsdCUyOCUyOSUzQiUwQXZhciUyMHBhZ2Vfc3RyJTIwJTNEJTIwZG9jdW1lbnQubG9jYXRpb24ucGF0aG5hbWUlM0IlMEF2YXIlMjBwYWdlX3VybF9yZXMlMjAlM0QlMjBwYWdlX3N0ci5zcGxpdCUyOCUyMiUyRiUyMiUyOSUzQiUwQWRvY3VtZW50LmdldEVsZW1lbnRCeUlkJTI4JTI3cGFnZS1uYW1lJTI3JTI5LnZhbHVlJTIwJTNEJTIwcGFnZV91cmxfcmVzJTVCMiU1RCUzQiUwQW1vZGFsLnN0eWxlLmRpc3BsYXklMjAlM0QlMjAlMjJibG9jayUyMiUzQiUwQSU3RCUyOSUzQiUwQSUwQXZhciUyMG1vZGFsJTIwJTNEJTIwZG9jdW1lbnQuZ2V0RWxlbWVudEJ5SWQlMjglMjdteU1vZGFsJTI3JTI5JTNCJTBBJTBBdmFyJTIwc3BhbiUyMCUzRCUyMGRvY3VtZW50LmdldEVsZW1lbnRzQnlDbGFzc05hbWUlMjglMjJuZXdjbG9zZSUyMiUyOSU1QjAlNUQlM0IlMEElMEF2YXIlMjBtb2RhbDIlMjAlM0QlMjBkb2N1bWVudC5nZXRFbGVtZW50QnlJZCUyOCUyN3RoYW5reW91TW9kYWwlMjclMjklM0IlMEF2YXIlMjBzcGFuMiUyMCUzRCUyMGRvY3VtZW50LmdldEVsZW1lbnRCeUlkJTI4JTIydGhhbmt5b3VDbG9zZSUyMiUyOSUzQiUwQSUwQSUwQXNwYW4ub25jbGljayUyMCUzRCUyMGZ1bmN0aW9uJTI4JTI5JTIwJTdCJTBBJTIwJTIwJTIwJTIwbW9kYWwuc3R5bGUuZGlzcGxheSUyMCUzRCUyMCUyMm5vbmUlMjIlM0IlMEElN0QlMEElMEF3aW5kb3cub25jbGljayUyMCUzRCUyMGZ1bmN0aW9uJTI4ZXZlbnQlMjklMjAlN0IlMEElMjAlMjAlMjAlMjBpZiUyMCUyOGV2ZW50LnRhcmdldCUyMCUzRCUzRCUyMG1vZGFsJTI5JTIwJTdCJTBBJTIwJTIwJTIwJTIwJTIwJTIwJTIwJTIwbW9kYWwuc3R5bGUuZGlzcGxheSUyMCUzRCUyMCUyMm5vbmUlMjIlM0IlMEElMjAlMjAlMjAlMjAlN0QlMEElMjAlMjAlMjAlMjBlbHNlJTIwaWYlMjhldmVudC50YXJnZXQlMjAlM0QlM0QlMjBtb2RhbDIlMjklN0IlMEElMjAlMjAlMjAlMjAlMjAlMjBtb2RhbDIuc3R5bGUuZGlzcGxheSUyMCUzRCUyMCUyMm5vbmUlMjIlM0IlMEElMjAlMjAlMjAlMjAlN0QlMEElMjAlMjAlMjAlMjAlMEElN0QlMEElMEFzcGFuMi5vbmNsaWNrJTIwJTNEJTIwZnVuY3Rpb24lMjglMjklMjAlN0IlMEElMjAlMjAlMjAlMjBtb2RhbDIuc3R5bGUuZGlzcGxheSUyMCUzRCUyMCUyMm5vbmUlMjIlM0IlMEElN0QlMEElN0QlMjklM0IlMEFkb2N1bWVudC5hZGRFdmVudExpc3RlbmVyJTI4JTIwJTI3d3BjZjdtYWlsc2VudCUyNyUyQyUyMGZ1bmN0aW9uJTI4JTIwZXZlbnQlMjAlMjklMjAlN0IlMEElMjAlMjAlMjAlMjBsb2NhdGlvbiUyMCUzRCUyMCUyN2h0dHBzJTNBJTJGJTJGd3d3LnRhdHZpYy5jb20lMkZ3cC1jb250ZW50JTJGdXBsb2FkcyUyRjIwMjIlMkYwNiUyRkFCLVRlc3RpbmctRUJvb2tfUjIucGRmJTI3JTNCJTBBJTIwJTIwJTIwJTIwJTdEJTJDJTIwZmFsc2UlMjAlMjklM0IlMEElM0MlMkZzY3JpcHQlM0U=[/vc_raw_js][/vc_column][/vc_row]

BigQuery Integration with GA4. You heard it right, it’s FREE!

A buzz with the launch of Google Analytics 4 is the FREE integration of BigQuery with GA4 - the property. Earlier, BigQuery integration was available only to premium Google Analytics accounts. Now everyone who owns a Google Analytics 4 (GA4) property has, be it premium or standard, access to BigQuery. Let us discuss the use cases and benefits of integrating BigQuery with GA4.

We have heard a lot about GA4 and its features. If you haven’t already, you can refer to this blog and catch up. If you have, you can start planning your migration journey today!

What’s the big deal about BigQuery?

BigQuery is a cloud data warehouse that lets you store data and run queries on the stored datasets. BigQuery can import data from various sources like CSV files, JSON, Parquel, and such. It uses standard SQL for querying the data stored in its tables. You can process the data based on your business requirements. If you want to read more about BigQuery, refer to the blog here.

Why integrate BigQuery with GA4?

  • No sampling in the UA
    • With sampling, comes issues like missing out on an entire consolidated user scope level inferences/insights. There is an inability to apply basic filters as it increases the sampling percentage. We might break data into a shorter date range and then aggregate it for longer periods. That does not work well when we use it for user-scoped metrics. Given these limitations, we do not have any alternative to Universal Analytics. 
    • When we integrate the data into BigQuery, we get access to unsampled raw data. This enables us to extract any scoped dimension, or metric over any duration with no sampling issue, which helps generate rich insights.
  • Access to all event parameters
    • Google Analytics 4 has a limit of viewing 25 parameters with an event in its’ UI. But what do we do, when we need to view more parameters? Say, you need to pass 30 parameters with an event. BigQuery again helps us store additional parameters. The 5 additional parameters which we are not able to see on the UI, would also be available in BigQuery for us to slice and dice. How cool is that!
  • Create your channel grouping (like Universal Analytics) and use it for analysis
    • Universal Analytics allowed us to create custom channel groupings. We used to measure multiple metrics like conversions, engagement, acquisition, and such. Since Google Analytics 4 does not allow us to create custom channel grouping, we would miss seeing data in specific groups. 
    • For example, your organization might be grouping social media(Facebook, Instagram, etc.) spending as Social Paid (distinct from social organic) and you would be interested in knowing conversions, and engagement from that particular channel
    • In such scenarios, BigQuery with GA4 again can help your query with support data. You can generate insights on continuing campaigns pausing them, or spending more on those channels.
  • Visualize data in Power BI, Data Studio, Tableau
    • With BigQuery we have an abundance of data. It is important to visualize that data to generate meaningful insights. For example, you might keep a query ready or a table ready which you can use daily for data extraction. But what if you want to see some trends, the ratio of spends, and conversions over the period, filter out data as per requirement without being dependent on data engineer/query, etc? All these come in handy with the integration of BigQuery with tools like Data Studio, Tableau, and Power BI.

Use cases:

  • Store it in BigQuery and integrate it with offline data
    • With Google Analytics 4 (GA4) and BigQuery integration, we only have online data available. There would be instances where we would want to import offline data like an offline purchase or some PII information. Passing non-PII offline data with an import feature is not easy and we cannot have all data stored in Google Analytics 4. Also, we can not pass PII data to Google Analytics and hence BigQuery comes to the rescue.
    • We can combine any sort of offline data with Google Analytics 4 data in BigQuery or create pipelines to send Google Analytics 4 data to CRM. With this, you would be able to combine offline purchases with online journeys and then remarket customers accordingly. This will help us in narrowing down our target audience for campaigns/AB testing, etc.Online Offline Integration

Image 1:( Online Offline Integration)

  • Use BigQuery data as input to machine learning models and obtain predictive insights
    • Once we set up BigQuery, we can use online<>offline integrated data or only online data as input to various algorithms and generate actionable insights. You can use this data to run models like lead scoring, feature attribution, predictive analytics, etc. (add links if we have any). This will help you gauge insights like what is the probability of a user to purchase/convert, what is the lifetime value of a customer, etc.
Image 2: (Run ML Models)

With so many use cases and benefits that the integration brings in, you should be now looking forward to using BigQuery. ‘How do I link Google Analytics 4 to BigQuery?’ might be your next question. Here is a detailed guide on how you can get started with this integration.

We have a dedicated team of BigQuery experts helping 100+ clients bring in a powerful shift in their organizations with advanced analytics using BigQuery. Please reach out if you want to be one of them. We will be happy to assist!

Change the dimensions of your digital marketing funnel with DV360

If you trace business pressure in digital marketing, it is closely associated with the dawn of acronyms; which got increasingly obscure and confusing. It started with the good old PPC. Remember it was CPC and CPA morphed TROAS and ACOS. And then we have a dollop of ROS, RON, DMA, and IAB which we must deal with. While the conversation has become more interesting as we try to look more involved with each acronym; we should not blur out the fundamental problem. (Oh, by the way, there is a new acronym: DV360)

There is - the funnel - which we all have learned to love and live with. The funnel determines a lot of our marketing actions. The example of a funnel is shown here.  I do not think I have to even write a single line of description to tell anyone what this is all about. But, I will talk about DV360 in the later stages and how it can change the funnel.

A typical conversion funnel

This funnel is in a box. The box in which the funnel is determines the way we plan our marketing. We all know, that irrespective of how much we want to step outside the box, there is plenty of action in the box. It is this, which keeps us busy and active as we make Reports and Analysis. This is more valid when we are a small and medium agency.

One of the other challenges is that the small and medium agencies, at times do not have the resources, funds, or in some cases courage to step into the unknown areas.

What it takes to change the dimensions of the marketing funnel 

No marketer wants to fight hard at the bottom of the funnel, nor does she wants to spend millions with random targeting in the top end of the funnel.

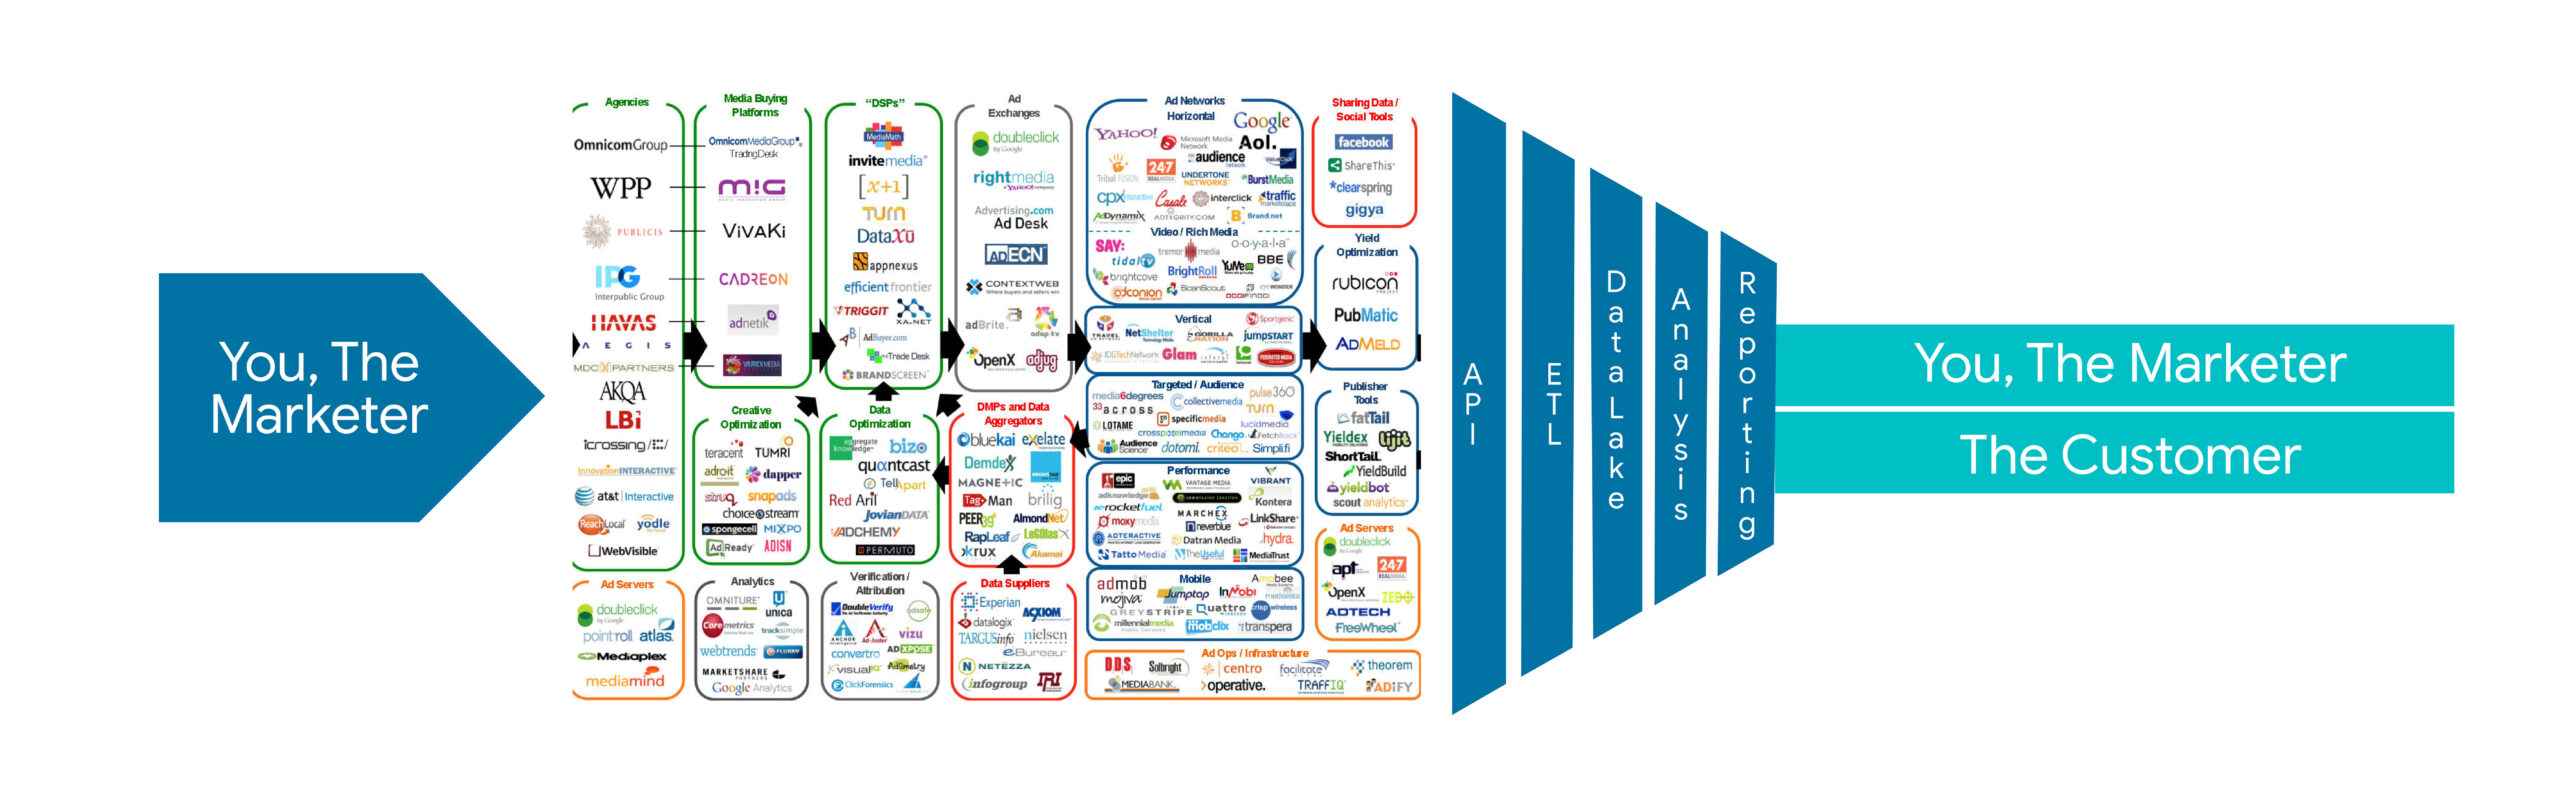
Marketers do not want to handle multiple tools, platforms, and reporting to get anywhere. It gets them into a situation like this.

Display advertising network ecosystem

We are a bunch of folks who are so busy trying to solve the customer’s problems and getting their sales right - and this is why we strongly suggest DV360!

Why we suggest DV360 - Redefine the acquisition funnel
Redefine the acquisition funnel

Change the size and shape of the funnel with DV360

Welcome to the world of powerful DSP with Display and Video 360.

While browsing, you must have noticed those inviting banner ads. That appear at random, persuading you to buy something you didn’t know existed? That’s what display ads are - and DV360 is exactly what marketers need to make this happen.

Did you know, that more than 90% of sites are accessible through DV360? And it is said to serve 90 billion impressions a day. We don’t know what counts as effective reach for advertising if that doesn’t.

This is the path to the largest inventory and more, including a reservoir of audiences, targeted marketing, private auctions, and programmatic guaranteed deals. You can fine-tune the pace and frequency, and choose formats from video to native…you just need one platform to provide value to the customer. All under your control and power.

Imagine, all those acronyms dissolving away with one single ‘red button’.

On a serious note, DV360 offers a large-scale reach so that your advertisements are visible to a wide audience whether your goal is to acquire new customers or increase brand awareness. 

The final conversion may take place through a click which may not get a direct attribution to this platform, but once the dimensions of the funnel are changed, you will visibly notice more conversions.

Check out our recent case study on DV360 - How our client achieved more than 10x growth in organic & direct traffic.

This is where we come in

The path to getting access to DV360 is strewn with hurdles like a commitment to spend a huge amount. Yes, a real huge amount which is a challenge when you are running a hyper-local campaign for a salon franchise in three states and twenty locations.

Tatvic, as one of the top Google Partners, provides you access and training to Display and Video 360 with no complex prerequisites or commitment to large budgets. The best part is we get you up and rolling in a short time…how does a week sound to you from the day you make the first call to us?

Good? Here is the email address where you can start from hello@tatvic.com

Firebase AB Testing Services for Smarter Android App Experiments

With Firebase, you can perform A/B testing in applications with minimal effort and better results. It’s a mighty easy platform.  

This is the second part of the series to guide you through set and Testing! Part 1- Ways to implement A/B tests in Firebase.

How to configure the A/B test?

We are starting with Firebase A/B testing using the Remote Config feature.

1. Set up the A/B test in the Firebase console

2. Click the A/B testing item from the left side menu and click the Create Experiment button.

Step 1 to configure AB Testing Console -  Click the A/B testing item from the left side menu and click the Create Experiment button.
Firebase A/B test console

3. The Popup box will ask to choose from- Remote Config, Notifications, or In-App Messaging to configure an A/B test. Since we will be configuring the test via config parameters select the Remote Config option.

Step 2 to configure AB Testing Console -  Click the A/B testing item from the left side menu and click the Create Experiment button.
Firebase A/B test experiment types

4. Create an experiment via Remote config:  

In the A/B test configuration screen, allow users to define and set up the A/B test with a couple of conditions and parameters to be satisfied. 

Here we’ll use the same parameters that were created in the “Set up Remote Config in Firebase console” section.

How to configure the A/B test in the Firebase console using Remote Config?

To configure the Firebase A/B Testing using Remote Configuration, follow the below step-by-step process:

Step 1: Provide the Experiment name and details: 

Create firebase remote config experiment

Step 2: Condition to target users

In this section, we need to select the app in which we need to activate this experiment.

Target Audience Apply for firebase A/B test


Here, for targeting, take All users to be eligible for an experiment based on the conditions we use.

Activation Event(Optional): 

An event that activates the experiment for a user. All targeted experiment users will receive an experiment variant treatment from the start of the experiment. Only those users who trigger the activation event will be included in the experiment measurement.

Firebase A/B test Activation event

Here, select Continue_Shopping(custom event) as an activation event to track how many users are clicking the shopping button, then click Next.

Step 3: Define Goals

Firebase A/B Test Primary Metric

By utilizing goal metrics (such as Crash-free users and user retention) plus maximum occurrences of events (such as daily user engagement, app_remove, first_open, and custom events). 

The goal will be deemed a metric that can be chosen for the variant that best achieves the experiment leader as the primary goal. Click Next.

Firebase A/B test Additional Metrics
  • Types of metrics to track 

Same as goals, there is a list of metrics available in the above screencap, at max 5 metrics can be used per A/B test. Distinct metrics as additional metrics (secondary goals) can be configured as compared to goals as secondary goals.

E.g. for the test experiment, we have set Purchase revenue as the primary metric and in additional metrics, we’ve selected other metrics

Firebase A/B Test Goal setup

Step 4: Select variants

By using the parameters that are defined in Set up Remote Config in the Firebase console section, multiple parameters are applied for variant setup with values for Control Group and Variants. Also, the A/B test has been configured as an alternative text and color shade for the shopping button.

  • Types of variants

The baseline indicates the App’s original view, whereas variants define the different variations to accomplish the goal. At max 7 variants are allowed for configuration.
Multivariate A/B tests can be achievable by adding parameters/clicking Choose or creating new.

Firebase A/B Test variants
  • Adjust variant weights

Variant weight refers to the distribution of variants to users. It will be in the form of a ratio among all variants.

Firebase A/B Test variants traffic allocation

Step 5: Click the Review button.

4.  Save the draft review it and test it in the testing environment

Test A/B test in Testing Environment

1. It’s the cherry on the cake.

Firebase leverages users to verify A/B tests in the device before making it live. Click AB test tab -> Select your AB test from the drafted section -> Open settings using 3 dots  -> Click

Manage test devices.

Run Firebase A/B testing on test device

2. Provide the device instance ID and select the variant that you want to test. To get Instance IDs for Android and iOS:

     a. Android snippet to fetch Instance ID as below:

    b. iOS snippet to fetch Instance ID as below:

3.  Add ID in the token box, and select the variant that you want to verify. Click on Save.

Run Firebase variant A/B test on test device

4.  Below are our example screens with changes visualized:

Firebase A/B Test Variant vs Baseline

Deploy Experiment in Live Environment

Yeah! It’s time to make experiments live across all users to provide easy access and engagement. It’ll help us in deciding whether to roll out the variation in the live environment or not.

  1. In the Firebase console, on the left side menu clicking the A/B Testing option will show a list of running experiments, drafted versions that are in review/testing environment, and completed A/B tests in case any.
  2. Our experiment will be visible in the Draft section as it is not yet published. Click the experiment title and open it. Experiments can start in two ways directly: one is from the Drafted section. Then, click the start menu.
  3. Firebase A/b Test starting to experiment
    Firebase A/b Test starting to experiment
  4. With this, we come to an end of our PART-2 of the Firebase: A/B testing series. In the next part, we will be covering Notification set-up, In-App messaging and exploring Multivariate A/B testing. Meanwhile, you can start implementing and reach out to us in case of additional queries at hello@tatvic.com. And we would be, as always, happy to help.

Leverage GA4 for Ecommerce Reporting & Tracking: Make the Best Decisions!

ECommerce reporting and insights with Google Analytics 4-

GA4 eCommerce reporting provides a detailed understanding of a user journey through your sales funnel. They also measure the impact of promotions and product placement on revenue and conversion rate.

If you run an eCommerce business, it is important to map your sales data against the average time spent on various sections of the website/app. Additionally, Google Analytics helps map product-wise categorizations to further analyze the eCommerce reports for website optimizations.

Google Analytics (GA4) will help you get these must-have insights sorted with its default reports. However, with a few schema differences between Universal Analytics and GA4, we recommend going through the Google Developers Guide first to ensure accurate set-up and data tracking.

Once you have high-level insights on revenue, you would also want to understand how users behave on your website before purchasing a product. For instance, ‘Did a user drop out of the journey after adding a product to the cart or before adding to the cart?’ What if you also want to understand some micro-level details - ‘Are users transacting more from mobile devices as compared to the desktop  in the evenings?’ 

Let us see how to use Google Analytics 4 to generate those insights. If you are aware, you can start planning your ga4 migration journey today!

Analyze Shopping Journey:

On arriving at your eStore, a user starts his journey by viewing a list of products/categories/items → navigating to item detail → adding an item to the cart → making a purchase.

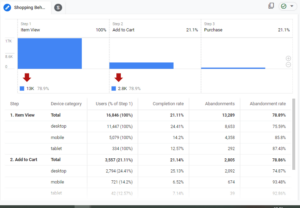
Check the funnel, which can help you analyze the ratios like product-view to transactions, add-to-cart to transactions, and such.

Google Analytics: Shopping Behavior Funnel
Shopping Behavior Funnel

Did you notice an additional dimension of the Device category? It helps generate insights like users with desktop devices have the highest completion rate of 24% and this is true for all the funnel steps.

Some strategic insights on remarketing can also be obtained via this Google Analytics report. For example, we can run specific campaigns to nudge users to add items in the cart through additional deals, if the ‘item-view’ to ‘add-to-cart’ ratio is low.

Once the user reaches the checkout stage, the probability of him purchasing increases. This is the time when you should focus on decreasing the time he spends on the checkout journey and make an immediate decision to purchase. The question is how do you understand which user goes through all steps of checkout or leaves it midway? To assess this, you might want to look into the checkout journey steps in detail.

Now let’s see how we can generate such insights with an eCommerce reporting feature.

Analyze Checkout Journey:

Let’s say we have analyzed shopping behavior and our cart additions have increased at a higher rate as compared to transactions. In this scenario, we need to analyze a user’s checkout behavior. 

There are several steps that a user takes between checkout and final purchase. These steps include adding personal information, shipping details, reviewing filled details, etc. The following funnel would give you a deeper understanding of the user’s checkout behavior:

eCommerce Reporting: Checkout Behavior Funnel
Checkout Behavior Funnel

The funnel here shows that maximum users are dropping off from step 3 - Review step. Based on this, we can decide if it is the number of steps in the checkout process hampering a user’s purchase intent or poor user experience. 

Decisions based on the funnel data can directly impact transactions and/or revenue.

When we look at the funnels above, one important point of consideration is user drop-off. There would be stages where you see huge drop-offs creating bottlenecks for the next steps. What would be your next action on this data?

Analyze Drop-offs:

Identifying a point from where a user drops off is an important area to look at. It creates a roadblock in the conversion/purchase journey. Each step will let you create a segment and then analyze those users or retarget them in marketing campaigns.

Google Analytics: Drop off Analysis
Drop off Analysis

Additionally, you can use other parameters (secondary dimensions) to dig deeper into the funnel. This will give you granular insights.

You might be interested in device-wise breakdown to analyze drop-off. Let’s consider that the completion rate of step 1 is the highest for desktops. Based on this, you can target customers for desktop with a higher campaign budget as compared to mobile. You can take a similar approach to the abandonment rate which is higher for mobile by adjusting your campaign spending or running more retargeting campaigns to improve overall performance.

The next important thing for a business is to be able to improve ROI based on optimized user targeting. For example - ‘How do you segment a customer as a loyal customer, is it based on frequency or value?’, ‘How would a particular segment of users impact the overall revenue?’ and so on.

Let’s understand the capabilities of GA4 in eCommerce Reporting.

Predictive Insights:

Predicting the effectiveness of your marketing spend is an important aspect and so is keeping an eye on the revenue. What if Google Analytics 4 makes your work easier? With the implementation of the purchase event in GA4, we can unlock the predictive metrics and machine learning capabilities. 

What benefits do we get by unlocking the predictive metrics?

  • Purchase Probability: The probability that a user who was active in the last 28 days will log a specific conversion event within the next 7 days.
  • Churn Probability: The probability that a user who was active on your app or site within the last 7 days will not be active within the next 7 days.
  • Revenue Prediction: The revenue expected from all purchase conversions within the next 28 days from a user who was active in the last 28 days.

With this, we will be able to set up predictive audiences.  For example, likely purchasers in the next 7 days and use them for remarketing. This eventually will help us optimize the marketing spend.

You can use these audiences for remarketing, directly. These audiences can be seen under Configure → Audiences tab

Google Analytics: Predictive Audiences
Predictive Audiences

You would also be interested in knowing what is the Customer Lifetime Value (CLV). User lifetime is a technique used to show how a user behaved on the website during his engagement period. Through eCommerce reporting, you can find insights like

  • Source/medium of users who contributed to the highest revenue
  • Active campaigns that brought more high-intent users in to make any adjustments in the campaign or run a new one on this segment
  • User insights like when a user was last engaged/purchased on app/site
eCommerce Reporting: User Lifetime Value
user-lifetime-value

Conclusion:

Google Analytics 4 lacks some standard eCommerce reports available in Universal Analytics. But, the built-in techniques available in the ‘Explore’ section come with more flexibility in measuring users’ journeys across various dimensions. It uses its predictive learning capabilities and machine learning to give you in-depth insights into the high-intent users eventually improving your Conversion Rate.

While Enhanced eCommerce for GA4 is constantly evolving, there is a rollout of a few basic reports but some advanced capabilities that users can start exploring for their business today.

Here’s a sneak peek of how eCommerce reporting in Google Analytics 4 is here to transform your overall business strategies and customer experience.

How to Enhance A/B Testing Reports with Google Analytics

To understand how to enhance A/B testing reports with Google Analytics, let’s briefly cover what A/B testing is and how Google Optimize will help us in A/B Testing.

Define AB Testing:

A/B Testing, also known as split testing, is an experiment for comparing two or more versions of web pages or apps to understand which version is performing better.  A/B testing is a method where two or more variants of a page or screen are shown to users on the basis of Audience definitions. Once the test is sent, statistical analysis determines which variant is performing better for a conversion goal defined.  

A/B testing will help us enable the data-backed decision for testing the website optimization and shifting the business decision from “This might help us achieve the goal” to “This will help us achieve our goal” 

So the major question now is, how do we proceed with A/B testing? There are various tools that help us with A/B Testing. This article focuses on one such tool called Google Optimize. 

We will cover: 

  • Brief on Google Optimize
  • How we enhance A/B testing and reporting with Google Optimize and Google Analytics linking.

How will Google Optimize help us in A/B Testing 

Google Optimize is an online A/B Testing tool that enables us to run experiments with various approaches to delivering content. Optimize allows us to 

  • Test variants of web pages and see how they perform against a specific objective
  • Monitor the results of your experiment and identify the leading variant 
  • Work on conversion rate optimization. 

There are four types of tests or experiments that can be performed in Google Optimize:

  1. A/B Testing
  2. Multivariate Test
  3. Redirect Test
  4. Personalization

1) A/B Testing

A/B testing is a randomized experiment using two or more variants of the same web page or app screen (Variant A and Variant B). Variant A is the original page and Variant B contains at least one variant that is modified from the original web page or screen.

2) Multivariate Testing

The test helps you understand the interactions between multiple sections of a page by testing them together in a coordinated way. 

In multivariate tests, testing is done for two or more variant elements simultaneously to see which combination creates the best outcome. It identifies the most effective variant of each element as well as analyzes the interactions between those elements.

3) Redirect Test

The test allows you to test separate web pages against each other. In redirect tests, variants are identified by URL or path instead of an element(s) on the page. It is useful when you want to test two very different landing pages or a complete redesign of the page.

4) Personalization Test

It includes a set of changes made to your website for a specific group of visitors. Unlike experiments, personalizations can run forever and don’t have variants. They’re a single set of changes served to anyone who meets the targeting conditions. 

Once we have found a leader in an experiment, we can deploy it to all of your visitors permanently, or use Optimize’s powerful targeting capabilities to tailor your website to a specific group of visitors.

How to read Optimize Reports?

With the Optimize interface, we can read reports of Conversion Rate (CVR) for both the original and variant versions with regard to each goal set. This particular data set is linked to Google Analytics.

Optimize Analysis Interface helps us with the probability of each variant to be best and decide the probability of variants to win

Let us proceed on understanding how we can enhance our A/B testing with Google Analytics (GA)

Use of Google Analytics Audiences for Google Optimize Experiments:

Google Optimize has the capability to target audiences based on Device category, User behavior, Geography, technology, and such. Then why should we use Google Analytics Audiences if we already have so many targeting options in Google Optimize? 

Let us take a use case to understand this better.

If we are targeting audiences directly from the Google Optimize interface, it will be based on the next actionable step taken by the users. For instance, if we are targeting web users from the Ahmedabad city location, Google Optimize will target the audiences based only on the current location (Ahmedabad)  and will not consider the past location. 

What if the users were in Ahmedabad in the past 30 days but their current location is now Mumbai? In such cases, Google Optimize will not show the experiment to such users. 

With Google Analytics Audiences, we can target audiences on the basis of past behavior with a 30 to 90 days lookback window. For instance, creating an audience for users who were in Ahmedabad in the past 30 days and then targeting them will serve the requirement. 

How to analyze Google Optimize experiments with Google Analytics Data? 

Optimizing reporting is fine but what if I want to analyze some more metrics for any micro business KPI?

Optimize provides us with an opportunity to analyze each variant’s data on GA. All you need to do is create a segment from the Optimize interface and use it in GA.


Once the segment is imported in GA, it can be used on all reports as per requirement, like user journey, interactions/clicks, pages, source/medium, etc. 

As an alternative, Google Analytics also has some session-scoped dimensions for optimizing tests which can be used for creating segment or custom reports.

  1. Experiment Name - User-generated name entered during experiment creation. e.g. “My Optimize Experiment”.
  2. Experiment ID - A unique ID is available in the information panel on the Optimize experiment details page. E.g. IzxbYxEfTeuq3bQqIAHB9g
  3. Experiment ID with Variant - The Experiment ID with the Variant ID appended to it. Available in the information panel on the Optimize experiment details page. e.g. IzxbYxEfTeuq3bQqIAHB9g:1

Let’s take an example to understand what Google Analytics is capable of when it comes to analyzing user journeys for any eCommerce transaction or specific conversion event.

For eCommerce conversion, finding drop-offs is quite easy with just an application of experiment segments on funnel reports. But what if you want to measure the conversions and drop-offs from a sticky CTA (that you have placed on the home page as your A/B test), how do we do that? 

Let’s see how we do that. 

Create a custom funnel with steps as per the journey and then apply the segment of experiment id with variant or Create sequential segments and apply them on the reports or charts.

When we talk about all tests, we see their reports on Optimize Interface and GA both. But with the Personalization test, optimization reports show no reports. So then how do we measure the impact of personalization tests? Google Analytics again!

Just use the audience that you have imported in Optimize as a segment in Google Analytics and analyze various reports’ basis hypotheses. All we need to do is replicate the conditions of tests in GA and we have the data with us.

Signing off…

We hope this clears up a few of your queries on how to enhance and analyze Google Optimize experiment reports from Google Analytics UI as well as Google Optimize UI. We have additional useful information if you need to deep dive further, Tatvic’ has a Solution from Google Marketing Platform for Google Optimize 360. You may also comment and send queries.

AB Testing Implementation Services: Benefits & Mistakes to Avoid

Data is science, as against intuition, which is a feeling and is subjective. Business decisions today are made on objective information: the data. But knowing which data to focus on is a decision. A/B testing is one such exercise that helps in making that choice before we commit all our efforts and resources to one option.

Understanding A/B Testing:

A/B testing is a user experience research methodology. A/B tests consist of a randomized experiment with two (sometimes more) variants, A and B. Through A/B testing, we use customers’ data to set two different versions of digital property like website, landing page, ads against each other to see which attracts more positive actions. It can be time-consuming but the advantages you get will outweigh the time that you have invested. By default, the A/B test divides the traffic into 50-50 between the original and the variant.

How A/B test works
How A/B test works

Benefits of A/B testing

A/B testing advantages

How does the A/B test work?

One of the most important things in the A/B test is to decide what you want to test. Let’s say you want to test your ‘call-to-action’ button.

You want to show half of your visitors a Red login button and half of the visitors a Blue login button. The changes can be anything i.e CTA change, text change, page redesign, image change, banner change, etc.

The next step is to select the audience targeting (% of the audience that can see each set of variations) By default, the A/B test divides the traffic to 50-50 between original and variant.

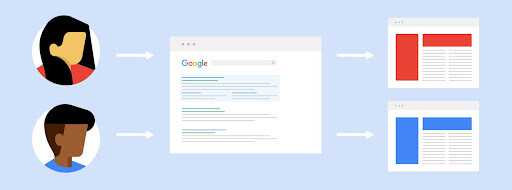
A/B testing will show the two versions of the same website to different visitors randomly. One version is original and another is the variation where the changes are made.  After the test runs for a certain period of time,  you will get to know which variant resulted in more conversion.

Original Page:
Original Page:
Variant Page:
Variant Page:

The color of the subscribe button is a  basic example for understanding.  In reality, you might not be testing just the color but also the size, the text, the typeface, and the font size. 

Many managers run sequential tests for say size first, then color, typeface, and such. As managers want to combine the best of each test as the final result. But not all agree on this strategy.  Because it does not measure what happens when all selected factors interact in one single window.

Anyway, let’s continue understanding How-to implement your first A/B test.

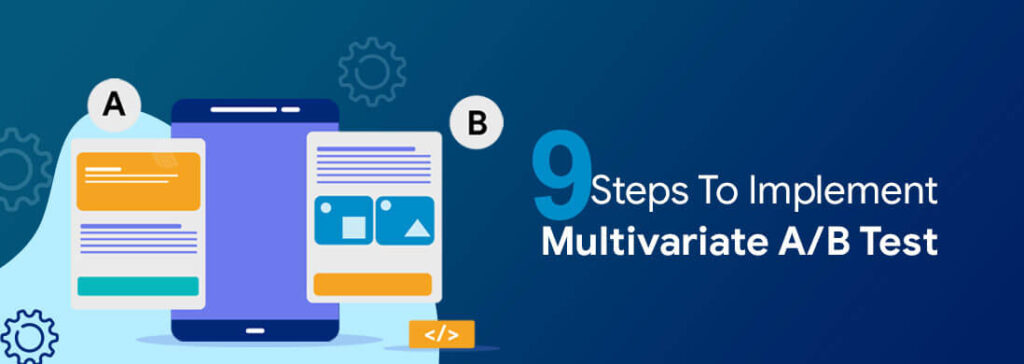
9 Steps to implement Multivariate Test (MVT)

Step 1:

Go to your optimize account and create your container to run the experiment.

Step 2:

Click on the create experience CTA and enter the experiment name and editor page url.

Step 3:

Select Multivariate test in the type of experience

Create Multivariate Experience

Step 4:

Now start creating the variants in the draft mode from here.

Step 5:

To create the variant, click on add variant under each section and enter the name of the variant 

Add Variant
Add Variant

Step 6:

Click on the edit option to open the editor window and make the changes as per your requirement and then click on save and then done.

Edit your changes
Edit your changes

Step 7:

Select the combination tab to see all the combinations that will be tested and Click the preview to see the specific combination

Different combinations

Step 8:

Once you are done with the configuration part,  you can configure the objectives, page targeting, and audience targeting.

Step 9:

Next. choose the activation event for your experiment and you are ready to go!

Screenshot of Original page:

Variation A1B1

Screenshot of combination (A1B1)

Variation A0B1

Screenshot of combination (A0B1)

Best elements you can A/B test

Elements to A/B test

Best practices for the A/B test:

Examine the behavior of your visitors to prepare optimization hypotheses. Make sure you target the correct audience. For better reliable results, don’t make or add any changes in the running test as your one change will be responsible for the change in the conversion.

A word caution: A/B tests are the most basic form of randomized studies and experiments. Simple randomized controlled experiments consist of two treatments, one of which acts as the control for the other. As with all randomized controlled experiments, you must estimate the threshold size necessary to achieve statistical significance.

A/B testing mistakes to avoid:

  • Invalid hypothesis for A/B test
  • To change the experiment settings or to add the new changes in the running tests.
  • If you have plenty of pages then it might be possible that you test the wrong page.
  • To run too many tests. Multiple results will add to the confusion.

Stay tuned! In our next release, we will share our thoughts about Firebase A/B testing in Mobile apps! Yes, because of Firebase it is easy to change app behavior and appearance of apps without requiring users to download an app update.

What are the Reasons to Consider for Migrating To GA4?

Earlier in 2020 Google launched a new version of Google Analytics which is GA4 aka App + Web Property. The new GA4 comes with more flexibility and an ability to better understand users’ journey across online interactions through the use of predictive metrics and machine learning. This means GA will focus on the user, irrespective of the device or platform. The insights derived from GA4 will benefit your business after an initial minor investment for migrating to GA4.

While businesses would continue to use the existing version of Google Analytics (aka. Universal Analytics), you must know why GA4 migration is worth the effort.

However, to get to that point, we want to stress the importance of not putting off the GA4 migration. Even if you’ve gotten started, it may take between six to twelve months (or longer) for GA4 to be your source of truth. Like Universal Analytics, tracking and configuration cannot be applied retroactively (at least for most of the part) so you could be missing out on valuable data. The longer you take to plan and implement, the longer it will be before you can reap the full benefits of GA4. As we know, the complete transformation to GA4 is on the horizon. If not immediately, eventually yes. 

Having said that, we recommend figuring out a plan for the migration and fitting it into your roadmap and/or budget. The more you plan now, the less rework there will be later. To make your migration decision a bit easier we have prepared a flow that might help you decide when your organization should consider migrating to GA4.

Reasons why to consider Migrating to GA4

There are instances where immediate migration might not be feasible owing to factors like resource crunch, lack of capabilities, or even digital maturity of an organization. However, in such cases, we would suggest planning at least a dual step up so that the data starts getting collected in the GA4 property as well and we are future-ready to make the shift when the time comes. 

It will be a while before GA4 becomes your source of truth. You need to build it up and get accustomed to using it, just like you did with Google Analytics the first (or few) time(s) around. There’s no rush to make GA4 your single source of truth right away, but we can work towards that starting today.

In case you have any questions related to your GA4 Migration for your organization, you can talk to us at hello@tatvic.com.

Infographic: UA VS GA4. What’s NEW

[vc_row][vc_column][vc_column_text]Organizations globally rely on Google Analytics to better understand their online business and create optimal experiences for their customers. Launched in Oct 2020, Google Analytics 4 is the new Google Analytics after Urchin, Classic and Universal in response to changing dynamics in technology, behaviour and regulations.

In fact, GA4 is not an improved version of Universal Analytics but it’s a totally new platform designed to be more scalable and more privacy-centric. But what makes it so different from Universal Analytics?

Updated as on December 2021

PROPERTY SETTINGS
Use Case UA Property GA4 Property Additional Details
Data Model Session based Event based
User Metric Calculation Defines users as total users (new & returning) Defines users as active users
User access Management: Providing Access for GA data to users
Create & Modify events Ability to add additional events tracking, create & modify events inside the interface
Filter data to include or exclude specific criteria
Delete unwanted data from processed data set In UA, Manual request for data deletion is required In GA4, we can set up data deletion in interface itself and scope them to all data/events to detailed parameter values
Setup Cross-domain tracking in the User Interface In UA, can only be done via GTM
In GA4, there is an ability to setup in UI itself
User-ID tracking & Google Signals
Custom Dimensions & Metrics In UA, setting up a custom dimension or metric requires both UI and GTM implementation. In GA4, you can set up custom dimensions/metrics using parameters as
Calculated Metrics
Unsampled data In UA, Sampling occurs in reports where advanced segments, dimensions are used, 360 only. In GA4, all standard reports unsampled however, explore reports sampling depends on hit volume
Data import
Measurement Protocol GA4 adds additional security to data by requiring a security key to send MP data
PRODUCT INTEGRATION
Big Query
(360 only)
In GA4, BigQuery linking is available for free to all users.
Google Ads In UA and GA4 both, linking requires the user to have admin access
Display & Video 360 Linking
(360 only)
In UA, Linking requires a request to the DV360 admin to approve.
Search Ads 360 Linking
(360 only)
Roadmap In UA, Linking requires a request to the DV360 admin to approve.
Campaign Manager 360 Linking
(360 only)
In UA, Linking requires a request to the DV360 admin to approve.
Search Console integration
Optimize Linking Admin access required on both products.
Salesforce Cloud Integration
(360 only)
Admin access required on both products.
REPORTING
Machine Learning powered insights UA is limited to system provided insights only. GA4 has both system provided and custom insights
Ability to see website data in real time GA4 is more advanced - You can get detailed insight into event and parameter level granularity
Customize reporting with dashboards and custom reports Both UA and GA4 can connect natively to Data Studio. 2 GA4 has an advanced feature of creating customized reports in the ‘Explore’ section.
Overview of key KPIs across your data in “Home” report
Reports on acquisition by campaign, GA4 has new concept of user acquisition reports
source, and medium
Report on Ecommerce specific use cases GA4 allows you to create ecommerce funnel reporting via Explore
Goals / Conversions reporting In UA, limit of 20 goals per view. In GA4, conversions replace goals, 30 conversions per property
Report on advertising integrations
Multi Channel Funnels
Report on information about site users such as demographics & interests, technology, geography, and more
Debug implementation details within the reporting GA4 has ability to view new implementation changes easily without waiting for reports to populate
interface
Report on user actions across devices In UA, it is only a small part of reports. In GA4, it is cross-device tracking as a whole based on user
Data-driven Attribution
(360 only)
In UA, this is available as a feature - Multi channel funnels. In GA4, it is available for free with Attribution.
Segments to get a granular picture of user actions and behavior In UA, creating segments is available for use throughout the interface
In UA, you can create and store segments in the libraryIn GA4, segments are only available to be built and used in the Explore section.
In GA4, the limit to create segments is 10 only
EXPLORE
Free Form
(360 only)
Funnel
(360 only)
Segment Overlap
(360 only)
Path report GA4 has more functionality compared to Flow reports in 360
User explorer In GA4, it is a standalone technique offering advanced analysis capabilities
Cohort In UA, this is available in the reporting interface. In GA4, it is a standalone technique offering advanced analysis capabilities
User Time In UA, this is available in the reporting interface. In GA4, it is a standalone technique offering advanced analysis capabilities
Template In UA, this is available in the reporting interface. In GA4, it is a standalone technique offering advanced analysis capabilities

[/vc_column_text][/vc_column][/vc_row][vc_row height=”auto”][vc_column][vc_column_text]Go ahead and receive the download link of the infographic for later use.[/vc_column_text][us_btn link=”url:javascript%3Avoid(0)” el_class=”infograpicDownload” text=”Download infographic” color=”custom” bg_color=”#2d73c5″ text_color=”#ffffff”][/vc_column][/vc_row][vc_row height=”auto”][vc_column][vc_raw_html]JTNDZGl2JTIwaWQlM0QlMjJteU1vZGFsJTIyJTIwY2xhc3MlM0QlMjJuZXdtb2RhbCUyMiUzRSUwQSUwQSUyMCUyMCUzQyUyMS0tJTIwTW9kYWwlMjBjb250ZW50JTIwLS0lM0UlMEElMjAlMjAlM0NkaXYlMjBjbGFzcyUzRCUyMm5ld21vZGFsLWNvbnRlbnQlMjIlM0UlMEElMjAlMjAlMjAlMjAlM0NkaXYlMjBjbGFzcyUzRCUyMm5ld21vZGFsLWhlYWRlciUyMiUzRSUwQSUyMCUyMCUyMCUyMCUyMCUyMCUzQ3NwYW4lMjBjbGFzcyUzRCUyMm5ld2Nsb3NlJTIyJTNFJTI2dGltZXMlM0IlM0MlMkZzcGFuJTNFJTBBJTIwJTIwJTIwJTIwJTIwJTIwJTNDcCUyMGlkJTNEJTIydGl0bGUlMjIlM0UlM0MlMkZwJTNFJTBBJTIwJTIwJTIwJTIwJTNDJTJGZGl2JTNFJTBBJTIwJTIwJTIwJTIwJTNDZGl2JTIwY2xhc3MlM0QlMjJlbnRyeS1oZWFkJTIyJTNFJTBBJTIwJTIwJTIwJTIwJTIwJTIwJTNDcCUyMGNsYXNzJTNEJTIyZW50cnktbWVzc2FnZSUyMHRleHQtY2VudGVyJTIyJTNFJTNDJTJGcCUzRSUwQSUyMCUyMCUyMCUyMCUzQyUyRmRpdiUzRSUwQSUyMCUyMCUyMCUyMCUzQ2RpdiUyMGNsYXNzJTNEJTIybmV3bW9kYWwtYm9keSUyMiUzRSUwQSUyMCUyMCUyMCUyMCUyMCUyMCUyMCUzQ3AlMjBjbGFzcyUzRCUyMmJvbGQtaGVhZGluZyUyMHN1Yi1oZWFkaW5nJTIyJTNFJTIwUGxlYXNlJTIwZW50ZXIlMjB5b3VyJTIwZW1haWwlMjBpZCUyMHRvJTIwZG93bmxvYWQlMjBpbmZvZ3JhcGhpYy4lM0MlMkZwJTNFJTBBJTIwJTIwJTIwJTIwJTIwJTIwJTIwJTNDZGl2JTIwY2xhc3MlM0QlMjJmb3JtLWNsdXN0ZXIyJTIyJTNFJTBBJTIwJTIwJTIwJTIwJTIwJTIwJTIwJTIwJTIwJTIwJTIwJTVCY29udGFjdC1mb3JtLTclMjBpZCUzRCUyMjQ2NDY0JTIyJTIwdGl0bGUlM0QlMjJJbmZvZ3JhcGhpYyUyMERvd25sb2FkJTIyJTIwaHRtbF9pZCUzRCUyMmluZm9ncmFwaWNEb3dubG9hZCUyMiUyMGh0bWxfY2xhc3MlM0QlMjJmb3JtJTIwaW5mb2dyYXBoaWMlMjIlNUQlMEElMjAlMjAlMjAlMjAlMjAlMjAlMjAlM0MlMkZkaXYlM0UlMEElMjAlMjAlMjAlMjAlM0MlMkZkaXYlM0UlMEElMjAlMjAlMjAlM0NkaXYlMjBjbGFzcyUzRCUyMm5ld21vZGFsLWZvb3RlciUyMiUzRSUwQSUyMCUyMCUyMCUyMCUzQyUyRmRpdiUzRSUwQSUyMCUyMCUzQyUyRmRpdiUzRSUwQSUwQSUzQyUyRmRpdiUzRSUwQSUwQSUzQ2RpdiUyMGlkJTNEJTIydGhhbmt5b3VNb2RhbCUyMiUyMGNsYXNzJTNEJTIybmV3bW9kYWwlMjIlM0UlMEElMEElMjAlM0MlMjEtLSUyME1vZGFsJTIwY29udGVudCUyMC0tJTNFJTBBJTIwJTIwJTNDZGl2JTIwY2xhc3MlM0QlMjJuZXdtb2RhbC1jb250ZW50JTIyJTNFJTBBJTIwJTIwJTIwJTIwJTNDZGl2JTIwY2xhc3MlM0QlMjJuZXdtb2RhbC1oZWFkZXIlMjIlM0UlMEElMjAlMjAlMjAlMjAlMjAlMjAlM0NzcGFuJTIwaWQlM0QlMjJ0aGFua3lvdUNsb3NlJTIyJTIwY2xhc3MlM0QlMjJ0aGFua3lvdUNsb3NlJTIyJTNFJTI2dGltZXMlM0IlM0MlMkZzcGFuJTNFJTBBJTIwJTIwJTIwJTIwJTIwJTIwJTIwJTNDcCUyMGlkJTNEJTIydGhhbmtzVGl0bGUlMjIlM0VUaGFuayUyMFlvdSUyMSUzQyUyRnAlM0UlMEElMjAlMjAlMjAlMjAlM0MlMkZkaXYlM0UlMEElMjAlMjAlMjAlMjAlMEElMjAlMjAlM0NkaXYlMjBjbGFzcyUzRCUyMm5ld21vZGFsLWJvZHklMjIlM0UlMEElMjAlMjAlMjAlM0NkaXYlMjBzdHlsZSUzRCUyMnRleHQtYWxpZ24lM0FjZW50ZXIlM0JtYXJnaW4tdG9wJTNBJTIwMjBweCUzQiUyMiUzRSUwQSUyMCUyMCUyMCUzQ3NwYW4lMjBzdHlsZSUzRCUyMmZvbnQtc2l6ZSUzQSUyMDIwcHglM0IlMjIlM0VUaGFuayUyMHlvdSUyMCUzQ3NwYW4lMjBpZCUzRCUyMmQtbmFtZSUyMiUyMGNsYXNzJTNEJTIydGhua3VoMSUyMiUyMHN0eWxlJTNEJTIybGluZS1oZWlnaHQlM0ElMjAxJTIwJTIxaW1wb3J0YW50JTNCbWFyZ2luLXRvcCUzQSUyMDIwcHglM0Jmb250LXdlaWdodCUzQSUyMDQwMCUzQiUyMiUzRSUzQyUyRnNwYW4lM0UlMjBmb3IlMjB3cml0aW5nJTIwdG8lMjB1cy4lM0MlMkZzcGFuJTNFJTBBJTIwJTIwJTBBJTIwJTIwJTIwJTNDZGl2JTIwY2xhc3MlM0QlMjJ0aGFua3VNc2clMjIlMjBzdHlsZSUzRCUyMm1hcmdpbi10b3AlM0ElMjAyMHB4JTNCbWFyZ2luLWJvdHRvbSUzQSUyMDIwcHglM0JwYWRkaW5nJTNBJTIwMTVweCUzQiUyMiUzRVdlJTI3dmUlMjByZWNlaXZlZCUyMHlvdXIlMjByZXF1ZXN0JTIwZm9yJTIwZnJlZSUyMCUzQ3NwYW4lMjBpZCUzRCUyMmZyZWUtdHlwZSUyMiUzRSUzQyUyRnNwYW4lM0UlM0NiciUzRSUwQSUyMCUyMCUyMCUyME91ciUyMHRlYW0lMjB3aWxsJTIwZ2V0JTIwYmFjayUyMHRvJTIweW91JTIwd2l0aGluJTIwMSUyMGJ1c2luZXNzJTIwZGF5LiUzQyUyRmRpdiUzRSUwQSUyMCUyMCUyMCUyMCUwQSUyMCUyMCUzQyUyRmRpdiUzRSUwQSUyMCUyMCUzQyUyRmRpdiUzRSUwQSUyMCUzQyUyRmRpdiUzRSUwQSUyMCUzQyUyRmRpdiUzRQ==[/vc_raw_html][/vc_column][/vc_row][vc_row height=”auto”][vc_column][vc_raw_js]JTNDc2NyaXB0JTNFJTBBJTBBdmFyJTIwdHZjTW9kYWxGbGFnJTIwJTNEJTIwZmFsc2UlM0IlMEFqUXVlcnklMjglMjIuaW5mb2dyYXBpY0Rvd25sb2FkJTIyJTI5LmNsaWNrJTI4ZnVuY3Rpb24lMjglMjklN0IlMEFldmVudC5wcmV2ZW50RGVmYXVsdCUyOCUyOSUzQiUwQW1vZGFsLnN0eWxlLmRpc3BsYXklMjAlM0QlMjAlMjJibG9jayUyMiUzQiUwQSU3RCUyOSUzQiUwQSUwQXZhciUyMG1vZGFsJTIwJTNEJTIwZG9jdW1lbnQuZ2V0RWxlbWVudEJ5SWQlMjglMjdteU1vZGFsJTI3JTI5JTNCJTBBJTBBdmFyJTIwc3BhbiUyMCUzRCUyMGRvY3VtZW50LmdldEVsZW1lbnRzQnlDbGFzc05hbWUlMjglMjJuZXdjbG9zZSUyMiUyOSU1QjAlNUQlM0IlMEElMEF2YXIlMjBtb2RhbDIlMjAlM0QlMjBkb2N1bWVudC5nZXRFbGVtZW50QnlJZCUyOCUyN3RoYW5reW91TW9kYWwlMjclMjklM0IlMEF2YXIlMjBzcGFuMiUyMCUzRCUyMGRvY3VtZW50LmdldEVsZW1lbnRCeUlkJTI4JTIydGhhbmt5b3VDbG9zZSUyMiUyOSUzQiUwQSUwQSUwQXNwYW4ub25jbGljayUyMCUzRCUyMGZ1bmN0aW9uJTI4JTI5JTIwJTdCJTBBJTIwJTIwJTIwJTIwbW9kYWwuc3R5bGUuZGlzcGxheSUyMCUzRCUyMCUyMm5vbmUlMjIlM0IlMEElN0QlMEElMEF3aW5kb3cub25jbGljayUyMCUzRCUyMGZ1bmN0aW9uJTI4ZXZlbnQlMjklMjAlN0IlMEElMjAlMjAlMjAlMjBpZiUyMCUyOGV2ZW50LnRhcmdldCUyMCUzRCUzRCUyMG1vZGFsJTI5JTIwJTdCJTBBJTIwJTIwJTIwJTIwJTIwJTIwJTIwJTIwbW9kYWwuc3R5bGUuZGlzcGxheSUyMCUzRCUyMCUyMm5vbmUlMjIlM0IlMEElMjAlMjAlMjAlMjAlN0QlMEElMjAlMjAlMjAlMjBlbHNlJTIwaWYlMjhldmVudC50YXJnZXQlMjAlM0QlM0QlMjBtb2RhbDIlMjklN0IlMEElMjAlMjAlMjAlMjAlMjAlMjBtb2RhbDIuc3R5bGUuZGlzcGxheSUyMCUzRCUyMCUyMm5vbmUlMjIlM0IlMEElMjAlMjAlMjAlMjAlN0QlMEElMjAlMjAlMjAlMjAlMEElN0QlMEElMEFzcGFuMi5vbmNsaWNrJTIwJTNEJTIwZnVuY3Rpb24lMjglMjklMjAlN0IlMEElMjAlMjAlMjAlMjBtb2RhbDIuc3R5bGUuZGlzcGxheSUyMCUzRCUyMCUyMm5vbmUlMjIlM0IlMEElN0QlMEFkb2N1bWVudC5hZGRFdmVudExpc3RlbmVyJTI4JTIwJTI3d3BjZjdtYWlsc2VudCUyNyUyQyUyMGZ1bmN0aW9uJTI4JTIwZXZlbnQlMjAlMjklMjAlN0IlMEElMjAlMjAlMjAlMjBsb2NhdGlvbiUyMCUzRCUyMCUyN2h0dHBzJTNBJTJGJTJGd3d3LnRhdHZpYy5jb20lMkZ3cC1jb250ZW50JTJGdXBsb2FkcyUyRjIwMTclMkYwMiUyRkJsb2ctSW5mb2dyYXBoaWNfRmluYWwucGRmJTI3JTNCJTBBJTIwJTIwJTIwJTIwJTdEJTJDJTIwZmFsc2UlMjAlMjklM0IlMEElM0MlMkZzY3JpcHQlM0U=[/vc_raw_js][/vc_column][/vc_row]

Bot Icon
Bot Icon

Tatvic Bot

Explore About Tatvic and Services