Hello There!

Lorem ipsum dolor sit amet, consectetur adipiscing elit,

Website Redesign Analytics: What Breaks and How to Fix It

What Happens to Your Analytics When Your Website Gets Redesigned

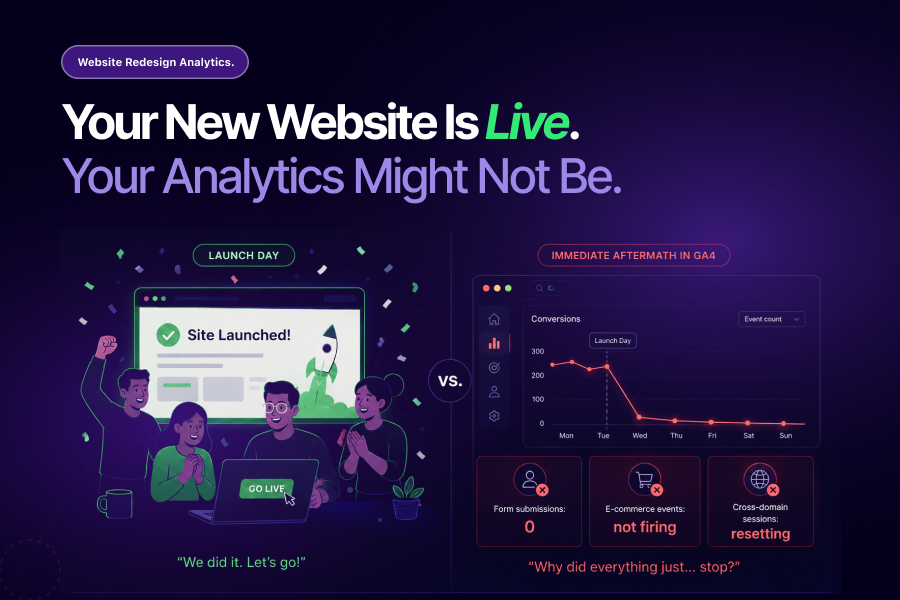
A website redesign is one of the most celebrated moments in any digital team’s calendar. Months of work, new design, improved UX, faster load times, and a launch day that everyone has been counting down to. What rarely makes it onto the launch day checklist: a comprehensive plan for what happens to your GA4 data when the new site goes live.

Website redesign analytics failures are the most predictable type of tracking failure in digital measurement. They happen on a regular cycle, they follow the same patterns every time, and they are rarely caught until after the damage is done.

This blog covers exactly what breaks, why it goes undetected, and what a proactive website redesign analytics plan looks like before, during, and after launch.

Why Website Redesigns Hit Analytics Harder Than Anything Else

According to Gartner research cited by HubSpot, 71% of marketing leaders redesign their websites every one to three years. For most businesses, a redesign is not a rare event. It is a regular part of the digital calendar.

And yet, most redesigns treat analytics as an afterthought rather than a core workstream. Teams launch under pressure, cutting corners and skipping the validation steps that website redesign analytics depends on.

Here is what makes a redesign uniquely dangerous for GA4 data:

  • Every page URL may change, breaking historical traffic data continuity
  • New page structures invalidate existing GTM triggers and event configurations
  • Updated CSS classes and button IDs break click tracking that relied on the old code
  • Redirects strip UTM parameters, disrupting campaign attribution
  • New checkout flows and form designs require conversion tracking to be rebuilt from scratch
  • Staging environments rarely match production, so QA on staging misses production-specific failures

Each of these is a website redesign analytics risk that can exist silently for weeks after launch. None of them announce themselves in your GA4 dashboard. Your reports still populate. Your dashboards still update. The numbers are just wrong.
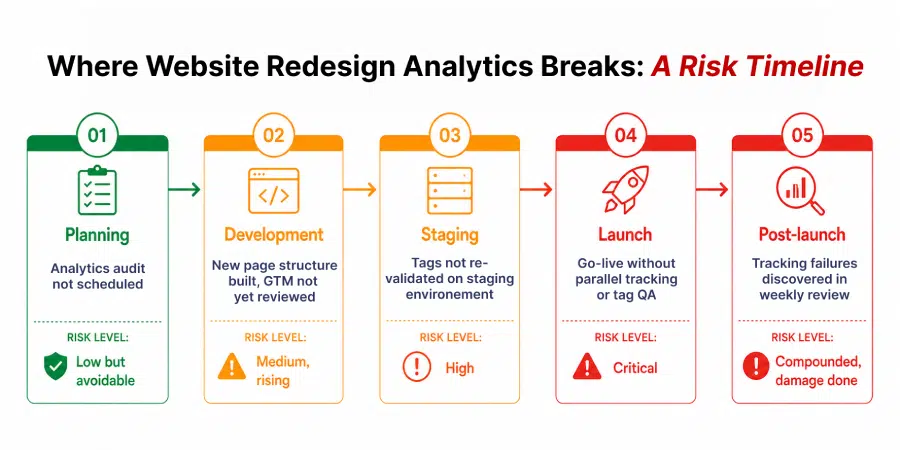
The Five Things That Break Most Often

Understanding where website redesign analytics fails most predictably is the first step toward preventing it.

1. Conversion Event Tracking

This is the highest-risk area in any redesign. Conversion events in GA4 are triggered by specific user actions: form submissions, button clicks, purchase completions, file downloads. When a redesign changes the structure of the page those events sit on, the triggers that fire them often stop working.

A “Contact Us” form that previously triggered a GA4 event on submission now uses a different form library after the redesign. The old GTM trigger looks for the previous form ID. The new form loads differently. The conversion event stops firing. GA4 records zero form submissions. The marketing team assumes campaign performance has dropped. Budget decisions follow.

2. GTM Container Conflicts

Most websites accumulate GTM tags over time. A redesign is often treated as a clean slate for the site but not for the GTM container that runs on it. Old tags left in the container, triggers pointing to page elements that no longer exist, and variables that reference deprecated code all create conflicts that degrade website redesign analytics reliability without any single obvious failure point.

Tatvic’s AI-powered GTM health monitoring specifically addresses this layer, auditing container health continuously rather than waiting for an annual cleanup to surface the same issues.

3. URL Structure Changes Breaking Historical Data

A redesign often consolidates, restructures, or renames URL paths. When this happens without careful redirect mapping, old URLs return 404 errors or redirect incorrectly. GA4’s historical data for those pages becomes disconnected from the new URL structure. Year-over-year comparisons break. Landing page performance reports become unreliable. Attribution for organic traffic is disrupted.

This is one of the most common website redesign analytics failures and one of the most underestimated in its downstream impact.

4. Cross-Domain and Subdomain Tracking Gaps

Many redesigns involve structural changes to how domains and subdomains are organized. A new checkout experience on a subdomain, a migrated blog, or a consolidated domain structure all require cross-domain tracking in GA4 to be reconfigured. 

When it is not, sessions reset at domain boundaries. Users who move from the main site to a checkout subdomain appear to arrive at the checkout as direct traffic, breaking the attribution chain that links the original campaign to the eventual conversion.

5. Enhanced E-commerce Tracking Failures

For e-commerce businesses, a redesign that updates the checkout flow almost always requires enhanced e-commerce tracking to be rebuilt. Product views, add-to-cart events, checkout steps, and purchase events all depend on the specific structure of the checkout pages they sit on. 

When those pages change, the data layer schema often changes with them. Revenue tracking breaks. Product performance data disappears. The business makes merchandising and campaign decisions on an incomplete picture.

Planning a website redesign and want to make sure your GA4 setup survives it?

Talk to Tatvic’s analytics team before your redesign begins, not after it launches.

Why Website Redesign Analytics Failures Stay Hidden

This is the question that most teams ask in retrospect: how did we not catch this sooner?

The answer is structural. Website redesign analytics failures share the same characteristics that make all silent data failures so expensive:

  • The reports still populate, just with wrong data
  • The numbers look plausible, just slightly different from before
  • The natural assumption is that any change is due to the new site, not broken tracking
  • The development team considers the launch successful if the site works
  • The analytics team is not always in the launch room

Redesigns also happen under pressure. When timelines slip, the last things cut are always the ones that are not immediately visible: QA processes, parallel tracking periods, and post-launch validation. These are also the things that website redesign analytics depends on most.

What Proactive Website Redesign Analytics Looks Like

A proactive approach to website redesign analytics is not a post-launch audit. It starts before the first wireframe is approved.

Before the redesign begins: 

GA4 audit. Document every event, every trigger, every conversion in your current setup. Know exactly what you are protecting before you change anything. This audit becomes the baseline that post-launch validation is measured against. Data sanity automation can run this baseline automatically, creating a documented record of expected event behaviour before the redesign begins.

During development:

Rebuild tracking in parallel. Do not wait until the new site is live to think about GA4. Rebuild your event tracking, GTM configuration, and conversion events in the staging environment. Validate every conversion event against the new page structure before launch day. Treat tracking validation as a go-live requirement, not a post-launch task.

At launch: 

Run parallel tracking. For a defined period after launch (ideally two to four weeks), run your old and new tracking configurations simultaneously where possible. This gives you a data quality comparison that identifies gaps the moment they appear rather than weeks later.

Post-launch: 

Reset anomaly detection baselines. A new site design will naturally change engagement patterns. Bounce rates, session durations, and conversion rates may all shift legitimately. Reset your anomaly detection baselines after launch so that genuine post-redesign behaviour changes do not trigger false alerts, and so that real tracking failures are not masked by expected metric movements.

Ongoing: 

Maintain a response playbook for tracking failures. As covered in An Alert Without a Playbook Is Just Noise, an alert without an owner and a response process is decorative. Define who owns tracking failures post-launch, what the response SLA is, and what the escalation path is when a conversion event goes silent.

The Pre-Launch Analytics Checklist
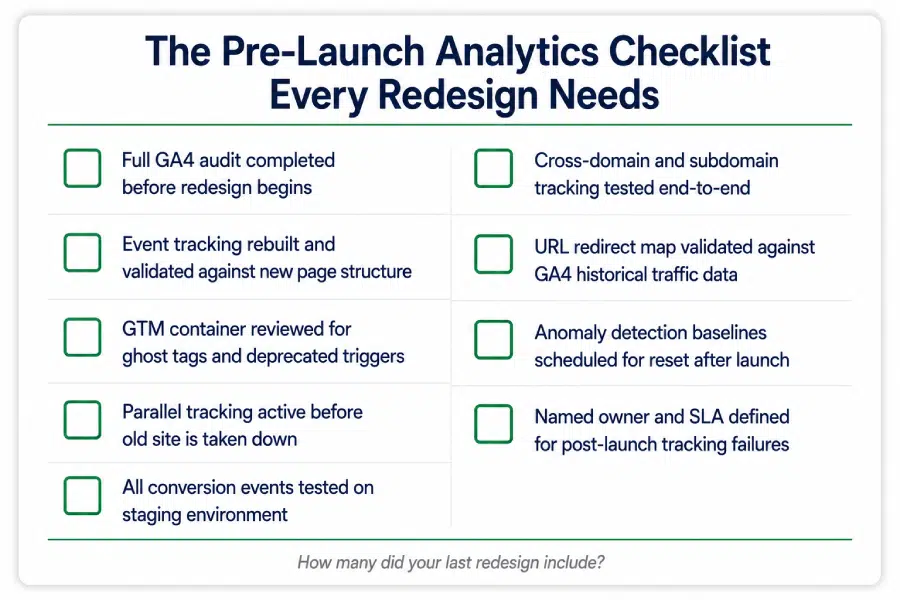
Before any redesigned site goes live, run through this:

  • Full GA4 audit completed and documented before redesign begins
  • Event tracking rebuilt and validated against the new page structure
  • GTM container reviewed for ghost tags, conflicts, and deprecated triggers
  • Parallel tracking active before the old site is taken down
  • All conversion events tested on the staging environment, not just the live site
  • Cross-domain and subdomain tracking reconfigured and tested end-to-end
  • URL redirect map validated against GA4 historical traffic data
  • Anomaly detection baselines scheduled for reset after launch
  • Named owner and response SLA defined for post-launch tracking failures

A redesign that launches without this checklist is not launching with confidence. It is launching with an unknown number of silent tracking failures waiting to be discovered.

The Takeaway

Website redesign analytics failures are not bad luck. They are the predictable outcome of treating analytics as a post-launch consideration rather than a launch requirement. 

The Forrester research on UX investment found that a seamless experience can boost conversion rates by up to 400%. A redesign that improves UX but breaks conversion tracking measures none of that improvement.

The businesses that get website redesign analytics right are not the ones with the most technical analytics teams. They are the ones that treat tracking validation with the same rigour as design QA, development QA, and performance testing. Because all of those only tell you whether the site works. Analytics tells you whether the decisions made from the site’s data can be trusted.

Already launched a redesigned site and not sure if your GA4 tracking is intact?

Tatvic’s team can run a full post-launch analytics audit across your event tracking, GTM configuration, and conversion events and tell you exactly what broke and what it has cost you. Schedule a call with Tatvic’s experts today.

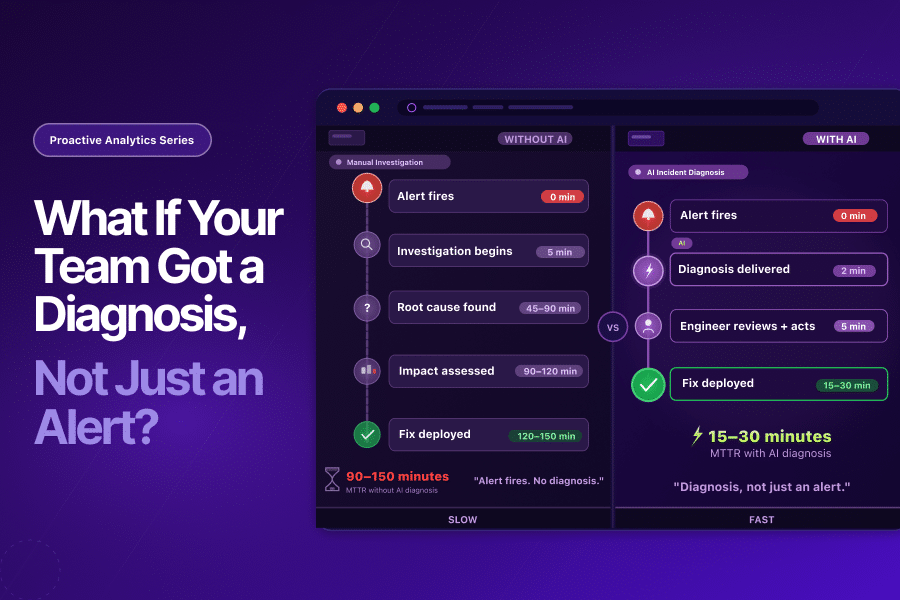
AI Incident Diagnosis: From Alert to Answer in Seconds

What If Your Team Got a Diagnosis, Not Just an Alert?

The pipeline was fixed. The bad data was caught.

Priya had navigated two back-to-back data incidents in as many weeks - a Monday morning pipeline failure, then a silent attribution error that nearly cost a high-performing campaign its budget. Both resolved. Both slower than they should have been.

Her senior data engineer, Rohan, had diagnosed both. He was methodical and experienced. But even Rohan had spent 40 minutes on the first and nearly two hours on the second.

Neither of those hours were spent fixing anything.

They were spent figuring out what to fix.

On a Thursday afternoon three weeks later, another alert fired. A DAG failure. 3:17 PM.

Rohan opened his laptop.

The Slack notification read: “Pipeline job failed.”

That was all it said.

He opened Cloud Logging in one tab. INFORMATION_SCHEMA in another. DAG run history in a third.

The investigation began.

According to Google’s Site Reliability Engineering guide, alerts that cannot be acted upon generate noise. The guidance is explicit: alerts should be actionable. An alert that tells you something failed - but not what, why, or what it affected - is not actionable. It is the beginning of a manual investigation.

This is the third problem most analytics teams do not solve.

Post 1 of this series covered pipeline failures - jobs that break before anyone notices.

Post 2 covered bad data - wrong numbers that reach dashboards silently.

This post covers what happens after both: the moment an alert fires, and what a team actually does with it.

An alert without context is just noise with urgency attached.

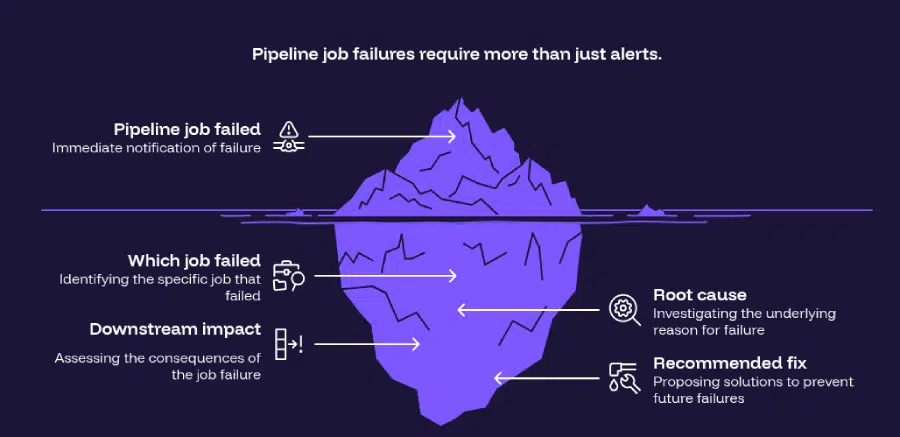
Today’s alerts are like smoke alarms. They tell you something is wrong. But they don’t tell you which room is burning, what caused it, who is inside, or whether the fire already spread.

AI incident diagnosis turns the smoke alarm into the fire chief’s report.

The Hidden Cost of the Alert-Without-Context Problem

Most analytics teams have monitoring. Cloud Composer surfaces DAG failures. Cloud Monitoring fires threshold alerts. Slack notifications trigger automatically.

The monitoring layer is working fine.

The problem is everything that happens after it fires.

When a data pipeline alert fires, the typical response looks like this:

  • Detection: An alert fires. The team is notified within minutes.
  • Triage: An engineer opens logs, job history, and pipeline metadata. 20 to 40 minutes.
  • Diagnosis: Root cause identified - quota exhaustion, schema drift, a late-arriving file. Another 15 to 30 minutes.
  • Impact assessment: Downstream tables checked. Affected dashboards identified. Business teams notified. 20 to 30 minutes more.
  • Resolution: Only now does the actual fix begin.

According to Monte Carlo’s State of Data Quality survey, data downtime nearly doubled year over year - driven by a 166% increase in time to resolution. 68% of data professionals report detection times of four hours or more. The investigation that follows the alert is where most of that time disappears.

The alert fires fast. The understanding comes slow.

That gap - between alert received and incident understood - is the actual problem.

Is your team spending more time diagnosing incidents than fixing them?

Tatvic helps GCP-first analytics teams compress incident response time with AI-powered diagnosis. Talk to an expert →

Why AI Incident Diagnosis Changes the Analytics Response Model

The SRE community has known for decades that incident response quality depends less on the speed of the alarm and more on the quality of information that follows it.

Google’s SRE incident management framework makes this explicit: automating root cause analysis and intelligent suggestion of mitigating actions frees engineers to focus on problem solving - not investigation.

Applied to data pipelines, this is precisely what AI incident diagnosis delivers.

An AI agent does not replace the engineer. It shows up to the incident having already done the first hour of work.

Here is what that looks like in practice:

What the Engineer Receives Today

“Pipeline job failed.”

  • No context on which task failed.
  • No information on why it failed.
  • No mapping of what broke downstream.
  • No recommended next action.

The engineer opens three tools and starts reading logs. The investigation begins with no context.

What AI Incident Diagnosis Delivers Instead

“Concurrent query quota exceeded at 3:17 PM.

Weekend attribution rebuild triggered 11 simultaneous transformation jobs, exhausting the project’s concurrent query limit.

Five downstream reporting tables are affected - campaign_performance_daily, attribution_model_v2, and three Looker datasets reading from them.

The marketing performance dashboard will surface stale data. Automatic retry scheduled for 4:00 AM. No manual intervention required unless business reporting window cannot accommodate the delay.”

Same alarm. Same trigger.

Zero minutes spent on manual investigation.

The engineer reads a structured report and decides whether to act - not where to start looking.

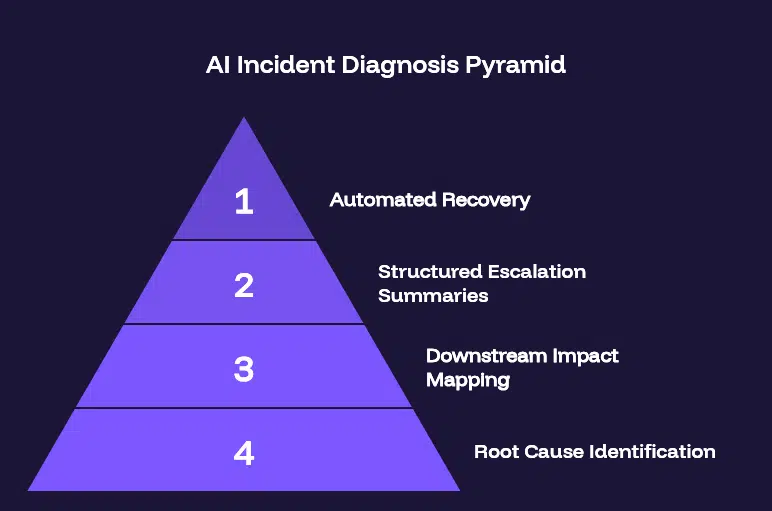
The Four Layers of AI Incident Diagnosis

AI incident diagnosis is not a single capability. It operates across four layers - each addressing a different dimension of the investigation that currently consumes engineering time.

Layer 1: Root Cause Identification

The agent correlates signals across Cloud Logging error traces, BigQuery INFORMATION_SCHEMA job metadata, DAG execution history, and upstream dependency behavior.

When a failure occurs, it immediately determines:

  • Was this quota exhaustion - and which job triggered the cascade?
  • Was it a schema change upstream that broke a downstream transformation?
  • Was it a missing file in GCS that caused a load job to fail?
  • Is this transient - safe to auto-retry - or structural, requiring human intervention?

Each failure type has a different fix. The agent identifies which one applies - and surfaces it with a recommended action - before a human opens a single log.

Layer 2: Downstream Impact Mapping

One failed job cascades into stale reporting tables, broken Looker datasets, and wrong dashboard metrics.

The agent maps these dependencies automatically. The impact report shows:

  • Which BigQuery tables ingested data from the failed job.
  • Which Looker datasets are reading from affected tables.
  • Which dashboards will surface wrong or stale data.
  • Which business teams are likely to open those dashboards - and when.

The on-call engineer does not start from zero. They receive a complete impact picture - and can prioritize response based on business urgency, not just technical severity.

Layer 3: Structured Escalation Summaries

Most incident alerts go to engineers. The impact lands on business stakeholders.

The agent generates two summaries automatically:

  • Technical summary: Root cause, affected tables, job history, retry status - for the engineering team.
  • Business summary: Which dashboards are affected, which metrics are stale, when resolution is expected - for the analytics manager to share upward.

The analytics manager no longer has to translate a technical failure into a business update under pressure. That translation happens in seconds.

Layer 4: Automated Recovery

For recoverable failures - quota exhaustion, retry sequencing, temporary upstream delays - the agent acts without waiting.

  • Failed jobs are queued for retry during off-peak windows.
  • Parallel queries are staggered to prevent quota re-exhaustion.
  • Data freshness is validated after recovery before reporting tables are promoted.
  • A recovery summary is sent when the pipeline is healthy again.

For incidents that require human intervention, the agent escalates with a full diagnostic package - not a raw alert.

The engineer arrives at the incident already knowing what they are dealing with.

What AI Incident Diagnosis Does to MTTR

Mean time to resolution measures the time from incident detection to full recovery. Most analytics teams track detection time and fix time. Almost none track the investigation time in between.

But investigation time is where most MTTR lives - the time spent understanding what failed before the fix can begin.

According to DORA’s 2024 State of DevOps Report, elite engineering teams maintain MTTR below 60 minutes, while low performers average over 24 hours. The gap is not how fast they fix things. It is how fast they understand what needs fixing.

AI incident diagnosis attacks MTTR at its largest component: the investigation window.

Without AI incident diagnosis:

  • Alert fires → investigation begins → root cause identified: 35 to 90 minutes.
  • Impact assessed → fix deployed: 60 to 150 minutes total.

With AI incident diagnosis:

  • Alert fires → diagnosis delivered automatically: 2 minutes.
  • Engineer reviews structured report → fix deployed or recovery confirmed: 10 to 30 minutes total.

The fix itself takes the same amount of time. The investigation window compresses from 60 to 90 minutes to near zero.

That compression is where AI incident diagnosis delivers its primary value.

How Tatvic Solves This in Real Analytics Environments

At Tatvic, we work with organizations where data pipeline incidents have direct business consequences - GA4 exports into BigQuery powering attribution models, Looker dashboards driving media decisions, performance reporting that leadership reads daily.

In these environments, the cost of a slow incident response is not just engineering hours:

  • A marketing team making spend decisions on stale attribution data.
  • An analytics manager on a call with leadership explaining why numbers changed overnight.
  • An executive presentation built on metrics that were wrong for 90 minutes before anyone knew.

In one Tatvic client environment, a pipeline incident during a high-spend media period went undetected for 47 minutes after the alert fired - because the alert email was buried. By the time investigation began, the media team had already made three budget reallocation decisions on stale conversion data. The pipeline failure lasted two hours. The downstream decisions had already been made.

Most GCP analytics teams Tatvic works with already have:

  • Cloud Composer for pipeline orchestration and DAG-level failure events.
  • Cloud Monitoring for metric threshold alerts.
  • Cloud Logging for error traces and execution history.

The alerting infrastructure is in place.

What is missing is the intelligence layer that interprets those alerts.

Tatvic’s Agentic AI monitoring layer adds exactly this. It sits above Cloud Composer and Cloud Monitoring - reading their signals together, correlating them, and producing a structured incident diagnosis at the moment the alert fires.

When a pipeline incident occurs, the system:

  • Identifies root cause automatically - quota exhaustion, schema drift, orchestration failure, or upstream data issue.
  • Maps downstream impact - which tables are stale, which dashboards are affected, which teams are at risk.
  • Generates a structured summary for both the engineering team and the analytics manager.
  • Executes automated recovery where possible and escalates with full diagnostic context where it cannot.

Rohan would not have spent 40 minutes on the Thursday alert.

He would have opened a structured report, confirmed the recommended recovery, and closed his laptop in under 10 minutes.

The alarm would have been the same. The response would have been unrecognizable.

AI Incident Diagnosis Is the Next Evolution in Data Ops

The analytics operations community has gone through two major reliability evolutions in the last decade.

  • Evolution 1 - Monitoring: Teams went from no visibility to alert coverage. Cloud Composer, Cloud Monitoring, and observability tools solved detection. Teams started knowing when things broke.
  • Evolution 2 - Data Observability: Teams went beyond infrastructure to data content. dbt tests, Great Expectations, and Dataplex solved validation. Teams started knowing when the data itself was wrong.
  • Evolution 3 is AI incident diagnosis.

The next improvement is not more alerts or more validation rules. It is intelligence that sits between detection and response - that takes the signal and produces the understanding before a human has to investigate.

Teams that adopt AI incident diagnosis shift from reactive to informed:

  • From: “Alarm received. Investigation begins. Root cause found in 60 minutes. Fix deployed.”
  • To: “Alarm received. Report delivered. Engineer reviews and acts. Fixed in 15 minutes.”

That shift is the difference between a team that burns senior engineer capacity on forensic investigation and one that redirects that capacity toward work that actually moves the business forward.

Key Takeaways

  • The alert is not the bottleneck. The investigation is. Most analytics teams spend 30 to 90 minutes diagnosing what failed before fixing anything - the alert fires fast, but understanding what it means comes slow.
  • Today’s alerts are like smoke alarms - they tell you something is wrong, but not which room is burning, what caused it, who is inside, or whether the fire already spread. AI incident diagnosis turns that smoke alarm into the fire chief’s report.
  • According to Monte Carlo’s State of Data Quality survey, data downtime nearly doubled year over year, driven by a 166% increase in time to resolution. The investigation window is where most of that time lives.
  • AI incident diagnosis compresses the investigation window - delivering root cause, downstream impact, and recommended fix at the moment the alert fires. The fix takes the same time. The understanding becomes near-instant.
  • According to DORA’s 2024 research, elite engineering teams maintain MTTR below 60 minutes. The gap versus low performers is not fix speed - it is understanding speed. AI incident diagnosis closes that gap.

Is Your Team Spending More Time Investigating Than Fixing?

If your engineers are opening logs and job histories every time an alert fires - spending the first hour of every incident figuring out what went wrong - the issue is not the alert. It is the absence of AI incident diagnosis.

Tatvic helps GCP-first analytics teams implement Agentic AI monitoring that delivers a structured incident diagnosis at the moment an alert fires - so engineers arrive at every incident already knowing the root cause, the downstream impact, and the recommended fix.

See what an AI-generated incident report would look like for your environment →

From Insight to Infrastructure: The Viral Execution Playbook for Modern Marketing Teams

Infrastructure-Led-Marketing-Alt

The Illusion of “More Content = More Impact”

Most marketing teams today don’t suffer from a lack of insights.
They suffer from a lack of coordinated execution at scale.

Over the course of this series, we’ve traced that problem to its root.

In Blog 1, we explored how insights die between data and creative translation, how the distance from analytics to execution bleeds clarity at every handoff. 

In Blog 2, we showed how discovery fragmented beyond SEO into GEO and AEO ecosystems, making audience intent harder to track but more important than ever.

In Blog 3, we uncovered decision debt, the accumulation of unanswered questions that delays action until trends expire inside organizations. 

In Blog 4, we explained why one signal demands multiple persona × intent interpretations, and why collapsing different motivations into one message quietly erodes relevance.

Each blog solved one part of the problem.

But even when teams fix discovery, speed, and interpretation, execution still breaks when scale enters the picture.

And this is where most playbooks stop short. They solve for speed, creativity, or personalization. Very few solve for what happens when all three need to work together, consistently, across channels, without creating internal chaos.

Virality doesn’t fail at the insight stage.
It fails at the infrastructure stage.

The Real Scaling Problem No One Talks About

Ask any marketing leader what “scaling” means, and you’ll hear variations of the same answer: more content, more campaigns, more channels.

Here’s the uncomfortable truth: more of those things rarely produces more impact.

In fact, scaling without structure often produces the opposite. The more teams accelerate output, the more fragmentation they introduce:

  • Approval bottlenecks slow campaigns that started fast
  • Version chaos leaves teams unsure of what’s live, what’s approved, and what’s outdated
  • Channel misalignment means the same insight gets executed five different ways across five teams
  • Measurement fragmentation makes it impossible to understand what’s actually working
  • Narrative inconsistency erodes brand trust over time

What starts as an effort to “scale content output” quietly becomes operational drag. The pipeline fills. The results thin. Teams work harder and impact compounds less.

This is the scaling paradox, and it’s the problem this final blog is built to address.

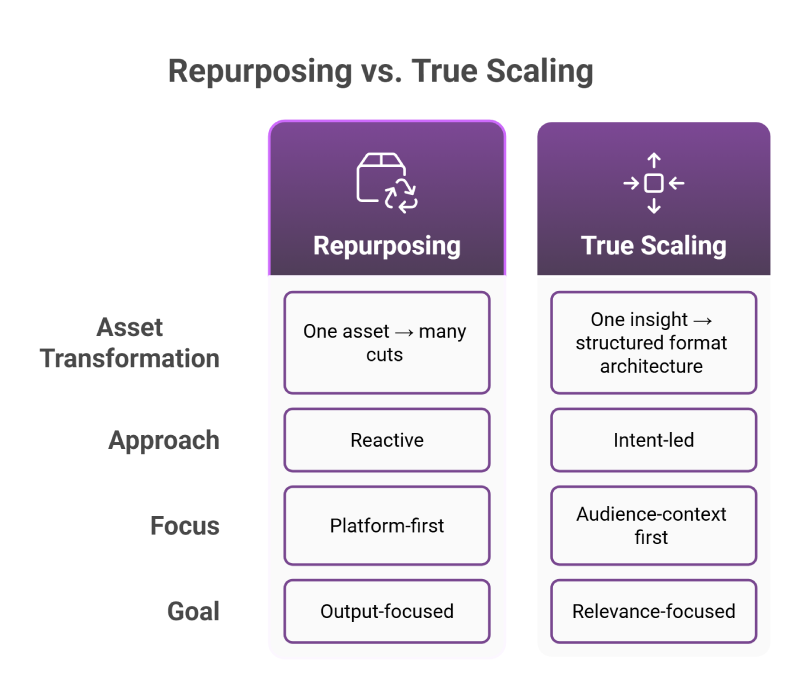
Why Repurposing Is Not a Viral Strategy

The go-to scaling solution for most teams is repurposing. Take one asset, cut it into multiple formats, and distribute across channels.

It’s efficient. It’s logical. And it rarely creates a compounding impact.

That’s because repurposing is reactive. It starts with an asset and asks, “Where else can this go?” True scaling starts with an insight and asks, “How should this be interpreted, structured, and distributed for maximum relevance across audiences?”

Blog 4 showed that one signal means multiple interpretations.
This blog explains how those interpretations scale without creating internal chaos.

The difference is structural. And structure, once built, compounds.

The Silent Fragmentation: Channel Silos Kill Momentum

Here’s a scenario most marketing leaders will recognize immediately.

An emerging trend surfaces, let’s say a behavioral shift in how consumers are talking about value versus price in the current economy. It’s a strong, timely signal. The team agrees it’s worth acting on.

Then it gets handed to four different teams.

  • The SEO team builds informational content around search queries related to “affordable alternatives” and “value for money.”
  • The social team creates trend-led creative around the cultural conversation memes, carousels, reactive posts.
  • The performance team develops conversion-focused ads emphasizing price comparison and savings.
  • The brand team crafts a storytelling narrative about the company’s values and long-term commitment to customers.

Each team works hard. Each execution is competent. But nothing connects. The audience encounters four different tones, four different messages, and no coherent story.

One insight. Four disconnected executions. Zero compounding impact.

This is channel fragmentation. It’s one of the quietest killers of viral momentum in modern marketing. The problem isn’t effort or quality, it’s the absence of coordination. When channels interpret signals independently, they don’t build on each other. They compete with each other.

Fragmentation reduces virality velocity.
And it’s almost entirely a structural problem which means it’s solvable.

The Viral Marketing Infrastructure Model

What modern marketing execution actually requires isn’t more output. It’s better architecture.

Here’s how that architecture breaks down into five distinct layers:

Layer 1 - Signal Intelligence

Trends now emerge simultaneously across AI-generated answers, search ecosystems, social feeds, community forums, and creator content. A signal that starts in one place migrates quickly.

This layer requires continuous listening not weekly trend reports, not platform-specific dashboards, but persistent monitoring across fragmented signals that synthesizes meaning before it disperses.

Layer 2 - Interpretation

Catching the signal early is only half of it. The second layer is knowing what to do with it.

This is where decision-readiness clarity and persona × intent mapping operate together. Brand relevance filtering removes what doesn’t fit. Intent mapping differentiates how the same signal lands differently across audiences. And decision clarity answers whether to act now, watch, or ignore entirely.

Layer 3 - Format Architecture (The layer most teams skip)

This is the most underrated layer and the one most directly responsible for whether scaling creates chaos or compound impact.

Not all formats serve the same purpose. Scaling works when formats are architected deliberately, not assigned reactively.

  • Authority Formats → long-form blogs, original research, thought leadership content - build trust and organic reach over time
  • Engagement Formats → short-form video, carousels, social posts create cultural presence and audience interaction
  • Conversion Formats → landing pages, performance ads, CTAs drive measurable action
  • Credibility Formats → case studies, testimonials, data-backed proof reduce friction and build purchase confidence

When teams know which formats serve which goals, one insight can move through all four families with different objectives without losing narrative coherence.

Layer 4 - Execution Loop

This is where Insight-to-Creative Automation operates in practice.

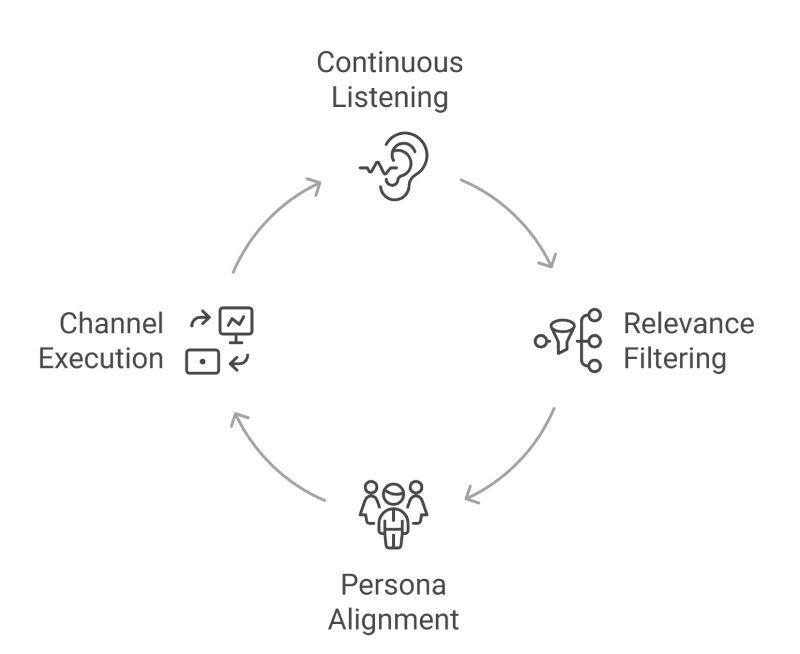
Continuous listening feeds into relevance filtering. Relevance filtering shapes persona-aligned adaptation. Adaptation produces channel-ready execution. The loop doesn’t stop after launch, it feeds back into listening.

Not speed for speed’s sake. Clarity before launch and iteration based on a real signal, not an assumption.

Layer 5 - Amplification Intelligence

The final layer is where infrastructure starts to compound.

Scale what’s gaining velocity. Cut what’s losing resonance quickly, not at the next quarterly review. Refine narrative clusters based on audience behavior. Reallocate budget dynamically toward what’s actually working.

Most teams do this manually, slowly, and too late. Infrastructure does it continuously.

The 6-Step Viral Execution Playbook

Here’s how the model translates into practice a repeatable playbook that works whether you’re a team of five or fifty:

  • Identify narrative tension - Look beyond trends. Focus on the friction, aspiration, or urgency that captures audience attention.
  • Map insight to persona × intent clusters - Define who cares about the insight, what they need next, and why it matters to them.
  • Pre-define format architecture - Decide the content formats the insight should move through before briefing creative teams.
  • Align channel roles before execution - Assign a clear role to each channel within the campaign sequence.
  • Launch in coordinated waves - Release sequenced content that builds momentum rather than isolated posts.
  • Optimize on velocity signals, not vanity metrics - shares, saves, search lift, conversion rate - not impressions

The playbook isn’t revolutionary, but its power comes from using it consistently, not occasionally.

Insight-to-Creative Automation Is Infrastructure, Not a Tool

This distinction matters and is worth stating plainly.

Insight-to-Creative Automation is not a trend detection tool. It’s not campaign automation in the traditional sense. It’s not a content generation engine.

It is the system that connects signal → interpretation → execution → scale as one continuous, closed loop.

That’s what keeps it consistent across every blog in this series. It’s not a feature; It’s not a shortcut; It’s the infrastructure that modern marketing teams need to run at the speed and relevance that today’s environment demands.

When that infrastructure is in place, everything changes: insights don’t die in translation, trends don’t expire in approval queues, campaigns don’t fragment across channel silos, and execution compounds instead of exhausting itself.

The Executive Insight

The brands winning in modern marketing aren’t the ones that spot trends fastest.
- They’re not producing the most content.
- They’re not the ones with the biggest teams or the fastest approvals.

They’re the ones who’ve built a coordinated marketing infrastructure that turns one validated signal into multiple audience-relevant, channel-aligned, format-optimized campaigns, without starting from scratch each time.

Infrastructure compounds. Effort alone does not.

Your team may discover insights, interpret trends, and launch campaigns. Yet scaling execution often leads to fragmentation. The gap is rarely creative.

It may be structural.

Connect with Tatvic to evaluate how your marketing system converts insights into coordinated, multi-format execution without operational chaos.

Virality isn’t a spike.
It’s a system built to compound.

Persona × Intent Marketing: Why One Trend Never Means One Campaign

Deep-Purple-Banner-Picsart-AiImageEnhancer

In our last blog, we talked about why brands miss big marketing moments even when they spot trends early. The real issue wasn’t discovery -it was decision-making. Teams often see opportunities but struggle to act on them quickly.

But even when speed improves, another challenge starts to appear.

Acting early doesn’t automatically mean campaigns will land well. Because the same trend can mean very different things to different audiences all at the same time.

This is where many “should’ve worked” campaigns quietly fall apart. Not when they launch, but when brands misunderstand what the trend actually means to the people they’re trying to reach.

Most marketers think speed is the biggest advantage.
In reality, understanding is.

When Speed Is Solved, Relevance Becomes the Constraint

Marketing teams have gotten better at moving fast. Tooling is stronger. Approval workflows are leaner than they used to be. Some teams even have dedicated “rapid response” pods for cultural moments.

And still, plenty of campaigns launched early fail to make a dent.

That’s because the problem has shifted.

The bottleneck is no longer timing.
Its interpretation.

When brands respond to a trend without understanding who it matters to and why it usually shows up in the work as:

  • messaging that feels too general (“for everyone”),
  • creative that looks like trend-chasing,
  • or campaigns that get attention but not action.

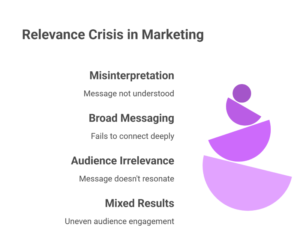
This is why early campaigns often create uneven results. One segment clicks, shares, comments, or converts while other audiences scroll right past.
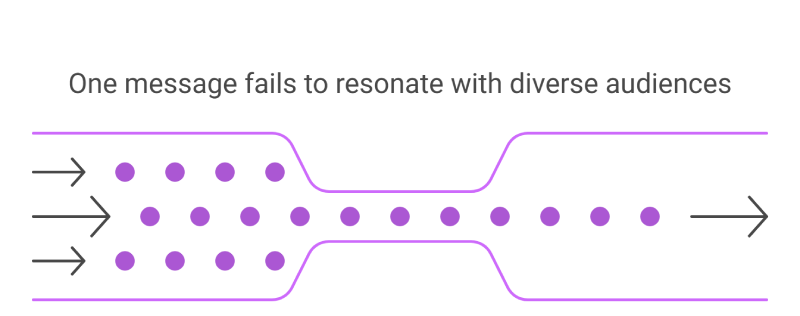
Virality doesn’t usually fail because brands are late.
It fails because the message means different things to different people.

And when meaning splits, one-size-fits-all campaigns don’t scale relevance. They dilute it.

One Trend, Many Interpretations (The Fragmentation Problem)

Trends today don’t behave like single, clean signals. They fragment across platforms, communities, and contexts. The same keyword, meme, or cultural moment can represent totally different motivations depending on where it’s encountered.

Take the rise of quiet luxury.

For some consumers, it reflects understated sophistication and long-term value buying fewer things, but better ones.
>
For others, it connects to sustainability, mindful purchasing, and “anti-haul” behavior.
>
For another group, it’s still a status signal just expressed differently than traditional logo-forward luxury.

Same trend. Different drivers.

This fragmentation is also happening in discovery. As we explored in Beyond SEO: How GEO and AEO Are Rewriting the Rules of Search, intent doesn’t live in one channel anymore and it doesn’t look the same for everyone.

Trends follow the same pattern.

They don’t arrive as one unified signal.
They arrive as clusters of meanings, often simultaneously.

And that’s the trap: brands see the “trend label,” assume there’s a single shared interpretation, and build one hero message. Meanwhile, audiences are experiencing the trend through completely different emotional lenses.

Why Most Campaigns Collapse Intent Into Content

Most marketing execution still follows an efficiency-first mindset:

“Let’s build one strong hero idea, then distribute it.”

At first glance, it seems efficient, streamlined, and operationally simpler.

But when a trend contains multiple motivations, “one hero message” becomes a shortcut that quietly breaks relevance.

Here’s what typically happens:

  1. The team identifies a trend.
  2. Creative starts developing an idea that “fits.”
  3. Personas (if they exist) get applied later as targeting filters.
  4. The team tries to stretch one message across multiple audiences.
  5. Performance comes back mixed, and the trend is blamed.

But the trend wasn’t the problem. Interpretation was.
When you compress different motivations into one message, you don’t just lose personalization you lose emotional precision. The message becomes broad enough to avoid being wrong, but not specific enough to feel true.

It’s the difference between:

  • “Here’s what this means to you,” and
  • “Here’s a safe version of what this might mean to someone.”

Speed doesn’t solve that. It amplifies it.

If you move fast with a generic interpretation, you just launch the disconnect earlier.

What Persona × Intent Marketing Actually Means

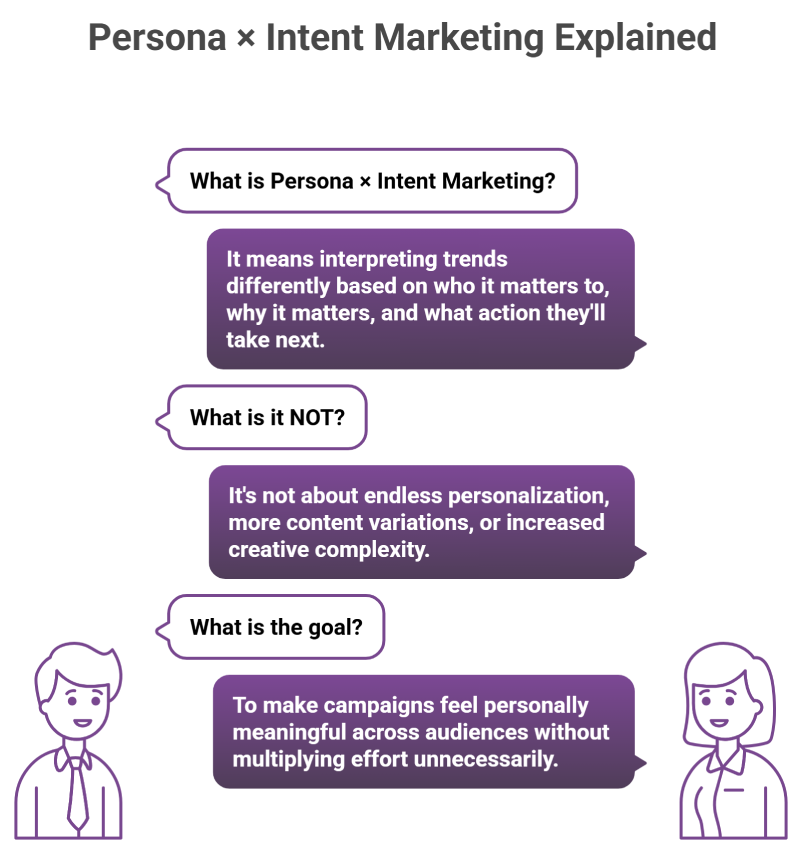
Persona × Intent Marketing is a more practical way to respond to trends without losing relevance.

Simply put, it means:

Interpreting one trend differently depending on who it matters to, why it matters, and what action they’re likely to take next.

It also helps to clear up what this is not:

  • It’s not endless personalization for its own sake.
  • It’s not “make 50 variations and hope one works.”
  • It’s not complexity disguised as strategy.

Persona × Intent is about reducing ambiguity, not increasing workload.

It gives teams a way to build multiple clear campaign directions from one strong insight without turning execution into chaos. The objective isn’t to multiply content. It’s to multiply relevance.

A clean way to think about it:

  • Persona answers: Who is experiencing this trend?
  • Intent answers: What are they trying to do/feel/decide right now?
  • Persona × Intent answers: What should we say and what should we ask them to do next?

This is why the same trend can’t mean one campaign. Because audiences don’t share one reason for caring.

Where Insight-to-Creative Automation Fits (Without the Hype)

This is where Insight-to-Creative Automation becomes powerful, but not in the “automation will replace marketing” way that most people dislike (and rightly ignore).

Automation doesn’t decide what’s trending.
It helps teams understand how a trend should be interpreted across audiences at the same time.

Decision-readiness answers when you should act.
Persona × Intent clarity answers how you should act once you do.

In practical terms, Insight-to-Creative Automation supports the messy middle:

  • spotting the same signal across multiple channels,
  • identifying which personas are reacting,
  • separating different motivations,
  • and shaping channel-appropriate creative directions.

The point isn’t speed for speed’s sake. It’s coordination. It’s preventing the team from collapsing multiple meanings into one average message.

One Signal, Multiple Campaign Paths

Imagine a growing cultural conversation around digital well-being.

If a brand treats it as one trend and launches one message, say, “Take control of your screen time” it will feel relevant to some people and tone-deaf to others.

Now look at Persona × Intent:

1) Productivity-driven professionals (intent: focus and performance)

Digital well-being here is about reducing distractions, improving focus, and getting more done with less noise.

Campaign direction:

  • “Build better work habits.”
  • “Protect deep work.”
  • “Cut the context switching.”

Channels that often work well:

  • Search, LinkedIn, email, product-led landing pages

2) Younger, socially aware audiences (intent: balance and mental health)

For this persona, digital well-being may connect to burnout, anxiety, and lifestyle health.

Campaign direction:

  • “Create healthier boundaries.”
  • “Choose calm over constant updates.”
  • “Use tech with intention.”

Channels that often work well:

  • Short-form video, creators, community-led content, social storytelling

3) Business leaders (intent: team sustainability and outcomes)

For this persona, digital well-being can map to employee satisfaction, retention, and sustainable performance.

Campaign direction:

  • “Reduce burnout risk.”
  • “Improve employee experience.”
  • “Build healthier digital culture at scale.”

Channels that often work well:

  • Thought leadership, webinars, ABM, case studies

The insight stays the same.
Only the interpretation changes.

And once interpretation changes, your creative, CTA, and channel strategy should change too.

That’s not “more work.” That’s smarter work.

Why This Changes How Virality Works

We often talk about virality like it’s purely a distribution problem: timing, reach, algorithm, media spend.

But modern virality works differently.

Virality is increasingly a relevance effect.

It happens when the right audience sees something that feels specific to them and they pass it along because it signals identity, values, humor, or usefulness.

A trend-based campaign goes viral when:

  • It lands early enough to feel timely,
  • clearly enough to feel personal,
  • and consistently enough across touchpoints to feel real.

Many brands compete to spot trends first.
Long-term advantage belongs to brands that understand trends most accurately and apply that understanding at scale.

When campaigns reflect audience meaning from the start, engagement grows naturally. It’s not dependent on shouting louder. It’s dependent on being more precise.

How Teams Can Apply Persona × Intent Without Slowing Down

A common fear is: “If we do this properly, we’ll slow down.”

The opposite is usually true because Persona × Intent reduces indecision.

Here’s a lightweight way teams operationalize it:

  1. Name the trend signal (what are we seeing?)
  2. List the top 2-4 personas involved (who is reacting?)
  3. Map intent by persona (why do they care?)
  4. Assign one clear campaign angle per persona-intent pair
  5. Define one primary CTA per angle
  6. Choose channels where that intent naturally shows up

The goal is not perfection. The goal is clarity fast enough to matter.

This is also where Insight-to-Creative Automation can help: by turning those mappings into consistent, repeatable flows so the team doesn’t rebuild the wheel every time.

If one trend can lead to multiple audience-aligned campaign directions, the next question becomes obvious:    How do brands scale this approach without increasing cost, effort, or operational complexity?

In the final blog of this series, we’ll explore how insight-to-creative automation helps brands turn one validated signal into multiple launch-ready campaigns without slowing teams down or creating execution overload.

If your team consistently spots trends but struggles to turn them into audience-relevant campaigns, it may be time to review your execution process-not your creativity.

If you’d like to explore what Persona × Intent looks like in your current campaigns, connect with Tatvic for a strategic consultation

Brands Don’t Miss Trends. They Miss the Moment: How Automation Closes the Gap Between Insight and Action

Brands Don’t Miss Trends

Automation matters not because it makes teams faster, but because it changes when decisions get made. Most brands don’t lose trends due to lack of insight - they lose them in the space between seeing a signal and agreeing to act on it. That gap, where validation, alignment, and execution stall, is where momentum fades. Closing it is less about speed and more about decision readiness.

The Real Myth to Kill

Most brands don’t miss trends.

They see them. Track them. Discuss them in Monday meetings with coffee still warm.

And still do nothing with them.

The problem isn’t awareness. It’s activation latency.

If you’re interested in why insight alone doesn’t move brands forward, our first blog: Insight to Creative Automation digs into exactly that - why signals often die in translation before they even become decisions.

Trends don’t reward discovery. They reward decisions made early enough to matter-before the conversation moves on, before competitors claim the territory, before the algorithm stops caring.

You can be the first to spot a signal and still arrive too late. That’s not a failure of insight. It’s a failure of infrastructure.

The Thread From Before

In our first blog, we showed why insights die in translation, how the journey from data to decision loses clarity at every handoff. The second blog revealed how search is fragmented across platforms, scattering audience intent into signals brands can barely track, let alone act on.

This blog answers the next logical question: Even if I see trends early, why do I still miss the moment?

Because speed isn’t your constraint. Decision-readiness is.

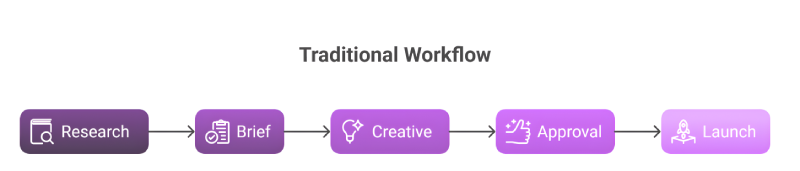
When a trend surfaces, most teams enter a familiar loop: validate the signal, check if it’s on-brand, debate the format, assign ownership, wait for creative approval. By the time all those boxes are checked, the trend has either peaked or pivoted into something else entirely.

The bottleneck isn’t how fast you move. It’s how long it takes to know what to move on to.

Decision Debt: The Hidden Cost

Let’s name what’s actually happening here.

Decision debt is the accumulation of unanswered questions that delay action until the opportunity expires.

Every trend that lands on your radar arrives with a string of unresolved decisions:

  • Is this signal real or noise?
  • Is this on-brand, or are we stretching?
  • Which persona does this actually apply to?
  • Who owns the call: social, performance, brand?
  • What format should we launch in: video, carousel, article, or ad?

These aren’t trivial questions. They’re necessary. But when every trend requires this much internal negotiation, velocity dies.

Here’s the insight most teams miss: Trends don’t expire on feeds. They expire inside organizations.

The half-life of a trend isn’t determined by TikTok’s algorithm or Twitter’s Explore tab. It’s determined by how long your team takes to move from “interesting” to “live.”

And that’s where decision debt compounds. One unresolved question triggers another. Creative waits on strategy. Strategy waits on validation. Validation waits on data that’s already outdated.

By the time the green light comes, the moment is gone.

Why Manual Trend Monitoring Fails

Most teams rely on some version of this:

  • Weekly trend reports compiled by junior analysts
  • Static dashboards showing what spiked yesterday
  • Platform-specific signals (what’s trending on Instagram vs. LinkedIn vs. Google)
  • Gut feel from someone who “stays plugged in”

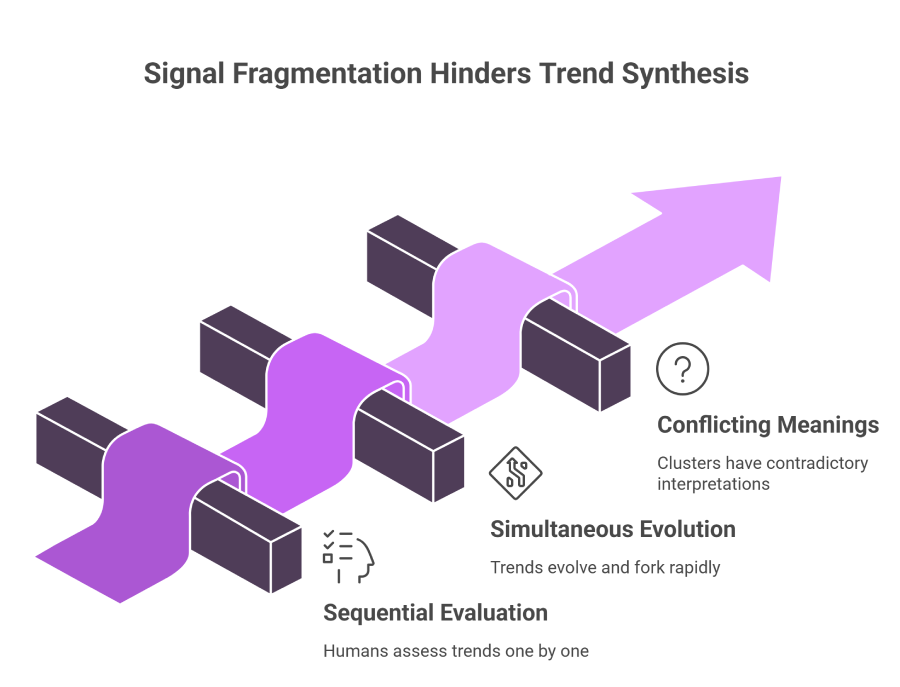
The problem isn’t effort. Teams work hard. The problem is signal fragmentation.

Trends don’t live in one place anymore. They’re scattered across:

  • Search queries
  • Social feeds
  • Generative AI answers
  • Community forums
  • Creator content
  • Platform-curated recommendations

Humans see fragments. Virality requires synthesis.

And here’s where it gets harder: humans evaluate trends sequentially. You look at one signal, assess it, move to the next. But trends evolve simultaneously. By the time you’ve validated one angle, the conversation has already forked into multiple intents.

Take “quiet luxury” as an example. When it first surfaced, it meant different things depending on where you looked:

  • On Pinterest: minimalist wardrobe inspiration
  • On LinkedIn: workplace professionalism discourse
  • On TikTok: anti-flexing Gen Z sentiment
  • In search: premium product recommendations

If your team is monitoring these platforms separately, you’re not seeing a trend. You’re seeing conflicting data points. And conflicting data paralyzes decisions.

Trends don’t arrive as single signals. They arrive as clusters with conflicting meanings.

Read: Beyond SEO - how GEO & AEO are rewriting the rules of search

That’s why manual monitoring fails-not because people aren’t paying attention, but because the structure of trend discovery itself has outpaced human capacity to synthesize it in real time.

The Missing System:

Automation That Decides When Not to Act

Here’s the insight most automation pitches miss:

Automation isn’t valuable because it moves fast. It’s valuable because it filters aggressively.

The real competitive advantage isn’t jumping on every trend. It’s knowing which ones to ignore.

Insight-to-Creative Automation doesn’t ask: “What’s trending?”

It asks:

  • What’s accelerating, not peaking? (Momentum matters more than volume)
  • What aligns with this brand, not any brand? (Relevance filters out noise)
  • What maps to this persona × intent? (Signal meets strategy)
  • What can be executed now, not someday? (Actionability gates everything)

The output isn’t content. It’s decision clarity.

You don’t get a list of trends to consider. You get trends worth acting on-pre-filtered for brand fit, audience intent, execution readiness, and momentum trajectory.

This is the shift: Automation doesn’t replace judgment. It decides when judgment is required.

Most decisions don’t need a committee. They need a system that knows your brand well enough to filter what lands on your desk in the first place.

Book a call with Tatvic to assess how automation can close the gap between insight and action - without adding complexity or risk.

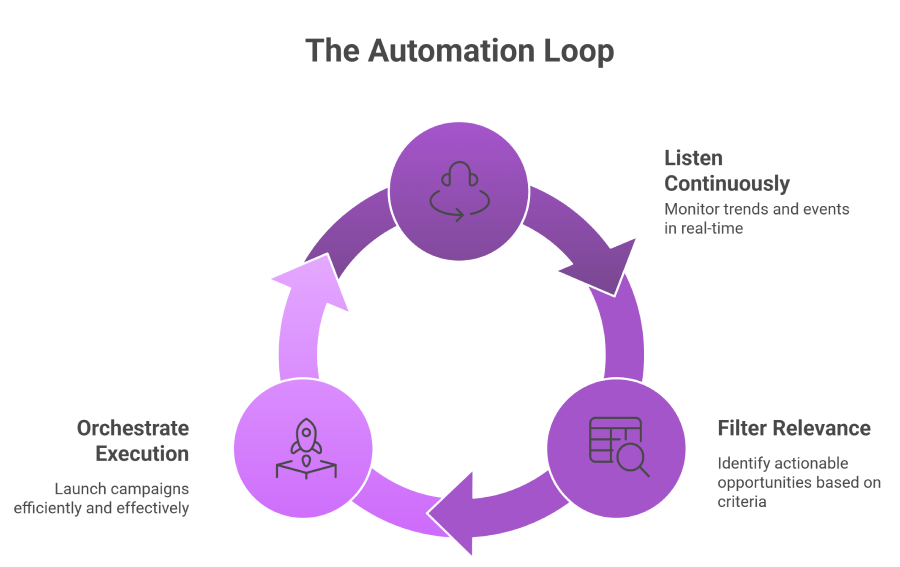
The Automation Loop That Changes Everything

Real automation isn’t a feature. It’s a closed-loop system that does three things simultaneously:

1. Continuously listens

Not daily. Not weekly. Continuously.

Trends don’t wait for your Monday report. They emerge on Saturday afternoons, Tuesday evenings, during product launches, breaking news cycles, and cultural moments. If your listening is periodic, you’re always behind.

2. Pre-filters relevance

Brand voice. Category boundaries. Audience intent. Execution feasibility.

The system doesn’t surface everything. It surfaces what your brand can own,right now, with the assets you have, for the audience that matters.

3. Orchestrates execution paths

Ads, social posts, landing pages, search content, already shaped, formatted, and channel-ready.

This isn’t about generating ideas. It’s about collapsing the distance between signal and asset. The output isn’t a brief. It’s a launchable campaign.

The system doesn’t surface trends. It surfaces opportunities worth acting on now.

That’s the difference between tools that inform and systems that activate.

Same Signal, Different Outcomes

Let’s make the gap undeniable.

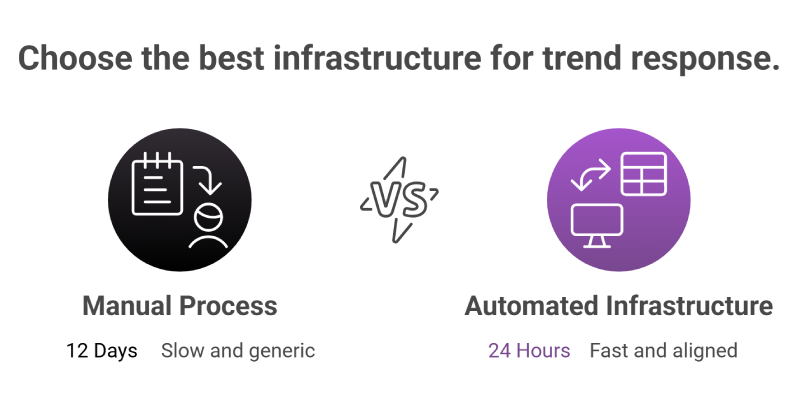
Two teams. Same emerging signal: “coffee alternative” searches spiking 40% week-over-week.

Team A (Manual Process)

  • Analyst adds it to the weekly tracker
  • Strategy meeting scheduled for Thursday
  • Creative brief circulated Friday
  • Approvals drag into next week
  • Generic “looking for coffee alternatives?” creative launches 12 days later
  • Trend has already peaked; creative feels late

Team B (Automated Infrastructure)

  • Automation flags the signal within hours
  • Filters confirm brand alignment + persona intent match
  • Channel-ready creative variants generated: search ad, carousel, blog snippet
  • The campaign goes live in 24 hours
  • Captures early momentum while competition is still scheduling meetings

The insight wasn’t the advantage. The infrastructure was.

Team A had the same data. They just didn’t have the system to act on it before it expired.

The Next Competitive Moat

This isn’t just a marketing execution story. It’s a strategic shift.

The next competitive moat isn’t:

  • Better creatives (everyone has good designers)
  • Faster approvals (speed alone isn’t a strategy)
  • Bigger teams (headcount doesn’t solve decision debt)

It’s systems that collapse insight → decision → execution into one loop.

The brands that win in the next era won’t be the ones who spot trends first. They’ll be the ones who’ve built infrastructure that turns signal into action before competitors finish their first meeting.

And here’s the leadership-level insight most miss:

The advantage isn’t moving faster. It’s knowing what not to launch.

In a world where trends multiply daily, restraint becomes the skill. Automation permits you to ignore 90% of what’s trending, because you have confidence that the 10% you act on is strategically sound, brand-aligned, and execution-ready.

That confidence is what separates reactive brands from those building compounding advantages.

What Comes Next

If your team can see trends but can’t act on them fast enough, the issue isn’t talent. It’s tooling.

The gap between awareness and activation is structural. And the structure can be rebuilt.

In the next piece, we’ll break down how Persona × Intent automation turns one emerging signal into multiple campaigns-without slowing teams down or sacrificing brand coherence.

That’s where trend discovery becomes a repeatable system, not a lucky hit.

Book a call with Tatvic’s experts to evaluate where your insight-to-action pipeline is breaking - and what it would take to fix it.

Turn data into competitive edge with Agentic AI

Beyond SEO: How GEO and AEO Are Rewriting the Rules of Search

Your SEO strategy is working.

Your traffic is growing.

And you’re still losing the search game.

Here’s why: People aren’t searching on Google alone anymore. They’re asking ChatGPT. They’re querying Perplexity. They’re getting answers from Claude, Gemini, and a dozen other AI engines.

And if your content isn’t optimized for those platforms, you’re invisible - no matter how well you rank.

Welcome to the era of GEO and AEO.

The Search Landscape Just Fractured And Most Brands Missed It

2020: 92% of searches happened on Google. You optimized for one algorithm. You ranked. You won.

2024: Search is fragmented across:

  • Traditional search engines (Google, Bing)
  • Generative AI platforms (ChatGPT, Perplexity, Claude)
  • AI-enhanced search (Google SGE, Bing Chat)
  • Social discovery (TikTok, Instagram, Reddit)

Each platform has different ranking logic. Different content formats. Different user intent.

SEO alone doesn’t cut it anymore.

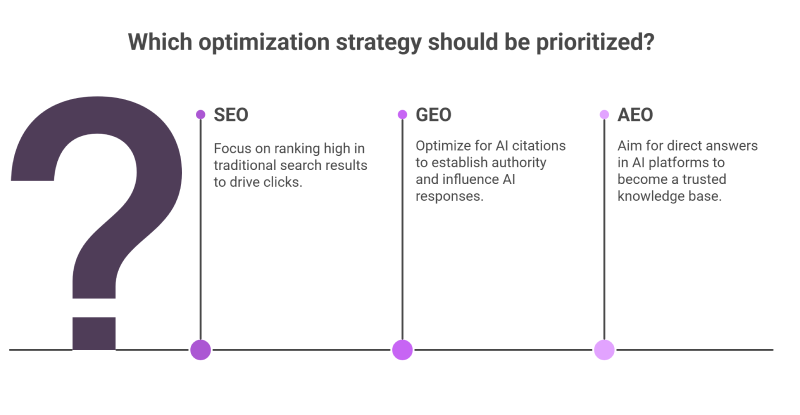
SEO → GEO → AEO: What Actually Changed

SEO (Search Engine Optimization)

  • What it optimizes for: Rankings on traditional search engine results pages
  • How it works: Keywords, backlinks, technical structure, page speed, mobile optimization
  • User behavior: Clicks through 10 blue links, evaluates options, chooses
  • Your goal: Rank #1 for target keywords

GEO (Generative Engine Optimization)

  • What it optimizes for: Being cited in AI-generated summaries and responses
  • How it works: Authoritative source signals, structured data, contextual relevance, citation-worthy content
  • User behavior: Reads AI-generated summary, rarely clicks through
  • Your goal: Be the source AI engines quote

AEO (Answer Engine Optimization)

  • What it optimizes for: Direct answers in conversational AI platforms (ChatGPT, Claude, Perplexity)
  • How it works: Conversational query matching, expertise signals, up-to-date information, multi-turn dialogue relevance
  • User behavior: Asks follow-up questions, expects nuanced answers
  • Your goal: Be the knowledge base AI assistants reference

The shift: From “rank to get clicks” to “get cited to build authority.”

Why This Matters Right Now

The Traffic Paradox

You might still see traffic growth from traditional SEO. But look closer:
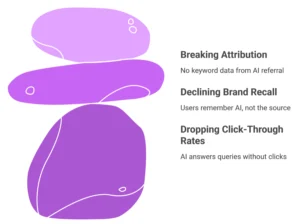
  • Click-through rates are dropping - AI summaries answer queries without clicks
  • Brand recall is declining - Users remember the AI answer, not the source
  • Attribution is breaking - Traffic comes from “AI referral” with no keyword data

Translation: You’re creating content AI engines consume, but you’re not getting credit.

The Authority Gap

When ChatGPT answers “What’s the best project management tool for remote teams?” it synthesizes information from multiple sources.

If your brand isn’t one of those sources, you don’t exist in that conversation.

Even if you rank #1 on Google for that exact keyword.

How Insight-to-Creative Automation Optimizes for GEO and AEO

Traditional SEO tools weren’t built for this shift. They optimize for Google’s algorithm, not AI engines’ citation logic.

Insight-to-Creative Automation adapts content strategy for all three paradigms simultaneously.

Step 1: Multi-Platform Query Analysis

The system identifies how the same user intent manifests across platforms:

1. Traditional Search (SEO):

  • “project management software for remote teams”
  • “best remote team collaboration tools 2024”

2. Generative Search (GEO):

  • “Compare project management tools for distributed teams”
  • “What features matter most for remote project management?”

3. Conversational AI (AEO):

  • “We’re a 50-person remote team switching from Asana. What should we consider?”
  • “Help me evaluate project management tools based on our specific workflow”

Why this matters: Same intent, different phrasing, different content requirements.

Step 2: Content Format Optimization

The system recommends content structures based on platform:

1. For SEO: Keyword-optimized landing pages, structured data markup, traditional blog posts

2. For GEO: Citation-worthy comparison tables, data-backed claims with sources, expertise signals (author bios, credentials)

3. For AEO: Conversational FAQs, nuanced opinion pieces, multi-perspective analysis, scenario-based guidance

One topic → Three content formats → Maximum visibility across platforms

Step 3: Authority Signal Amplification

AI engines prioritize sources with strong authority signals:

  • Expert author credentials
  • Original research and data
  • Multi-source corroboration
  • Recency and update frequency
  • Structured, parse-able content

The system identifies which authority signals your content lacks and recommends enhancements.

Real Example: SaaS Brand Optimizes for All Three Paradigms

The Challenge: A cybersecurity SaaS company ranked well for “endpoint security solutions” (SEO) but wasn’t appearing in ChatGPT or Perplexity responses about choosing security tools.

The Traditional SEO Content:

  • Product feature pages
  • “Top 10” listicles
  • Keyword-stuffed blog posts

What Insight-to-Creative Automation Recommended:

For GEO (Generative Citation):

Created “The 2024 Endpoint Security Buyer’s Guide” with:

  • Comparison matrix (structured data)
  • Industry benchmark data (original research)
  • Expert commentary from named security architects
  • Clear sourcing and citations

Result: Cited in Google SGE summaries 340% more than previous content

For AEO (Conversational Relevance):

Published “Choosing Endpoint Security: A Decision Framework” addressing:

  • Specific scenarios (“We have 500 remote employees…”)
  • Trade-off analysis (“If budget is limited, prioritize X over Y”)
  • Implementation guidance (“Here’s what to evaluate during proof-of-concept”)

Result: Referenced in ChatGPT responses 8x more frequently

For SEO (Traditional Ranking):

Maintained existing keyword-optimized pages but enhanced with:

  • Structured FAQ schema
  • Author expertise markup
  • Regular content updates

Result: Maintained #1-3 rankings while improving other channels

Combined Impact:

  • 280% increase in “brand mention” across AI platforms
  • 45% increase in qualified demo requests (attributed to “AI referral”)
  • Positioned as category authority in AI-mediated research

Step-by-Step: Optimizing One Piece of Content for All Three

Let’s say you’re creating content around “employee onboarding best practices.”

Before any content is written, the first step is understanding how the same intent shows up across discovery platforms.
Search engines surface keyword-driven queries, generative engines look for comparative and explanatory prompts, and conversational AI reflects real-world, situation-specific questions. This intent mapping ensures you’re solving the same problem - but in the language each platform understands.

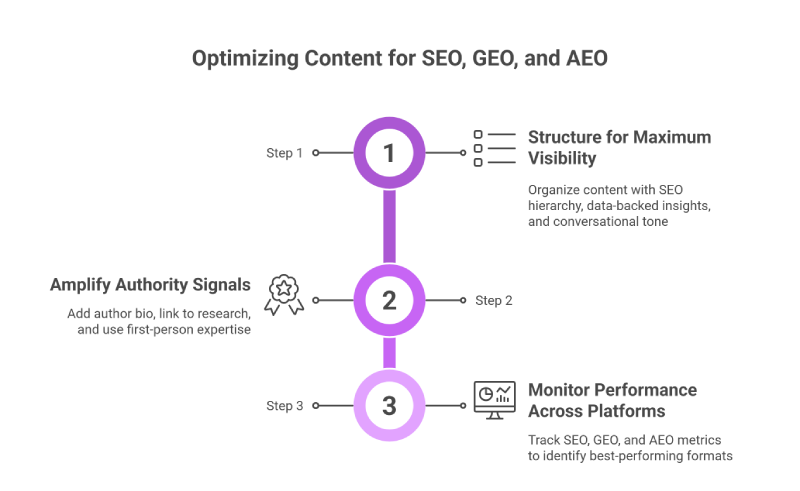
Step 1: Structure Content for Maximum Visibility

SEO Layer:

  • Clear H1/H2 hierarchy with target keywords
  • Meta descriptions optimized for click-through
  • Internal linking to related resources

GEO Layer:

  • Lead with data-backed insight: “Companies with structured onboarding see 50% higher retention”
  • Include comparison tables, statistics, expert quotes
  • Add structured data markup for key facts

AEO Layer:

  • Write in conversational, advice-giving tone
  • Address specific scenarios and edge cases
  • Include “if/then” guidance and decision frameworks
  • End sections with “What this means for you” summaries

Step 2: Amplify Authority Signals

AI engines don’t just evaluate what you say - they evaluate who is saying it and why it should be trusted.

  • Add author bio with relevant credentials
  • Link to original research or proprietary data
  • Include publication date and “last updated” timestamp
  • Cross-reference credible external sources
  • Use first-person expertise (“In our work with 200+ companies…”)

Step 3: Monitor Performance Across Platforms

Success is no longer measured in rankings alone.

  • SEO metrics: Rankings, organic traffic, CTR
  • GEO metrics: Citations in AI summaries, brand mentions in generative results
  • AEO metrics: References in ChatGPT/Claude/Perplexity responses (manual audit), “AI referral” traffic

The system tracks all three, showing which content formats perform best on which platforms.

What Early Adopters Are Seeing

B2B SaaS:

  • 340% increase in AI engine citations
  • 67% increase in “AI referral” attributed demos
  • 5.2x improvement in brand recall in buyer research conversations

E-commerce:

  • 420% increase in product mentions in shopping-related AI queries
  • 89% increase in “voice search” and AI assistant-driven purchases
  • 3.1x improvement in brand consideration during AI-mediated research

Professional Services:

  • 560% increase in expertise-based citations across AI platforms
  • 78% increase in qualified inbound leads from conversational AI referrals
  • 4.7x improvement in “top of mind” awareness in buyer interviews

The Competitive Moat This Creates

Most brands are still playing the old game-optimizing for Google while ignoring where their audience is actually searching.

When you optimize for GEO and AEO:

  • You get cited when competitors get ignored
  • You build authority in AI-mediated research
  • You capture demand in conversational discovery
  • You future-proof against further search fragmentation

This isn’t about abandoning SEO. It’s about expanding beyond it.

What’s Next: Real-Time Trend Hijacking

You now understand how to optimize content for traditional search, generative engines, and conversational AI.

But what about speed? How do you identify which trends to optimize for before they saturate?

In our next piece, we’ll show you how to surface cultural moments in real-time and align them with audience personas and intent signals-turning viral opportunities into campaigns that launch before your competitors even notice the trend.

Because being discoverable matters. Being discoverable first wins.

Ready to see how your content performs across SEO, GEO, and AEO? Connect with Tatvic’s team to audit your search visibility across all three paradigms.

The search game changed. Are you still playing by the old rules?

Insight-to-Creative Automation - The New Engine Behind Viral, Insight-Led Marketing

Marketing Didn’t Break. It Just Started Moving Faster Than Our Systems.

Search still works.
People still look for products, answers, inspiration, and reassurance.

What’s changed is how and when they search.

Users no longer type short, transactional queries like “buy running shoes.”
They ask nuanced, context-heavy questions like:

  • “Best cushioned shoes for knee pain”
  • “Sneakers TikTok creators are wearing right now”

These queries are shaped by culture, creators, conversations, and real-time moments - not just intent to buy.

For marketers, this creates a quiet but growing problem.

By the time keyword research is completed, reviewed, clustered, and approved, the moment that triggered the search behavior has often already passed.

Keyword research still tells you what people searched for.
It does not tell you what to create, when to create it, or how to act before competitors flood the same space.

This is where most modern marketing teams lose momentum - not because they lack insight, but because they can’t translate insight into action fast enough.

The Growing Gap Between Insight and Execution

Traditional keyword research was never designed for this environment.

It is inherently backward-looking. It analyzes historical volume, competition, and trends that have already stabilized. That worked when search behavior changed slowly. It doesn’t work when culture, platforms, and intent shift week by week.

What marketers experience today is a persistent execution gap.

Insights live in dashboards, spreadsheets, and reports. Creative teams work on fixed calendars. Campaigns launch after approvals, iterations, and revisions. And by the time everything goes live, the opportunity window has narrowed - or closed.

The result is familiar:

  • Brands enter trends late and pay a premium for attention
  • Creative feels generic because it’s built for scale, not momentum
  • Teams spend more time coordinating than experimenting
  • Competitors who moved faster dominate visibility

This isn’t a failure of creativity or strategy. It’s a system problem.

Why “Faster Execution” Alone Isn’t the Answer

Many teams try to solve this by asking for faster turnaround.

They push agencies harder.
>
They shorten approval cycles.
>
They add more tools.

But speed alone doesn’t fix the core issue.

The real challenge is translation - turning raw signals into brand-relevant creative decisions without losing context, consistency, or quality.

You don’t just need to know what is trending.
You need to know:

  • Whether the trend actually aligns with your brand
  • How it connects to your audience’s intent
  • What creative angle makes sense for you
  • And how to act while momentum is still building

This is where Insight-to-Creative Automation enters the picture.

What Is Insight-to-Creative Automation?

Insight-to-Creative Automation is a marketing system that continuously identifies emerging search and cultural signals, evaluates their relevance to a brand, and automatically translates them into brand-aligned creative across channels - before trends reach saturation.

Unlike traditional keyword research or static automation, it connects insight discovery, decision-making, and creative execution into a single, autonomous workflow powered by Agentic AI and governed by brand and business guardrails.

At Tatvic, this isn’t positioned as a tool you plug in.
It’s implemented as a custom operating system for modern marketing teams, designed around your data, your brand voice, and your growth priorities.

How the System Actually Works: Beyond the Buzzwords


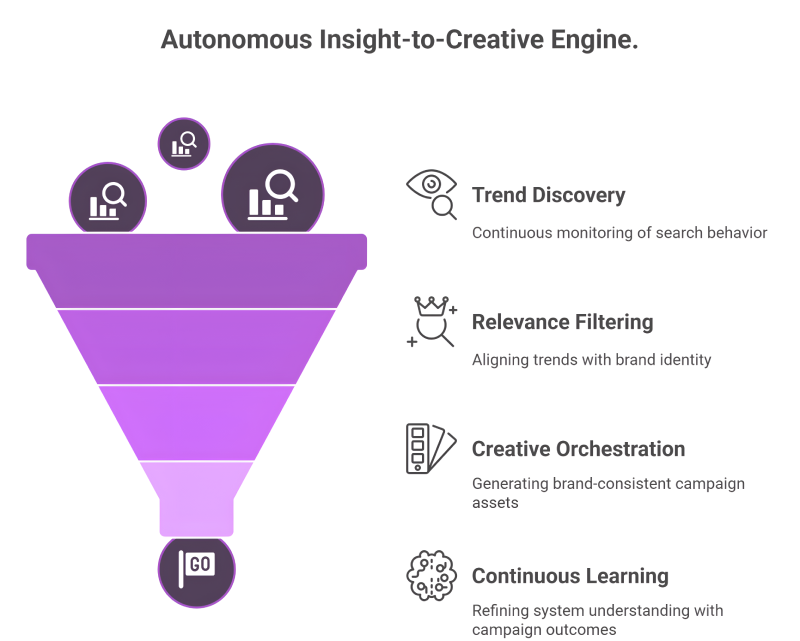
  • From Passive Monitoring to Active Trend Discovery

The system continuously monitors search behavior, identifying emerging trends before they hit mainstream saturation. It understands semantic relationships and builds topic clusters that reflect how people actually search - without human supervision.

No spreadsheets. No manual sorting. No guesswork.

  • From Generic Trends to Brand-Relevant Signals

Here’s the critical difference: the system doesn’t just find any trending keyword.

It identifies trends that align with your brand positioning, audience, and messaging. It evaluates which emerging topics create authentic connections with your brand story.

You don’t get noise. You get signal.

  • From Insight to Creative: Without Manual Translation

This is where the biggest transformation happens.

Once a relevant trend is identified, the system doesn’t stop at insight delivery. It orchestrates creative execution. That includes generating:

  • Campaign messaging aligned to the trend’s intent
  • Content themes tailored to your audience segments
  • Ad copy and social narratives consistent with your brand voice
  • Landing page messaging that connects curiosity to conversion

Instead of handing insights to creative teams and hoping for alignment, the system ensures continuity from discovery to deployment.

  • From One-Time Setup to Continuous Learning

Unlike static tools, the system learns from every campaign outcome and brand interaction. It gets smarter about your brand’s unique voice, your audience preferences, and your competitive positioning - continuously refining its creative orchestration.

The more you use it, the better it gets.

This is what makes Agentic AI fundamentally different from rule-based automation.

If your team is sitting on insights that rarely make it to market in time, it may be a system issue - not a talent one.

Explore how Tatvic helps brands operationalize Insight-to-Creative Automation. Speak with a Tatvic Strategy Expert

A Real-World Scenario: Why Timing Beats Volume

Consider a performance marketer launching a Q4 campaign around “sustainable fashion.”

The keyword data looks strong. Search volume is healthy. The campaign goes live.

But results disappoint.

Digging deeper reveals the problem: the term is already saturated. Competitors entered months earlier. Costs are high, and differentiation is low.

Meanwhile, a parallel trend -“thrifted capsule wardrobe” - was gaining momentum quietly. Lower competition. Higher cultural relevance. Stronger emotional resonance.

The insight existed.
The timing didn’t.

Insight-to-Creative Automation is designed to catch that parallel momentum early, validate its relevance, and launch while the opportunity is still open.

What Changes When Teams Operate This Way

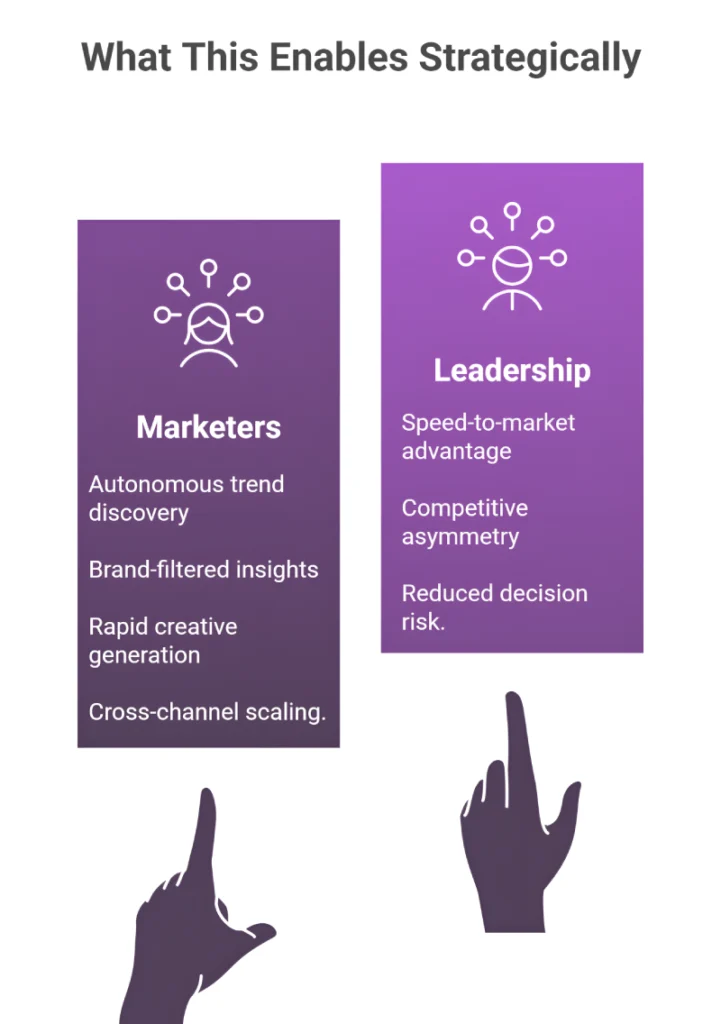
When insight and execution are connected through an autonomous system, several things shift:

  1. Marketing teams stop chasing trends and start riding them early.
  2. Creative teams focus more on ideation and less on rework.
  3. Campaigns feel timely, contextual, and culturally aligned.
  4. Learning cycles shorten dramatically.

Most importantly, brands move at the speed of culture - without losing consistency.

Why Insight-Led Marketing Wins Virality

We’re entering an era where virality is engineered, not accidental.

The brands that win won’t just react to trends - they’ll anticipate them, ride them early, and pivot faster than competitors can keep up. But they’ll do it while maintaining brand consistency and authentic voice.
That’s why automation isn’t a luxury - it’s becoming essential infrastructure.

Insight-to-Creative Automation represents a true end-to-end system that autonomously discovers trending keywords and transforms them into brand-relevant creative campaigns.

If you’re still relying on static keyword lists and disconnected creative workflows, you’re already behind.

The Real Competitive Advantage Is Time

The difference between knowing a trend and acting on it used to be weeks.

Now it can be minutes.

That shift isn’t incremental.
It’s structural.

Brands that adopt Insight-to-Creative Automation gain a lasting advantage - because speed, relevance, and brand alignment compound over time.

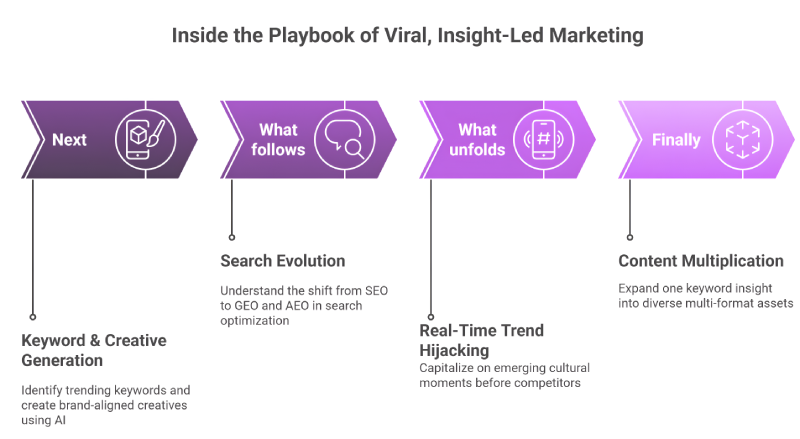
What’s Coming in This Series

This is just the beginning.

Throughout this series, we’ll take you deep into the world of viral, insight-led marketing powered by agentic AI.

Next up: We’ll show you exactly how to identify trending keywords and generate brand-aligned creatives - complete with practical use cases and real campaign wins that demonstrate the power of agentic AI-driven creative generation at scale.

Then: We’ll explore the evolution of search itself - moving beyond traditional SEO into the new frontiers of Generative Engine Optimization (GEO) and AI Engine Optimization (AEO). You’ll learn step-by-step how to optimize your content and campaigns for these emerging search paradigms.

After that: We’ll dive into real-time trend hijacking - the art and science of surfacing cultural moments before your competitors even know they exist. You’ll discover how to align emerging trends with precise audience personas and intent signals.

Finally: We’ll demonstrate the ultimate content multiplication strategy - taking a single keyword insight and exploding it into dozens of multi-format assets across channels, audiences, and content types.

You’ll walk away with a complete viral marketing playbook and execution framework.

Each piece will give you tactical workflows, real examples, and strategic frameworks you can apply immediately.

Where Tatvic Comes In

Tatvic works with enterprise and growth-stage teams to design and deploy Agentic AI systems that connect insight directly to execution.

Not as experiments. Not as one-off pilots.
But as scalable marketing infrastructure.

This is the right moment to have that conversation, if you’re exploring how to move beyond reactive keyword research and fragmented creative workflows.

See What Insight-to-Creative Automation Looks Like for Your Brand

If you want to understand how this approach can apply to your search, content, or paid media strategy, connect with Tatvic’s experts for a working session.

Schedule a Strategy Call with Tatvic

Because when trends move this fast, execution can’t wait.


AI Amplifies Bad Data - Only Intelligent Measurement Prevents It

AI Can’t Fix Bad Data. But Smart Measurement Can.

Here’s the uncomfortable truth about AI in marketing:

Data reliability and AI readinessEveryone’s rushing toward AI-powered personalization, predictive analytics, and autonomous campaigns. But there’s a foundation problem nobody wants to talk about: AI can’t fix bad data. It amplifies it.

The Silent Data Failure Nobody Sees

Your tags fire. Your GA4 dashboards populate. Everything looks operational. But beneath the surface, data quietly fails in ways that distort every insight your AI generates.

Tags misfire during critical checkout flows. Parameters go missing on mobile transactions. Schema drift makes “conversion” mean different things across marketing, analytics, and product teams. GTM containers bloat with ghost tags nobody remembers creating. GA4 receives corrupted data that looks perfectly normal until someone questions why the numbers don’t reconcile.

These aren’t dramatic system failures that trigger alerts. They’re silent erosions of data accuracy that make AI initiatives built on top fundamentally unreliable.

The cascading impact:

  • Marketing teams allocate millions based on incomplete attribution
  • Personalization engines optimize for corrupted behavioral signals
  • Predictive models train on inconsistent event definitions
  • Autonomous systems make decisions amplifying measurement errors

Your AI is only as intelligent as the data feeding it. When that foundation crumbles, every downstream initiative suffers.

Before You Invest in AI, Fix This First

Most organizations assume they have a “measurement problem.” In reality, they have a measurement operations crisis.

Here’s what the before state looks like for most marketing and analytics teams:

Wasted Hours Every Week

  • 4-6 hours per audit cycle validating tags manually across properties.
  • 2-3 weeks per sprint waiting for engineering to deploy tracking fixes.
  • Hours spent reconciling GA4 vs CRM vs Ads Manager discrepancies that never quite align.
  • Endless back-and-forth to verify event parameters, confirm schema compliance, and debug implementation issues.

These aren’t productive hours. They’re overhead - repetitive validation work that consumes time without creating value.

Wasted Manpower and Talent

Your most skilled analysts are stuck:

  • Checking tags instead of analyzing user behavior
  • Debugging events instead of identifying optimization opportunities
  • Reconciling reports instead of building predictive models
  • Chasing schema inconsistencies instead of driving strategy

Instead of creating insights that move the business forward, they operate as firefighters - constantly responding to data quality emergencies.

Wasted Investment in AI

AI models trained on inconsistent, incomplete, or corrupted measurement data:

  • Perform poorly from the start
  • Lose accuracy over time as data drift compounds
  • Misclassify users and behaviors
  • Optimize toward flawed signals
  • Erode leadership confidence in analytics initiatives

This is why AI initiatives “don’t deliver ROI.” Not because the models are bad - because the data feeding them isn’t trustworthy.
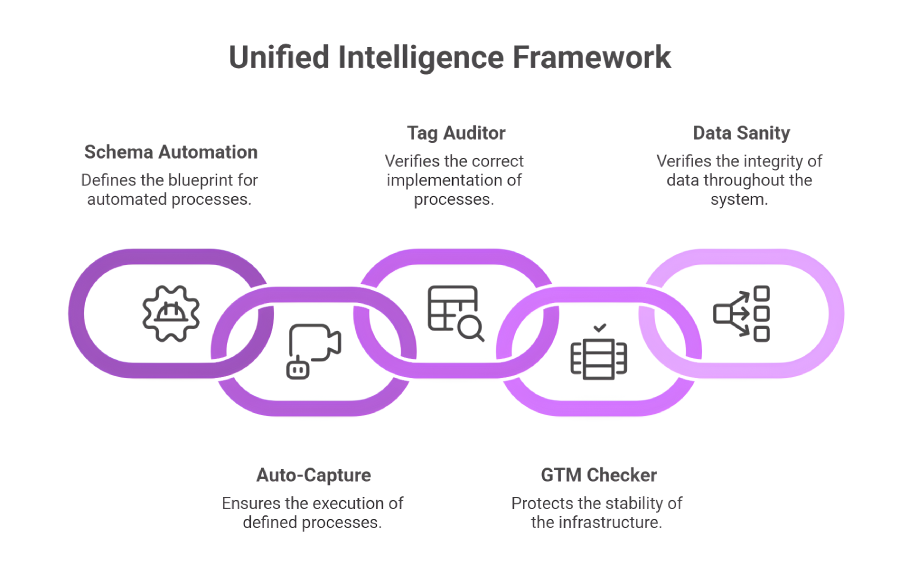
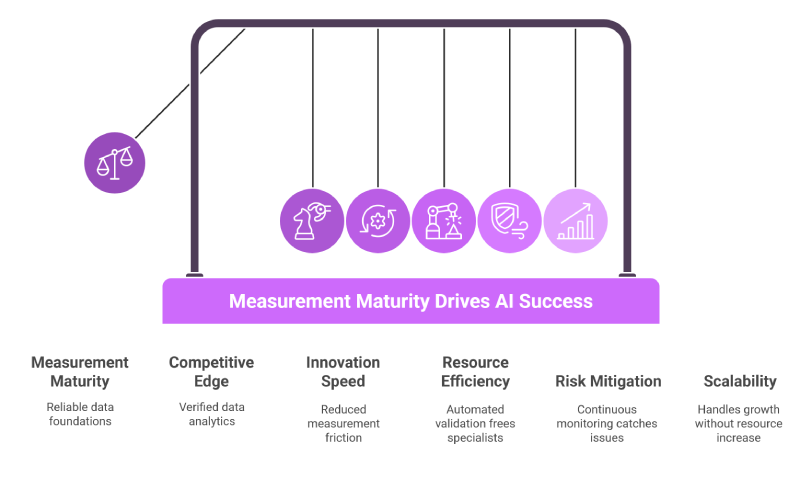
Before scaling AI, you need a measurement system that can operate with the same intelligence and autonomy as the AI you want to build.


The Measurement Gap Holding Back AI

Modern businesses face a paradox: AI capabilities advance rapidly while measurement infrastructure remains fragile. Organizations invest heavily in AI tools but neglect the analytics foundation those tools depend on.

Consider the typical scenario:

A retail brand launches an AI-powered recommendation engine. The model is sophisticated, the algorithm is sound, but the underlying event data is inconsistent. “Product_view” fires differently on mobile versus desktop. Purchase events occasionally miss critical parameters. User journey tracking has gaps where sessions aren’t properly stitched.

The AI doesn’t know the data is flawed. It processes what it receives, generating recommendations based on corrupted signals. Conversion rates disappoint. Leadership questions the AI investment. But the problem wasn’t the AI - it was the measurement infrastructure nobody validated.

This pattern repeats across industries:

  • Financial services firms struggle with incomplete customer journey data
  • E-commerce brands can’t trust multi-touch attribution
  • SaaS companies lack reliable product usage analytics
  • Media companies face fragmented cross-platform measurement

The measurement gap isn’t a technical curiosity. It’s the critical barrier preventing AI initiatives from delivering promised ROI.

What AI Actually Needs From Your Analytics

AI initiatives require five foundational capabilities that most organizations lack:

  1. Structure: Consistent event definitions across all teams and platforms. When different teams define “engagement” differently, AI models can’t learn meaningful patterns.
  2. Completeness: Full-journey visibility without implementation delays. AI needs comprehensive behavioral data, not samples limited by manual tagging bottlenecks.
  3. Accuracy: Continuous validation that implementations match specifications. AI trained on incorrect data produces unreliable predictions.
  4. Stability: Infrastructure that doesn’t degrade over time. As containers bloat and configurations drift, data quality erodes silently.
  5. Trust: Ongoing verification that data maintains integrity throughout collection. AI initiatives stall when stakeholders don’t trust the underlying analytics.

Most organizations have gaps in multiple areas. These gaps don’t just limit analytics - they fundamentally undermine AI effectiveness.

Enter Tatvic’s AI Powered Measurement Suite

What if your entire analytics infrastructure could maintain itself - catching issues before they corrupt data, ensuring consistency without manual intervention, and validating accuracy continuously?

That’s exactly what Tatvic’s AI Powered Measurement Suite delivers: an integrated system of specialized capabilities working together to build the analytics automation foundation AI initiatives actually need.

How It Works: Five Integrated Capabilities


  1. Event Schema Automation

    Ensures every team uses the same measurement blueprint. Instead of scattered spreadsheets and tribal knowledge, the system designs standardized event schemas based on your business model, syncs updates instantly across teams, and preserves institutional knowledge when team members change roles. This creates the structural foundation AI requires.

  2. Event Auto-Capture

    Eliminates manual tagging bottlenecks entirely. One-time integration enables the system to automatically identify and track user interactions: buttons, forms, CTAs, navigation, media engagement - without configuration on new pages. New features launch with same-day analytics coverage. Marketing campaigns run with complete visibility from day one. This provides the comprehensive data completeness AI needs.

  3. Tag Auditor

    Validates implementations against schema specifications continuously. AI-powered automated validation catches problems - missing parameters, incorrect values, timing issues that create attribution failures. This ensures the accuracy AI models depend on.

  4. GTM Health Checker

    Provides 24/7 automated monitoring of every container element. It identifies tag conflicts before they corrupt data, recommends cleanup for ghost tags and unused elements, tracks container performance impact, and ensures optimal infrastructure stability. This maintains the stable foundation AI requires.

  5. Data Sanity Automation

    Examines every parameter continuously via GA4 APIs, applying sophisticated validation logic to detect currency issues, PII leaks, naming inconsistencies, and data drift that manual processes miss. It provides intelligent three-tier scoring that makes issues actionable for different stakeholders. This creates the continuous trust AI initiatives need.

The Unified Intelligence

These capabilities don’t operate in isolation. They form an integrated system where each element reinforces the others:

Schema Automation defines what should be measured. Auto-Capture ensures comprehensive collection. Tag Auditor validates correct implementation. GTM Health Checker maintains infrastructure stability. Data Sanity Automation confirms end-to-end integrity.

Together, they reduce measurement ambiguity, creating the real-time analytics foundation AI needs to deliver on its promise.

Data Measurement Intelligence - AI-powered

The Transformation You’ll See

Organizations implementing the AI Powered Measurement Suite experience measurable improvements across multiple dimensions:

Operational Efficiency

  • Manual audit cycles drop from 4-6 hours to minutes
  • Implementation time falls from 2-3 weeks to same-day deployment
  • Analytics teams shift from firefighting to strategic analysis
  • Developer overhead for tracking decreases dramatically

Data Quality

  • Accuracy improves drastically
  • Schema consistency reaches near-perfect levels across platforms
  • GTM container health stabilizes with proactive maintenance
  • GA4 data integrity becomes continuously verified

AI Readiness

  • ROI on AI investments increases
  • Model training happens on verified, trustworthy data
  • Autonomous systems make decisions on reliable signals

Business Impact

  • Marketing attribution becomes trustworthy for budget allocation
  • Personalization engines optimize on accurate behavioral data
  • Predictive models generate reliable forecasts
  • Leadership gains confidence in data-driven strategies

This isn’t incremental improvement. It’s the difference between AI initiatives that stall and those that scale successfully.

Why This Matters Now

The gap between AI capabilities and measurement maturity is widening. As AI tools become more sophisticated, the quality bar for underlying data rises correspondingly.

Organizations that address measurement infrastructure now gain compounding advantages:

  • Competitive Differentiation: While competitors struggle with unreliable analytics, your AI initiatives operate on verified data foundations.
  • Faster Innovation: Reduced measurement friction accelerates experimentation and deployment cycles.
  • Resource Efficiency: Automated validation frees specialists for strategic work rather than manual checking.
  • Risk Mitigation: Continuous monitoring catches issues before they impact business decisions or create compliance exposure.
  • Scalability: Automated systems handle growth without proportional resource increases.

Conversely, organizations that defer measurement infrastructure investment face mounting challenges. Manual processes can’t scale. Data quality issues compound. AI initiatives underdeliver. The measurement debt grows.

The Blueprint for Success

Modern measurement excellence requires integrated capabilities working together:

  1. Start with structure through consistent event definitions that prevent schema drift and maintain alignment across teams.
  2. Ensure completeness by eliminating manual tagging delays that create visibility gaps in customer journeys.
  3. Validate accuracy continuously rather than relying on periodic audits that miss emerging issues.
  4. Maintain stability through proactive infrastructure monitoring that prevents degradation over time.
  5. Build trust with ongoing verification that data maintains integrity from collection through reporting.

The AI Powered Measurement Suite provides all five capabilities in a unified system designed specifically to support AI initiatives at scale.

Your Path Forward

AI will transform marketing - but only for organizations with trustworthy data foundations. The question isn’t whether measurement issues exist in your infrastructure. They almost certainly do.

The real question: Will you build the analytics automation foundation AI initiatives require before investing millions in models trained on flawed data?

The measurement gap isn’t closing on its own. Manual processes aren’t suddenly becoming more effective. The complexity of modern analytics continues increasing.

Organizations that treat measurement as strategic infrastructure - not just operational necessity - position themselves to capture AI’s full potential. Those that don’t will continue struggling with AI initiatives that promise transformation but deliver disappointment.

Your AI initiatives deserve better data. Start with measurement that actually works.

Before you invest in AI models, know exactly what clean, consistent measurement can return. Use our AI Measurement ROI Calculator to assess the impact of fixing your data foundation.

Ready to stop patching measurement issues and start building a foundation your AI strategy can trust?
Book a call with a Tatvic measurement expert and get a clear, actionable plan to make your data AI-ready.

Turn data into competitive edge with Agentic AI

Event Auto Capture: When Your Analytics Can’t Keep Up With Your Business

Discover how Tatvic’s Event Auto Capture eliminates manual tagging delays and delivers real-time GA4 analytics automation. Build data accuracy and scale measurement with AI-powered automation.

The Launch-Day Lag

Your team just launched a new campaign - but analytics automation is still two weeks behind.

That’s not just a delay. It’s lost data accuracy. Missed insights. Momentum gone cold. The feature is live, users are interacting, but you’re optimizing based on assumptions instead of real-time analytics.

Your development team celebrates the deployment. Marketing fires up ads. Product managers wait eagerly for feedback. But the analytics dashboard? Still empty. Still waiting for tags to be configured, implemented, validated, and approved.

Here’s what nobody talks about: Why does analytics lag behind everything else in your stack? Your CRM updates instantly. Ad platforms report in real-time. Customer service tools track your every interaction live. But analytics? That’s trapped in manual cycles that feel increasingly out of place in a world that moves at digital speed.

Every innovation in your product roadmap hits the same wall - manual event implementation. And that wall is getting higher as digital analytics automation becomes essential rather than optional.

The Hidden Cost of Manual Tagging

Behind every “pending analytics” status lies a complex coordination dance that most organizations have simply accepted as inevitable.

Marketing needs the data to optimize campaigns. Developers are buried in implementation backlogs. Analytics teams are validating existing tracking while new requirements pile up. Everyone’s waiting on everyone else, and meanwhile, your campaign is live without the visibility needed to improve it.

First comes schema preparation - days of meetings to agree on what needs tracking, which parameters matter, and how events should be named. Different stakeholders bring different perspectives. Marketing wants certain dimensions. Product teams need different attributes. Analytics advocates for standardization. These discussions turn simple tracking requests into multi-week processes.

Then comes implementation dependency. Developers can’t build until schemas are finalized. QA can’t validate until implementation is complete. Marketing can’t optimize until validation confirms data accuracy. Each handoff adds days or weeks to the cycle.

Even when events are implemented, validation reveals gaps. A button was missed. A form submission lacks parameters. A CTA doesn’t track properly. 

It’s like rebuilding your data foundation every time you add a room to your house. The structure exists, but somehow you’re starting from scratch with every expansion.

Manual event implementation isn’t a technical flaw - it’s an operational speed trap that limits business velocity regardless of how skilled your teams are.


The Cracks Beneath the Surface: What’s Breaking Behind the Scenes

Let’s explore the breaking points that silently destroy GA4 data integrity: 

  • Configuration Bottlenecks

Preparing event schemas involves extensive documentation, stakeholder alignment, and approval workflows. What should take hours extends into weeks as teams coordinate across time zones, competing priorities, and endless clarification cycles. Every new page means restarting this process.

  • Coordination Delays

Manual event implementation requires constant synchronization between marketing (who needs data), developers (who implement tags), and analytics teams (who validate everything). Each group operates on different timelines with competing priorities. The coordination tax compounds with every new launch.

  • Human Errors

Even experienced developers miss events. Research shows manual processes miss approximately 40% of tracking requirements during initial implementation. A button gets overlooked. A form submission isn’t captured. A CTA lacks proper parameters. By the time validation catches missing events, if it catches them - you’ve lost weeks of user behavior data that affects data accuracy permanently.

  • Maintenance Overload

Every new page or feature compounds the problem. Your digital property grows, but your measurement coverage fragments into a patchwork of tracked and untracked elements. Developers spend time on repetitive maintenance instead of building differentiated features. Analytics teams chase missing events instead of deriving strategic insights.

  • Tracking Gaps

The most painful reality: when you launch new pages, analytics coverage starts at zero. Every element needs manual configuration. Marketing can’t optimize what it can’t measure. Product teams delay decisions waiting for data. Leadership makes strategic choices based on incomplete information because real-time analytics doesn’t exist during critical launch windows.

Each missed event represents a lost opportunity. Every delay means campaigns are optimized too late. When your event implementation takes 2-3 weeks, you’re not just behind - you’re optimizing yesterday’s reality with last week’s data.

The Shift: Why Manual Tagging Can’t Keep Up

The challenge isn’t your team’s skill level. It’s not about hiring better developers or more analytics specialists. The limitation is systemic - your analytics process was built for a different era.

Your analytics methodology was designed for quarterly releases, not daily sprints. For annual campaigns, not continuous experimentation. For desktop-only properties, not omnichannel ecosystems that span web, mobile, apps, and emerging platforms.

Modern marketing runs in real time. Features ship daily. Campaigns pivot hourly. Customer behavior shifts constantly. A/B tests run continuously. But measurement? That’s stuck in 2-3 week cycles that feel increasingly inadequate.

This is where Tatvic’s perspective becomes critical: Measurement shouldn’t lag behind marketing velocity. Digital analytics automation should enable business agility rather than constrain it. Data accuracy should be a competitive advantage, not a perpetual challenge.

If your event implementation takes 2-3 weeks, you’re optimizing yesterday’s features today. By the time tracking is ready, user patterns have shifted. Campaign performance has evolved. The moment for immediate optimization has passed.

You don’t need another manual audit. You need analytics automation that moves as fast as your business.

The Solution: Event Auto Capture

Event Auto Capture is a one-time integration that automatically detects and tracks user interactions - buttons, forms, media, and navigation - instantly. It represents a fundamental shift from manual configuration to intelligent event automation powered by AI.

Unlike traditional tracking that requires explicit setup for every element, event auto capture recognizes interactions and captures events automatically. This isn’t just faster - it’s a completely different approach to achieving data accuracy at scale.

How It Works

  1. Automatic New Page Detection: When developers launch new pages or features, the solution automatically recognizes them without requiring configuration updates. Your analytics coverage expands automatically as your digital property grows.
  2. Intelligent Event Capture: The AI-powered solution identifies interactive elements - CTAs, form submissions, navigation clicks, media interactions - and captures events with appropriate context and parameters. Currently supported interactions include:
  • Form submissions across all pages
  • CTA button clicks with context
  • Navigation button interactions
  • Interactive UI element engagements
  • Menu and icon selections
  • Media interactions (play, pause, complete)
  1. Instant GA4/Firebase Integration: Events flow directly to your analytics platform in real-time, maintaining GA4 data integrity from capture through reporting. No manual data layer configuration. No custom JavaScript. No deployment delays.
  2. Zero Manual Dependency: Launch a new feature in the morning, see real-time analytics by afternoon. The system eliminates the entire 2-3 week cycle that manual event implementation requires.

Ready to experience real-time measurement without waiting weeks for implementation?
Talk to Tatvic’s measurement experts today: Schedule a Free Demo

Why It’s Different

Unlike conventional automation that simply executes predefined rules, event auto capture represents true human + AI collaboration. You define what matters strategically - business goals, conversion objectives, optimization priorities. The AI-powered Event Auto Capture executes and scales those priorities automatically.

This isn’t just faster manual tagging. It’s a fundamentally different measurement paradigm where digital analytics automation adapts to your digital property rather than requiring constant manual adaptation of your tracking to each new page.

The system scales effortlessly. One page or a thousand pages - the analytics automation effort remains constant. Your measurement coverage grows automatically as your business grows, maintaining data accuracy without proportional increases in engineering resources.

The Results: What You’ll See in Weeks

Organizations implementing event auto capture see immediate, measurable improvements:

  • From 2-3 weeks → Same-day analytics: What previously required extensive cross-team coordination now happens automatically through automated tagging at launch. Deploy in the morning, optimize by afternoon with real-time analytics.
  • Reduced dev overhead: Developers focus on building differentiated features instead of repetitive event automation. Engineering capacity is freed for innovation rather than consumed by measurement infrastructure.
  • Immediate launch-day insights: Marketing sees which CTAs perform best from hour one. Product teams identify friction during launch day, not weeks later. Leadership makes informed decisions based on actual behavior, not assumptions.

Imagine launching a new feature in the morning and optimizing it by noon. Picture campaigns that adjust in real time, powered by actual user behavior instead of delayed analytics. And think about product decisions driven by immediate, accurate data - not slowed down by tagging bottlenecks.

This goes far beyond operational efficiency. It’s a competitive edge. While others wait weeks for analytics to load, you’re already iterating. While teams rely on assumptions, you’re moving with real-time intelligence. And as competitors wrestle with manual cycles, your digital analytics automation scales effortlessly.

The Ecosystem: Where It Fits in the Measurement Suite

Event auto capture doesn’t work in isolation. It’s the foundational layer in Tatvic’s comprehensive AI-powered measurement suite designed to maintain GA4 data integrity at scale.

Event Schema Automation ensures events match business logic and strategic objectives. While event auto capture handles detection and collection, schema automation provides the intelligence layer that ensures events align with your unique business requirements and maintain data accuracy across properties.

Tag Auditor validates that events fire correctly through continuous monitoring. It confirms that events are firing as intended, maintaining quality as coverage scales.

GTM Health Checker keeps containers optimized even as automated tagging expands coverage. As your event auto capture system scales to hundreds or thousands of events, the health checker ensures your infrastructure remains performant and maintains GA4 data integrity.

Data Sanity Automation ensures data accuracy and reliability throughout the complete journey from capture to reporting. It verifies that auto-captured data maintains integrity across your pipeline, providing confidence in real-time analytics for decision-making.

Together, these agents create an ecosystem that scales analytics automation with business velocity

This is human + AI collaboration at scale: humans define strategic priorities, AI agents execute those priorities across your entire digital ecosystem, and the system adapts automatically as your business evolves - maintaining real-time analytics and GA4 data integrity without proportional increases in human effort.

Your Path to Real-Time Analytics

Manual implementation delays don’t just slow analytics automation - they slow growth. Every day without data accuracy is a day of optimizing based on assumptions. Every week waiting for events is a week competitors gain ground.

With Tatvic’s event auto capture, every new page comes with instant visibility. Every feature launches with immediate real-time analytics. Every campaign starts with complete data accuracy from day one through intelligent automated tagging.

The future of measurement isn’t just faster manual processes - it’s digital analytics automation that scales effortlessly with business velocity. It’s AI-powered measurement suites that maintain GA4 data integrity automatically. It’s human + AI collaboration that frees teams to focus on strategy rather than infrastructure.

Schedule a Free Demo - Get a personalized walkthrough with our Agentic AI experts and see event auto capture in action on your actual digital properties.

Don’t let manual tagging limit your business velocity. Transform analytics from an operational challenge to a strategic enabler with real-time analytics that scales automatically while maintaining exceptional data accuracy and GA4 data integrity.

Event Schema Automation: The Foundation Your Analytics Has Been Missing

Event Schema automation

Your GA4 dashboard looks flawless. Your tags fire perfectly. But ask two teams to define “conversion” - and you’ll get three answers.

That’s the silent failure of modern analytics: no shared event schema.

The Hidden Foundation of Data Accuracy

Here’s what most organizations overlook: measurement accuracy starts before any tracking happens - in how events are defined. Before you can run a Google Tag Manager audit, optimize containers, or trust your GA4 data integrity, you need a solid event schema. It’s the measurement blueprint that defines what you’re measuring, how you’re measuring it, and why it matters. When that analyst who set up your tracking six months ago leaves for another job, their understanding of why “user_engagement” was defined a certain way leaves with them.

Think of your event schema like architectural plans for a building. You wouldn’t start construction without blueprints, right? Yet, most organizations treat schema creation as an afterthought - a spreadsheet someone updates occasionally, a document buried in Google Drive, or worse, tribal knowledge scattered across teams.

The reality? Your event schema directly determines your analytics foundation. No amount of AI-powered tag audit processes or automated data quality checks can compensate for a poorly designed or inconsistently maintained schema. This is precisely where event schema automation becomes essential - and where most organizations have their biggest blind spot.

Before you can trust your GA4 data integrity, you need a solid event schema - but that’s only one piece of the foundation. Learn how Tag Auditor validates schema implementation accuracy.

The ripple effects of poor schema management:

  • Marketing teams track the same action differently across campaigns
  • Developers implement events inconsistently because documentation is unclear
  • Analytics teams spend hours reconciling conflicting definitions
  • Leadership questions reports because numbers don’t align across dashboards

Without a solid measurement blueprint, your entire tag management system operates on shifting ground. Every downstream process - from Google Tag Manager audit cycles to AI-powered tag audit validations, becomes compromised by inconsistent foundations.

What’s Breaking Behind the Scenes

Let’s explore the most common schema failures that silently destroy tracking consistency and compromise your analytics foundation.

  • Schema Drift: When Your Blueprint Becomes Outdated

Imagine this: Your team defined a “purchase_complete” event six months ago. Since then, three developers have added parameters, two campaigns introduced custom dimensions, and nobody updated the master schema. Now, the same event captures different data depending on where it fires. And when key team members leave, the rationale behind these definitions disappears entirely-leaving new hires to guess at the original intent.

Consider this scenario: Your e-commerce site tracks purchases with “item_name” on desktop but “product_title” on mobile. Your merchandising analytics becomes fragmented. Cross-device attribution breaks down. Revenue reports don’t reconcile.

This drift happens gradually. What starts as a well-documented GA4 event schema evolves into an inconsistent mess as teams make changes without central coordination.

  • The Documentation Gap

Most organizations maintain their measurement blueprint in static documents - spreadsheets, Confluence pages, or shared drives. These documents are outdated the moment they’re created. Worse yet, the person who created that documentation might have moved to a different role or company, taking critical context about parameter definitions and business logic with them.

The issue: Developers can’t find the latest version. Marketers don’t know which parameters are required versus optional. Teams operate from different versions of truth, creating systematic inconsistencies that undermine your entire tag management system.

Even the best schemas lose effectiveness if your container setup isn’t aligned. Discover how GTM Health Checker keeps your container healthy and your schema functional.

  • The Implementation Bottleneck

Even with clear schema documentation, translating business requirements into technical implementation creates bottlenecks. Developers spend hours interpreting what “user_engagement” actually means. Marketers wait weeks for custom events to be implemented. Every new campaign requires a complete implementation cycle.

The impact: Product launches get delayed waiting for tracking. Campaign optimizations happen without proper measurement. Teams make decisions with incomplete data because implementing the full schema takes too long.

  • Knowledge Loss: When analysts, developers, or marketing managers change jobs, their understanding of event definitions, parameter logic, and implementation decisions vanishes. New team members inherit schemas they don’t fully understand, leading to misinterpretation, incorrect implementations, and measurement gaps that compound over time.

Each of these causes mis-tracking, reporting delays, and poor decisions that undermine your entire tag management system and compromise GA4 data integrity across your organization.

If these bottlenecks sound familiar, it’s time to assess how your current schema setup performs in real-world conditions.
Book a call with Tatvic’s experts to discuss where your measurement framework stands today.

Why Manual Schema Management Fails

Most organizations handle schema management through manual processes - spreadsheet updates, documentation reviews, and periodic alignment meetings. This approach has fundamental limitations that no amount of manual Google Tag Manager audit cycles can overcome.

Here’s the uncomfortable truth: If your schema lives in a spreadsheet, it’s already outdated.

The Core Problems

  • You Can’t Maintain Consistency: Different teams interpret schema requirements differently. What one developer considers “complete” implementation, another might view as partial. This inconsistency undermines your entire automated data quality management strategy.

Your marketing team thinks “conversion” means any form submission. Your e-commerce team defines it as completed purchases only. Your product team tracks feature activations as conversions. Without centralized event schema automation, these definitions coexist - creating fragmented reporting that leadership can’t trust.

  • You’re Always Behind: Business requirements evolve constantly. By the time you update schema documentation and communicate changes, new requirements have already emerged. You’re perpetually catching up while your GA4 data integrity suffers.
  • It Depends on Who’s Documenting: Schema quality varies dramatically based on who creates it. Some teams produce comprehensive documentation. Others create minimal specs that leave critical questions unanswered. This inconsistency means your analytics foundation is only as strong as your weakest documentation.
  • It Consumes Valuable Resources: Schema management, updates, and cross-team alignment consume weeks of specialist time - time that could be spent on strategic analysis instead of documentation maintenance.

Moreover, manual approaches provide no real-time visibility. You get periodic snapshots, not ongoing understanding of tracking consistency. Modern businesses can’t operate on quarterly schema reviews when digital properties update daily and tracking requirements change constantly.

Enter Event Schema Automation

What if your event schema could evolve based on business needs, maintain consistency across teams, and stay aligned without constant manual intervention? That’s the fundamental shift event schema automation brings to your analytics foundation.

Event schema automation represents a move from static documentation to living intelligence. Rather than maintaining spreadsheets manually, these systems generate schemas based on industry best practices, business goals, and measurement requirements.

Think of It as an “Always-On Architect”

1. Designs Standardized Event Blueprints

Modern automation systems don’t just store your GA4 event schema-they help design it. By analyzing your business model, customer journeys, and measurement goals, these systems suggest the right events, parameters, and taxonomies automatically.

For instance, the system might recognize you’re an e-commerce business and automatically recommend standard events like “view_item,” “add_to_cart,” “begin_checkout,” and “purchase” - complete with required and optional parameters based on industry benchmarks.

This smart generation process reduces developer dependency and ensures schemas remain lean, consistent, and scalable from day one.
You start with proven templates customized to your business model, giving every team clear, standardized specifications for what and how to track.

2. Syncs Schema Updates Across Teams Instantly

Instead of scattered documentation across multiple tools, automated systems provide a single source of truth for your entire measurement blueprint. Every team: developers, marketers, analysts, QA - accesses the same current schema specifications.

When updates occur, they happen in one place and become immediately visible to everyone.

No more version confusion. No more teams working from outdated documentation. No more implementation inconsistencies caused by communication gaps.

This centralization fundamentally changes how teams collaborate on measurement.

  • Developers implement events knowing their work aligns with marketing needs.
  • Marketers plan campaigns confident that tracking will capture necessary data.
  • Analysts design reports knowing the underlying structure is consistent.

In short, this is automated data quality checks at the source - ensuring consistency before implementation begins, preventing the schema drift that compromises your entire tag management system and GA4 data integrity.

Event schema automation

The Results You’ll See

Organizations implementing event schema automation experience measurable improvements across their analytics foundation:

  • Consistent Event Tracking Across Web & App: The same “purchase” event captures identical parameters across all touchpoints. Cross-platform analytics finally reconciles accurately because everyone implements from the same measurement blueprint.
  • Faster Implementation Cycles: Developers receive clear, standardized specifications immediately. Product launches proceed without measurement bottlenecks because schema requirements are immediately accessible and unambiguous.
  • Fewer Reporting Disputes: When schema specifications are clear, centralized, and accessible, teams stop arguing about definitions. This reduction in friction accelerates everything - from campaign launches to product releases to reporting cycles.
  • Reliable GA4 Data: With consistent schema implementation, your GA4 data integrity becomes trustworthy. Leadership makes confident decisions based on analytics that actually reflect reality rather than measurement inconsistencies.

The Bigger Picture: Measurement Excellence

Event schema automation doesn’t work in isolation. It’s the foundational pillar in a comprehensive approach to tracking consistency and GA4 data integrity.

Here’s how it fits into Tatvic’s measurement excellence framework:

Pillar 1: Event Schema Automation provides the measurement blueprint-ensuring definitions stay current, consistent, and aligned across teams. It’s the foundation upon which all other measurement processes build.

Pillar 2: Tag Auditor validates that events fire correctly according to schema specifications, catching implementation issues through automated data quality checks before they reach production.

Pillar 3: GTM Health Checker ensures your container implements the schema efficiently, maintaining configuration health and preventing conflicts that undermine tracking consistency.

Pillar 4: Data Sanity Automation verifies that collected data matches schema expectations throughout its journey into GA4, providing end-to-end validation of your analytics foundation.

Pillar 5: Additional advanced capabilities complete the framework, addressing continuous optimization and intelligence across your measurement ecosystem.

Together, these create comprehensive protection for measurement integrity - from schema design through implementation to validation. This integrated approach represents a fundamental shift in how organizations approach analytics infrastructure.

Instead of treating schema as static documentation, you maintain a living measurement blueprint that evolves with your business. Each element addresses a specific vulnerability. Event Schema Automation provides the blueprint. AI-powered tag audit processes confirm it’s implemented correctly. The GTM Health Checker ensures container optimization. Data sanity checks verify end results.

This is how Tatvic AI solutions transform analytics from fragile to reliable - not through isolated point solutions, but through integrated systems that protect measurement integrity at every stage.

Your Path Forward

The evolution of event schema management points toward automation, clarity, and consistency. Organizations adopting these approaches gain measurable advantages, faster implementations, more consistent measurement, and greater confidence in analytics foundations.

Manual schema management will always create bottlenecks. Static documentation will always drift from reality. The question isn’t whether schema inconsistencies exist in your measurement; they likely do.

The real question: Will you discover and address schema gaps before they compromise your entire analytics foundation and impact business decisions across the organization?

Understanding your schema’s actual state, rather than assuming it’s well-documented - represents the first step toward building truly reliable measurement infrastructure that scales with your business growth.

Stop treating your event schema as an afterthought. Start building it as the strategic foundation it should be. The organizations winning with analytics aren’t just collecting more data - they’re ensuring every data point starts from a solid, consistent measurement blueprint.

Ready to uncover the silent gaps in your measurement?

Talk to a Tatvic expert to get a Schema Health Check - and see how Event Schema Automation can transform your GA4 data integrity from inconsistent to insight-ready.

Book a Free Consultation →

Bot Icon
Bot Icon

Tatvic Bot

Explore About Tatvic and Services