Hello There!

Lorem ipsum dolor sit amet, consectetur adipiscing elit,

 About Sachin Patel

Sachin is lead developer of Tatvic Excel Add-in. Apart from HTML & CSS, he loves to design graphics. Sachin Patel

Is Your Tag Management the Wild West or Castle Black?

Majority of websites you visit (including this) are gathering data and loading content both in front of you and on the back-end. This is done through third party tags, which are fragments of code that can collect important analytics data for marketing and even provide frameworks for your prospects to write reviews. 

As these tags represent much of the page’s weight and are difficult to manage, they can cost a fortune to page load times, user experience, productivity and the overall bottomline.

At Tatvic we’ve observed that if you manage a large enough website: 

  • The tags are not configured on your website properly
  • There are unauthorised tags on your website
  • Tags are missing on your platform
  • There might be a case of duplicate tags too

Broken tags can lead to:

  • Broken paths on your website
  • Unauthorised access to your personal data
  • Slow page load
  • Inaccurate analytics data

It’s of utmost importance that you fix this. But with millions of instances of analytics and a ton of marketing tags on your website, where do you even begin?

Implementing a proper Tag Governance program, with the right solutions, is what you need. 

What do we mean by governance?

It’s exactly what you think - Control, authority, direction and oversight. This is what software programmers, developers, analysts want for their tags.  

It’s a discipline of data governance, aiming specifically on the data collected by digital marketing, analytics tags and sent over via network requests. 

It’s similar to tag management - a software powered discipline. In the way tag management relies on TMS, tag governance requires the use of a governance framework. 

What exactly can Tag Governance do?

Tag governance solutions can scan the network for requests sent through the websites and apps in various stages of development in order to point out tagging inaccuracies.

How?

Let’s go through the stages
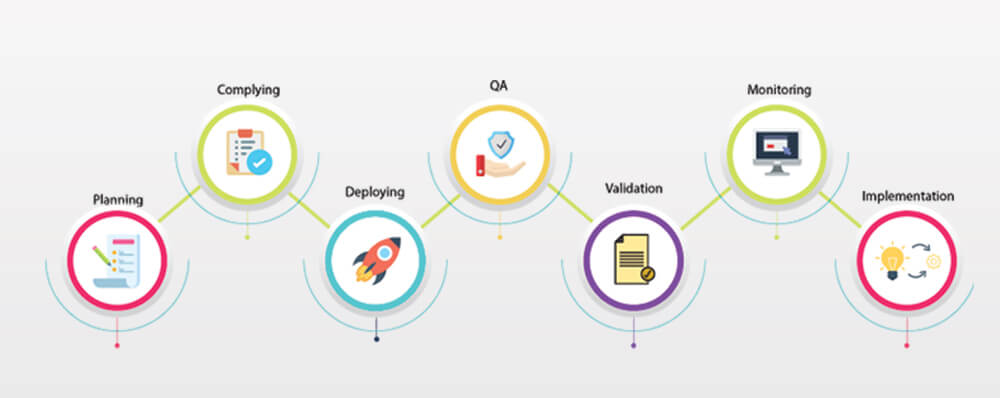
tag governance stages

Tag governance solutions move around platforms scanning for network requests sent by the tags deployed. Whenever the data is sent by the tags, the tag governance solution takes the data and deciphers it onto its component values. These values are further checked against those predefined rules to see if they’re right or not

The companies deploying tags to their website or apps should ideally do it in early stages, as early as the development phase.

An ideal tag solution should be able to perform platform, web and app, scans within pre-production environments. Practising this can help your development team resolve the issues before the website or app even goes live.

A tag error is moving away from tagging best practices or firm’s predefined rules. When a tag management identifies any errors it notifies the relevant stakeholders.

Can you do it manually?  

Speaking theoretically - you can spot check the network logs in search of tagging errors but this process is highly inefficient and prone to errors. Manual checks are like the casual medicines you take, the benefits are there but they’re insignificant when the side effects hit. 

It’s a known practice to adopt automation and avoid cardiac arrest on your tagging deployments.

Afterall…

With the right solutions in place governing tags at scale gets easy. You’ll be able to trust your data, realise the ROI on the spend and do it more efficiently than doing it manually. 

DLAT-Tatvic

Tatvic has developed a solution, DLAT,  that encloses all the essential elements of an efficient Tag governance program. This is a cross-team, multi role effort, but will be worth it. 

Planning Stage

Instead of your team deploying tags randomly, you need a plan in place. This plan will document your needs - measurement and marketing strategy, giving an overview of what the tag is doing and why. 

This planning enables you to map your business questions against the variables that collect the data you need. The same thing applies to tags that add features to your platform - you need to have a plan of when and where to implement them. 

Complying

GDPR compliance have incited panic on the data privacy and protection regulations. Instead of protecting data because the authorities told us to, we should be protecting customers data that we’re trying so hard to acquire. 

Many firms are excited to see the sort of data they can collect about people, but don’t want the same to happen with them, on an individual level. This kind of mentality can be pretty dangerous for companies not just in terms of legality but as a matter of brand optics and ethics too. 

Your tagging plan should know what type of variables you should collect and which you should never collect. Using tag governance solution you can always track the tags and variables for a pattern.

Deploying

A firm that applies tag governance in the initial stages can always fix tag errors before they get expensive. 

Developers are not ground-zero - there should be planning that goes into measuring data and marketing strategy before developers even set steps inside the office. 

A good product manager will always ensure the developer knows exactly what kind of QA measurement requirements should be met with every feature. So that when the developers create a data plan for implementation, they have specific lines to follow. 

Finding problems in the development stages is less risky because the data is a mock data - you’re not working with real customers with real data, just test accounts. You can ensure tags are working as expected and also test for non-compliant data before you go to the production stages and upset your users. 

QA

Analysts and Digital Marketers were historically taking it upon themselves to test for tagging errors in a production environment because it was their data that was at stake. 

The problem with this process  is that tagging errors in production are expensive and difficult to locate. Companies now have responded and have started deploying more engineers to test against measurement requirements during QA

As the final gate before the website moves into the production stages, QA engineers have an important role in testing analytics and other marketing tags. 

Tag governance helps them automate the iterative tests so that they can make sure the tags are working well under various environments and conditions. This keeps the website cycle agile, also minimising the broken codes at the same time. 

Validation

You’ve just published a new release on the production environment. Now what you want to do is to ensure nothing broke down when you went live. 

When making a website live, tagging errors are pretty common. To counter the problem technology stakeholders take it upon themselves to check for errors. It’s an uphill battle. The sheer size of the website makes an audit unrealistic. Moreover, we, as humans, aren’t equipped to mass scan data for errors. 

People believe in shortcuts and make exceptions. They aren’t systematic like a program. Even if you have the resources, many people, looking for tagging errors you wouldn’t have bulletproof results versus an automated test. 

Replacing manual checking with tag auditing, monitoring and validation can help you test your tag implementations in a much faster and with more accuracy. 

Monitoring

What you need to do next is to monitor your tag performance in regular intervals. When the tagging errors assemble, you want to be the first one to know. 

Guess what? Websites break down

In an ideal world a functioning website in production would never have any problems. But it’s not an ideal world. Somewhere somehow volatile data makes its way into analytics variable, or an additional tag pops up from an ad-serving tag. 

You need to continuously test the production environment to ensure everything falls in place with the tagging plan you create at the beginning.  

Tagging errors always come up in the production stages. You can’t have someone monitoring tags, all the time, to ensure smooth running. A tag governance solution can do the heavy lifting for you here, periodically checking your platforms for any tag errors. 

Implementation

Digital analytics and marketing technologies present significant value to your firm when implemented properly, of course. These techs rely on tags and tags rely on proper implementation. By using an automated solution to govern tags you can achieve greater accuracy. 

So, how many broken tags do you have on your website? Schedule a call with Tatvic rep to get a first hand look at your entire tagging system.

Developers Guide for Interpreting Google Analytics Reports to Optimize Web and Mobile App Performance

Note: This article was originally published on Martech Advisor

You keep checking your Google Analytics reports on a daily basis to see if your customers are performing well on your website/mobile app. But, is your website/mobile app performing well for your customers? What can a website/mobile app developer do with Google Analytics reports? What are some of the Google Analytics reports that can directly guide developers to optimize their website/mobile app and how can a developer interpret these Google Analytics reports?

A general understanding amongst Google Analytics users is that it is for Business Analysts, Product Managers and people performing business-related roles. However, there are some pretty useful reports/sections in Google Analytics which can directly benefit developers to help them understand the website/mobile app performance and optimize them.
Majorly, there are three go-to reports in Google Analytics for a developer to get these insights:

  • Site Speed Reports
  • App Speed Report
  • Crashes and Exceptions Report

Now, let’s have a look at these reports in detail and understand how to make use of them. You’ll need access to your Google Analytics account in order to access these reports.

Site Speed Reports (for websites only)

With the help of Site Speed reports, you can understand how quickly users get to see and interact with your website content. You can identify the areas/pages on your website to be optimized and get an insight as to what extent do you need to optimize. There are 4 different reports of Site Speed reports:

Image 1: Site Speed reports in Google Analytics

  1. Overview
    The Overview report shows a group of Site Speed metrics which can be used to track the speed and technical performance of your site. A list of metrics that you see in this report is explained below:

    • Avg. Page Load Time (sec)
      This is the average amount of time it takes for pages from the sample set of pages to load, from initiation of the click on a page link to load completion in the browser for that page.
    • Avg. Redirection Time (sec)
      The average amount of time spent in redirects before fetching this page. If there are no redirects before the page loads, the value for this metric is supposed to be 0.
    • Avg. Domain Lookup Time (sec)
      This is the average amount of time spent in DNS lookup for this page. The lookup basically happens before the site loads and it can be longer if the content is being pulled from multiple domains.
    • Avg. Server Connection Time (sec)
      The average amount of time spent in establishing TCP connection for this page.
    • Avg. Server Response Time (sec)
      The average amount of time your server takes to respond to a user request, including the network time from user’s location to your server.
    • Avg. Page Download Time (sec)
      The average amount of time to download this page. This represents a portion of the total page load.

      Image 2: Site Speed metrics in the Overview report

  2. Page Timings
    The Page Timings report gives you a detailed analysis of how your site pages perform individually and as compared to other pages on the site. There are tabs and subtabs available under this report as explained below:

    Image 3: Various tabs in Page Timings report

    • Explorer
      Shows you the page data in the context of different dimensions. This has three sub-tabs:

      • Site Usage
        Covers basic interaction metrics such as:

        • Pageviews
        • Bounce Rate
        • % Exit
        • Page Value
      • Technical
        Gives a comparison based on technical metrics such as:

        • Avg. Page Load Time (sec)
        • Avg. Redirection Time (sec)
        • Avg. Domain Lookup Time (sec)
        • Avg. Server Connection Time (sec)
        • Avg. Server Response Time (sec)
        • Avg. Page Download Time (sec)
      • DOM Timings
        Gives a comparison based on Document Object metrics such as:

        • Avg. Document Interactive Time (sec)
          This is when the page is still loading, but the user can start interacting with your page.
        • Avg. Document Content Loaded Time (sec)
          This is when everything in the DOM has finished loading.
    • Distribution
      Shows you the timing buckets for different Site Speed metrics. You can select any of the available metrics in the report and see the buckets based on different time durations and understand the number of pages falling under each bucket.
    • Map Overlay
      Shows you the geographic data in the context of different dimensions. This has three sub-tabs:

      • Site Usage
      • Technical
      • DOM Timings
    • These sub-tabs have the exact same set of metrics but displayed based on the geographic data instead of page data.
  3. Speed Suggestions
    The Speed Suggestions report serves you with optimization tips tailored to your site pages. These suggestions should be taken into consideration while optimizing low-performing pages on your site.

    Image 4: Speed Suggestions report

    There are main two metrics for this report as shown below:

    • PageSpeed Suggestions
      This is simply the number of optimizations suggested to make your page load faster. These suggestions are served from Google’s PageSpeed Insights tool which also provides you with implementation steps for these recommendations. Very helpful!
    • PageSpeed Score
      The metric indicates the extent to which you can improve page load time. A score nearing to 100 means less room for improvement. A lower score suggests that you should consider improving the page load time.
  4. User Timings
    The User Timings report gives you the insights on how individual resources (for example, forms, images, videos, banners, buttons) on your website are performing with respect to user interactions.

    Image 5: User Timings report

    The three tabs present under this report are:

    • Explorer
      Shows you the page data in the context of different dimensions. The report has two new metrics as explained below:

      • Avg. User Timing (sec)
        This is the average time for user interaction measured in seconds.
      • User Timing Sample
        This indicates the volume taken into consideration for measurement.
    • Distribution
      Shows you the timing buckets for different User Timing metrics.
    • Map Overlay
      Shows you the geographic data in the context of different dimensions.Note: You will have to implement Timing hits for all the user interactions that you want to track and see in User Timings report.

App Speed Report (for mobile apps only)

With the help of App Speed report, you can analyze how long your app takes to respond to user interaction requests. However, you don’t get to see data in this report if you haven’t done additional implementation to track the timings for user interactions. Implementation guides for user timing implementation are available for both Android SDK and iOS SDK. Once you have necessary implementations in place, you should see data in the below tabs in the report:

Image 6: Navigating to App Speed report

  1. Explorer
    This tab shows the Timing Category dimension denoting to each user interaction you have tracked for load times along with the Average User Timing metric to show the average time it takes to perform the action.
  2. Distribution
    This highlights the User Timing Buckets for various ranges of the length of time (in seconds) which the tracked actions take to load.
  3. Map Overlay
    The tab gives a geographical distribution of Average User Timing metric. A lighter shade denotes shorter time to load and darker means longer time.

All the tabs under App Speed report uses the User Timing Sample and displays the number of users used while calculating the average length of time metric for each action individually. The sample rate for this report is set to 1% of total users by default.

Crashes and Exceptions Report

The Crashes and Exceptions report is a very helpful report which gives you an insight on what are the different types of exceptions your mobile app is throwing and how many times the app crashes either due to these exceptions or due to other technical errors.

Image 7: Crashes and Exceptions report

The report gives you a brief description of the exceptions. Crashes are automatically parsed out from other exceptions.

Image 8: Viewing Exception Description in the report

For more detailed exceptions, you should define additional exception types in the app tracking code. You can refer how to implement and define exceptions in the app tracking code for Android SDK and iOS SDK before you can see relevant data in the report.

Concluding the blog

I hope that these reports prove resourceful to you for detailed technical analysis of your website and mobile app performances. If there are any reports that you use for gaining insights for the developers, we would love to know about them. Feel free to leave a comment and tell us about it.

Bot Icon
Bot Icon

Tatvic Bot

Explore About Tatvic and Services