Hello There!

Lorem ipsum dolor sit amet, consectetur adipiscing elit,

 About Jitendra Verma

Jitendra Verma is working as campaign manager in Tatvic. He has been running successful digital marketing campaigns for the top e-commerce giants.

Optimize Ad Serves in DoubleClick For Publishers (DFP) Using Customized Audience with Google Analytics 360

Majority of leading digital publishers are having a hard time identifying & capturing the interests of their audience while also retaining them through various touch points - the most important ones being Optimized Ad Serves. Our previous blog on DoubleClick For Publishers (DFP) discussed ways to create audience segment and exporting it to DFP.

In this blog we shall discover different ways to optimize ad serves through DFP Ads by targeting high intent users on digital platform based on their affinity and interaction with specific type of content. This gives space to publishers for optimizing it in a personalized manner. Targeted audiences yield benefits by increasing the revenue or by narrowing the cost to publishers. This is best achieved by blending tools like Google Analytics 360 and Doubleclick For Publishers.


Standard Audience vs Customized Audience
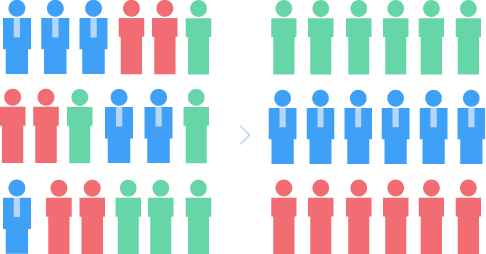
Standard Audience: These are the set of audiences who are available with us or who are visiting our website.  For this audience you have no further information. For this audience you have no further information. There is a lack of information about their interests or geographical location, or even the content they consume.

                                                                 Image 1: Standard Audience


Customized Audience: These audiences shares some similar traits. Like, similarity in browsing location, device, and skewed interests in particular set information. For example, interests in insurance related news, or crime news based, etc. reflects on their behavioral attributes . This audience represents a uniform group or segment sharing similar characteristics.



                                  Image 2: Customized Audience
Why Customized Audience is so Much More Effective Than the Standard Audience?

Every advertiser is looking for their own users’ behavioral pattern. This is because every company is now focused towards personalized Ads instead of showing generic Ads to the mass audiences. To do such personalized targeting, we need audience’s personal attributes. This includes age group, gender, etc. which will fetch us more information about their behavior.

Publishers may fail to generate the expected revenue when the Ads are too generic for large mass of audiences. To avoid this, you can identify user’s interest to target only relevant Ads. This results in high probability of conversion and thereby witness increment in revenue. Below are a few examples of different types of audience segments that you can define and take into consideration.

Types of Audience Segments:

  • Video Consuming Users: Users who consume video content more than textual content on the website
  • Cross Content Viewers: Users who are reading more than one type of content
  • Peak time: Users who are heavily engaged at a particular time on website
  • High end users: Users who have an affinity toward premium gadgets or luxury products. For ex. Users who are currently using high-end smartphones like Apple X or Google Pixel 2.
Use Cases to understand the benefits of audience segmentation to optimize ad serve using DoubleClick for Publishers

Two of our digital publishing clients from the leading news and media companies in India, had been facing an issue in optimizing ads serves cost vs. revenue through their ads serving. Also there was a need to reduce the advertiser expenditure which was keeping them from achieving their desired results.

  • Increase in Impressions:

Problem faced: Our publisher client had large sets of audiences visiting from the mobile site as opposed to their desktop site. The digital publisher also had their ad serving strategy in place to target the cohort of their high end users. But, it failed to create value for a defined set of critical DFP business metrics.

Solution: After understanding their problem, our team identified various audience segments from the historical data. We discovered that majority of users were high-end smartphone users like iPhone or Google Pixel. Majority of the user engagement occurred during a particular time of the day, between 1:00PM to 5:00PM. This analysis helped them to channelize their marketing efforts to the right set of audience.

The above use case is based on analyzing the audience behavior and their interests. Such analysis on past events help us to identify the user requirements. This results into a subset of audience segments that are actually interested and hold a higher potential to convert as compared to others.

Result: Sudden rise in impressions of the ads by 2.5X as compared to the previous month.


  • Personalized targeting:
                                  Image 3: Personalized Targeting

Problem faced: Our other digital media clients was struggling with serving relevant ads to different sets of users. The key parameters of this ad serving strategy needed to consider the users’ demographics, interests and affinities. Being a data driven company, their vision was to drive actionable insights based on the first party audience and to also create a better engagement by serving personalized ads.

Solution: After having analyzed the user behavior, we discovered that a majority of the client’s users were from an Indian metro city from a particular source, Facebook. First, these set of users were searching for a topic under entertainment and were then engaging in related discussions on Facebook. We categorized them as high intending users. Later, we segmented those users as interested in entertainment and coming from metro cities i.e. our required audience. Now, to derive the set of audience to be targeted, we separated the said cohort from the publisher client’s universal audience.

Result: 1.5X increase in click through rate within 1 month

Concluding Thoughts:

Using the focused audience segmentation based on user behavior by Google Analytics 360, you can create a segmented audience and then export it to DFP. You can then use it for an optimize ad serve strategy.

Are you a digital publisher on the lookout for consultation to create a highly effective segmented audience to optimize ad serve? Tell us about it and we’ll help you out.  

In case of any queries or doubts, please leave a comment below, and our team will get back to you with a quick solution.


How to make Email Re-marketing more effective using Google Analytics data

Google Analytics data for email ca


Email marketing campaigns are run by thousands of businesses of all sizes across the globe. Email forms a stable foundation for digital marketing. It’s a channel that drives results for businesses.

But, do you know you could use Google Analytics data for email re-marketing?

Let’s take a use case where we can send out emails to either converters or non-converters using GA segments. For converters, up selling or cross selling can be the objectives, whereas for non-converters, the objective could be to prompt them for completing the transactions or generating awareness.

Now let’s see how it’s done.

Step 1:

Make Email Marketing campaigns effective
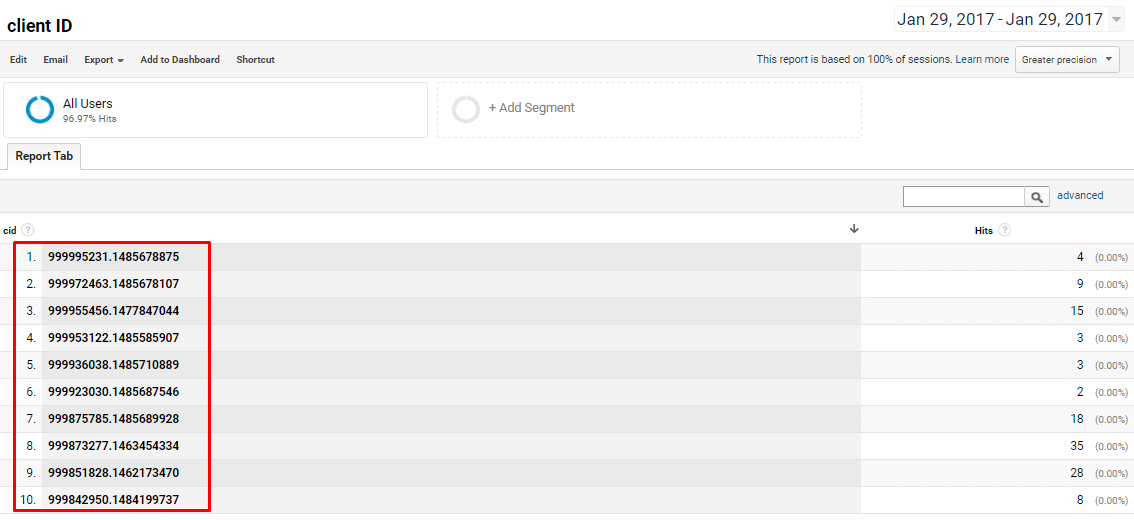
We need to make sure that we are capturing Client IDs for non-converters and converters in Google Analytics as well as back-end. This is important because we match the Google Analytics Client IDs with back-end Client IDs and send emails to users whose email IDs are recorded in the back-end. Here, the Client IDs serve as a key to connect Google Analytics and email IDs which are stored in the back-end.

Step 2:

Email remarketing using Google Analytics data
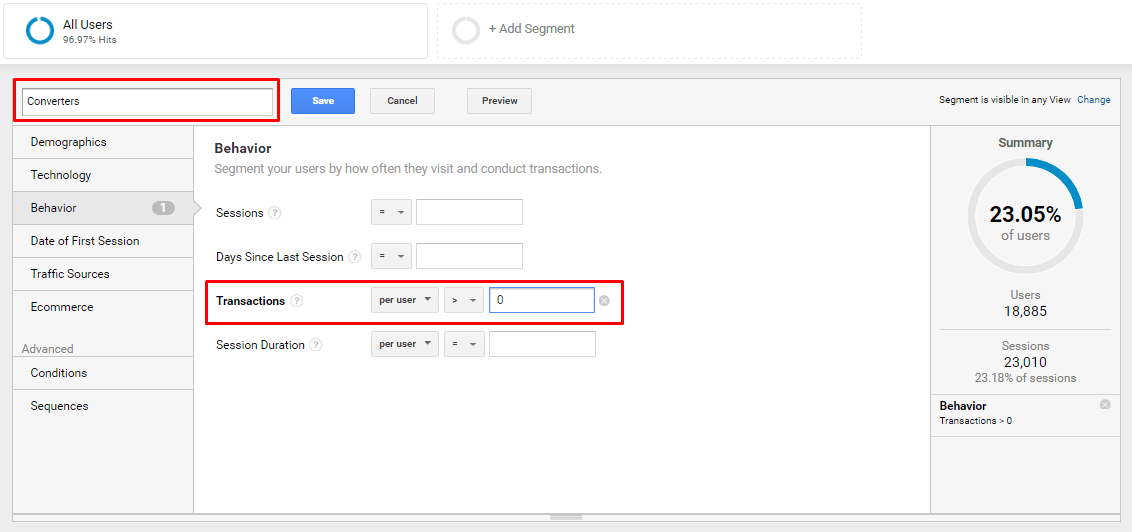
Now, we’ll create segments for converters or non-converters or both. For converters, we can apply a condition like “include users who have visited the Thank You page”. For non-converters, we can apply a condition like “exclude users who have visited the Thank You page”. (More on creating a re-marketing audience by integrating Google Analytics with CRM here)

Step 3:

Google Analytics remarketing
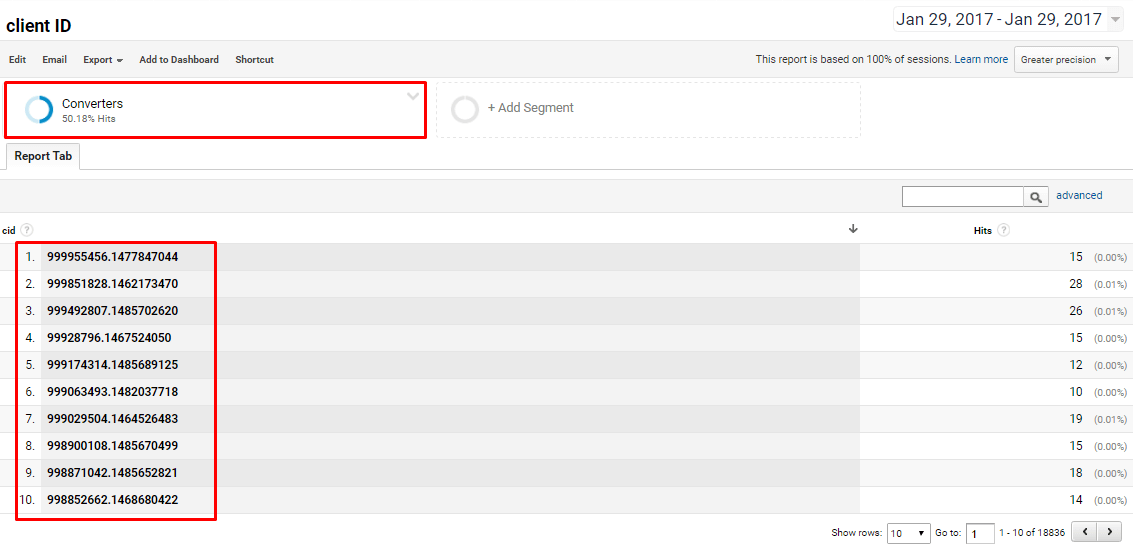
After creating segments, we need to create a custom report where we can extract Client IDs after applying the particular segment. Once the Client IDs are there for a particular segment, we can match them with the back-end Client IDs, against which we will get the email IDs.

Step 4:

email remarketing with Google Analytics data

Now, we just need an access to a platform through which emails can be sent. Here, we need to emphasize on the content and subject line. The subject line should be attractive which drives the attention of the users. The content should be applicable to the segment which we are targeting. Basically, we should not send up-selling content non-converters as they did not transact earlier for a lower amount as well.

Here is how we can make our email campaigns more effective:

  • Use of segments:

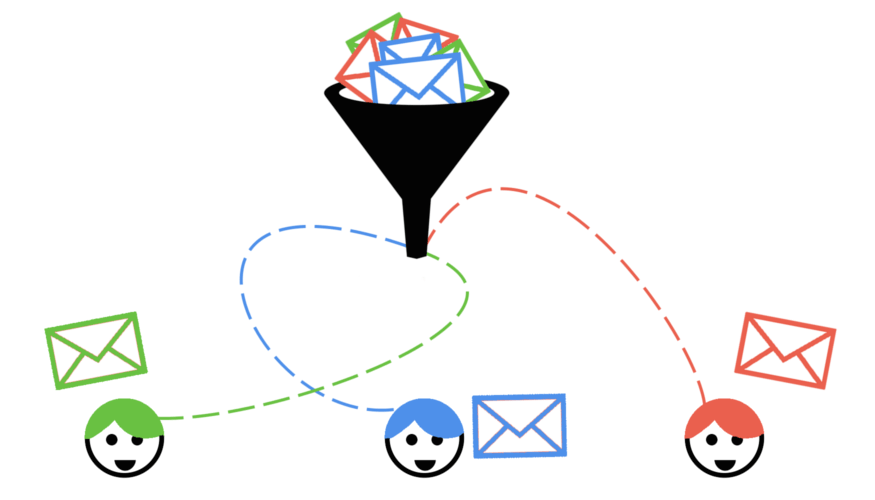
    We should always try to segment the Google Analytics data for Email Targeting. Create segments of converters, non-converters or users who completed a specific journey on the website or App (e.g. users who just viewed home page, users who viewed product page, users who actually added product to the cart, etc.). The selection of segment should be based on your marketing objective. If the objective is to drive awareness about your brand, then the segment of users who viewed homepage will be valuable. If the objective is to show discount benefits, then the segment of users who added products to the cart will be relevant.Make Email Marketing campaigns effective

Image Source: Zapier
  • Content Customization:

    Personalization is key. We tend to appreciate emails more if they’re personalized and of our interest. If the Email creative is customized, then there are high chances of better Email Click Rate. Suppose, if a brand has been endorsed by a particular celebrity and if his image is present in the promotional email, it can create an impact on the campaign’s performance. The names, email IDs and phone numbers stored in the CRM data can be used to develop content as well.

  • Subject-Line Selection:

    Studies show that subject lines fewer than 10 characters long have an open rate of 58%. Thus, having a concise subject line makes sense. In order to craft a personalized subject line to obtain a high Email Open Rate, parameters like name, phone number, name of the product which they added to cart, etc. can be used in the subject line. This information will already be available in the CRM data.

Email remarketing using Google Analytics data

  • Best Time for Emails:

    While many a quality email may be built during business hours, the ones with the best open rates aren’t being sent from 9 to 5. The top email strategy is to send at night.
    Experian Marketing Services found that the time of day that received the best open rate was 8:00 p.m. to midnight. This block not only performed better for open rate (a respectable 22 percent) but also for click through and sales.

  • Send Emails On Weekends:

    While not as overwhelming a winner as the 8:00 p.m. to midnight time of day, Saturday and Sunday did outperform their weekday counterparts in Experian’s study of day-of-week performance.

Conclusion:

A little smart work in terms of maintaining client IDs as the primary key in Google Analytics and CRM data will help in fetching e-mail IDs of the segments that we want to target. Targeting the segments with appropriate content will help in achieving more reach, which, will eventually help your organization increase its revenue. Have any ingenious email remarketing tips? Drop a comment below! For help in launching and monitoring your email campaigns, contact us here.

Google Analytics Training Concepts Simplified

GA

As a Google Analytics 360 reseller, our job entails visiting a considerable number of companies that include e-commerce, media & lead generation websites. We also train Google Analytics users i.e. Marketing, Product & Analytics teams, and a majority of these mostly do not have formal technical qualifications. Drawing from our experiences, we thought it would be interesting and, hopefully, useful to a larger audience of users who do not have a technical background. Explained below, are a few Google Analytics concepts with real-life (offline) examples that everyone can easily relate to.

What you know about offline business, also applies to online business…

Analytics System

Google Analytics key termsOffline: Imagine you’re the owner of a retail store where people come and buy different products. To optimize the products, inventory, and look and feel of the store, you need to know where your visitors come from, and what activities they perform in the store. Hence, you appoint a consultant

who will monitor, collect and analyze this information?

Online: For an online business, Google Analytics plays the role of the consultant you’d hire to monitor these activities for your website and/or mobile app. Sheer large volume, complexity, and velocity of data in an online business require a sophisticated tool like Google Analytics.

Google Analytics term definitionsUser Identification

Offline: Monitoring a customer in an offline store is a tedious job. Some retail stores use loyalty cards to keep track of their user’s activities. These cards generate a unique ID for each customer and store the data in CRM systems like HubSpot.

Online: Google Analytics generates a unique cookie named _ga, which stores each user’s unique ID and subsequently, all the activities of the user are attached to this unique ID.

Returning Users

Offline: Once a customer is given a separate identifiable number by way of a loyalty card, the moment he/she returns to the store the next time, the system identifies him/her as a returning customer through the unique ID number in CRM.

Online: Identifying returning users online is very easy. If the cookie is already present in the browser, the user is NOT a new user but a returning user.

Google Analytics training termsSessions

Offline: The period during which your customer remains in the store is a visit or a session. Sounds simple! But now, consider a scenario where he/she gets a call from a friend and stops the shopping activity and resumes after 5 minutes. Would you consider that as two different visits? Of course, no.

Online: Similarly, the time in which a user remains in the system is a session. The session ends when the user leaves the website. However, an interesting factor here is that, by default, Google Analytics sessions continue for 30 minutes on inactivity. So, in case, while shopping online you close the browser and open it again within 30 minutes, Google Analytics is smart enough to record only one visit instead of two. But watch out! Google Analytics ends the session at midnight i.e. at 12 AM.

Google Analytics definitionsHit Type

Offline: Each time a user visits the store, he/she performs activities like viewing the products, comparing them, using signboards, inquiring with a customer care executive, using gift cards, and finally, purchasing the product. He may not necessarily buy though, and may simply leave the store without any transaction.

Online: Similarly, here, the user does a lot of interactions and activities like PageViews, using the search option, using the filter option, using the navigation menu, clicks, mouse hover, and many types of E-Commerce activities like Product Impressions, Product Clicks, Add-to-cart and Purchase. All these individual interactions are ‘Hit’ in Google Analytics. Each of these hit types carries different data to Google Analytics. A user might have one or many sessions during a period and one or many hits in each session, however vice versa is not possible.

Closing Thoughts

Often, using real-life examples makes it easy to communicate ideas. This was a small attempt to start the thought process to understand the technical concepts through real-life examples we generally face. Feel free to add to the list by commenting below & we’ll include your examples in our next series on the same topic (with all the attribution to you, of course!)

Google Analytics Real Time Data in Google Sheet

Google Analytics Real Time Data in Google Sheet


We are well aware of the fact that Google Analytics 360 has real-time data available. But not everyone is aware that if you want to export this data, Google Analytics 360 does not allow its users to export all rows. The maximum number of rows that you can export is limited to only the top 10 values of the dimension that you’re looking at.

Google Analytics has also provided Real Time Reporting API which you can use to pull all the data, and if you are a developer, you can do so with any scripting language and create a dashboard. But, in this blog, we are going to see how you can pull all your data into a single Google Sheet with Google Apps Script with minimal effort. One of the biggest advantages of working with Apps Script is that you are already in a Google Authenticated environment. So, you need not worry about the authentication handshake since all the users will be authenticated by Google itself. This means you can access Real Time data with just a few lines of code. There are only a couple of configurations that you first need to achieve and that’s it, you are done.

Setting up your project.

  1. Create a new Google Spreadsheet.
  2. Click on Tools and from the drop-down menu choose Script Editor.
  3. The above operation will open a Script Editor in a new tab.


Script Edior

4. Our task is to fetch the Google Analytics real-time data for which we have to enable Analytics API.

5. To enable Analytics API, click on Resources -> Advanced Google Services.

Adv.Google Services

6. You will be prompted for New Project Name. Give a desired name and then pop-up for Advanced Google Services will be listed.

Name

7. Choose Google Analytics API and enable it.

8. You need to enable this API also in your Google Developers Console.

9. Click on Google API Console.

10. Click on ENABLE APIS AND SERVICES.

11. Search for Analytics API and enable it.

12. Here we shall pull dimensions Source & Medium, and Active user as Metric. Go back to your Script Editor and use the below snippet of code with a couple of changes as listed below:

a. Change your Google Analytics View ID

b. Change your Google Spreadsheet ID

Code Snippet:


13. Now, click on Run to run the script check in your Spreadsheet your data would be populated.

Below are reference documents that will help you to pull different dimensions:


Benefits of using Apps Script for fetching Google Analytics Real-Time Data

  • No need to write code for user authentication as the same will be handled by Google.
  • You can start taking decisions in the meantime you have access to real-time data.
  • Utilize this as a data source in Google Data Studio custom visualization to build more enhanced dashboards.
  • Automate script execution by setting a simple time-based trigger.
  • Set up a custom mail notification with App Script to get notified if something is found wrong with the existing data.

Note: Do check the quota limits of Real-Time API and set the trigger to refresh data accordingly.

Concluding Thoughts

We are now familiar with using Real-Time API with App Script to fetch real-time data from Google Analytics. But this is not just an end yet. You can also build more enhanced dashboards or even a product with this script. You can run API queries in different ways to fetch data in sorting or in a particular range order just the way you wish to explore.

How to Show Facebook Ads Insights Data in Google Analytics?

How to Show Facebook Ads Insights Data in Google Analytics?

Facebook is a wide network that bags a huge amount of audience. It has, therefore, become one of the most effective platforms for running various ad campaigns for businesses to draw users to their websites and apps. A lot of advertisers around create campaigns and have specific goals set for each campaign. Being as user-friendly as it is, Facebook Ads Manager has a simple interface for setting up ads & campaigns. This is purely based on what your business objectives are - be it brand awareness, user engagement, or app installs and conversions.

Although, Facebook Ads are on top of the acquisition charts, measuring the App Install Ads’ performance in 3rd party Analytics Tools, like Google Analytics, is a challenge. This holds true as Facebook strips out the “UTM parameters” when the user is redirected to Play Store or App Store. Here we’ll draw your attention to the below report (screenshot) that consists of Install Referrer data in the Google Analytics Dashboard where no “facebook/referral” data is found.

Ads Install Dashboard

This particular use case has been a pain point for a lot of marketers - including some of our clients. To find and fit this missing piece of a puzzle in your digital analytics game, our team has come up with a solution. In fact, it’s a sort of tactic that helps you track the App Install Ads data in your Google Analytics Dashboard. And that is exactly what I am going to take you through in this blog:

Mechanism of the solution, we are confined to:

  1. A Facebook Ad is configured with setting an Objective of “Traffic”, although we are going to track App Installs with this Objective.
  2. Direct the Ad Traffic (i.e. users) to a blank web page, rather than directing traffic to a Google Play Store / App Store. Ensure that the Campaign UTM Parameters are present in the URL when redirecting the users.
  3. On the web page where the traffic is directed, halfwit the traffic by either opening the App forcefully if it is already installed. Ore better, redirect the user to Google Play Store for installing the App.
  4. Make sure to that all the query parameters including the UTM Parameters are retained in all the re-directions for proper App Install Attributions in Google Analytics.

Implementation Steps :

  1. Configure Facebook Ad Dashboard with the following options.
    • Create an Ad with the objective “Traffic”, as opposed to the objective of App Installs.

Marketing Objective

    • Further, continue with feeding in other necessary details required for the Ad configuration.
    • When it comes to providing LINKS, provide a webpage link where you want to direct the traffic.

Ads Manager

  • A few mandatory query parameters should be appended to the URL when the traffic is directed to the above-mentioned destination URL:
    • utm_source * : (original referrer, e.g. Facebook, newsletter4)
    • utm_medium : (marketing medium, e.g. post, adl)
    • utm_campaign : (product, promotion code, or slogan)
    • utm_term : (paid keywords, e.g. running+shoes)
    • utm_content : (ad-specific content used to differentiate ads)
    • Landing Screen * : (path to the landing screen of an Ad)

Example of the final URL generated to redirect the traffic on the web page:

URL for Traffic

2. Configure the below-mentioned steps on the web page where the traffic is redirected :

  • On the blank web page where your traffic from the Facebook Ads is being directed, a javascript code that we’ve developed must be present. This is to identify whether the app is installed or not. In case where the app is installed, a user will be redirected to the app, else, will be redirected to the Play Store. 
  • Below is the sample javascript code that we wrote:

Javascript Code

It is recommended that the Deeplink URL that is generated here should not have the host and scheme name similar to normal web pages as this URL will open another web page rather than opening the App.

Use such Deeplinks to open the App:

Deeplink_example

You must have Google play and General campaign attribution tracking implemented in your app. This will let Attribution to reflect in Google Analytics based on the UTM Parameters.

After the successful implementation of the above-listed steps, you can effectively track your Facebook App Install Ad Campaign performance in Google Analytics.

Here’s a quick glance at the Pros and Cons of this setup.

Pros:

  1. You can track all those users acquired through Facebook Ad Campaigns without depending on any other third-party tool.
  2. A User can either be drawn to an app using DeepLinks or be forced to Install the App. Either way, a direction of the user will always lead us a step ahead towards the conversion.
  3. Save the cost of using another analytics tool that you use to measure Facebook App Install Ads.

Cons:

  1. Following the above approach will not let you track data on the number of installs for the Facebook Analytics Dashboard. Hence, if you are highly dependent on Facebook Analytics data, do reconsider implementing this tracking setup.
  2. A definite requirement is that of using a javascript code to redirect users. If there are many deep-link schemas, you may have to write extra code to handle all those schemas. Also forcefully redirecting a user can cause a bad user experience.

Now that we are able to track the correct attributions of Facebook Ads for App Installs in Google Analytics, we now have a clearer picture of how social media ad campaigns are performing.

It is very helpful in deciding how your marketing campaign is acquiring users. But to check these figures on multiple platforms is a big headache. Marketers can evaluate the total in-app purchases for Facebook ad campaigns through Facebook Analytics. For other third-party campaigns, they can always keep an eye on Google Analytics. 

Try out this tactic for Facebook Ad Installs and share with us the results you have achieved using this method. We’d appreciate reading your comments and addressing any concerns that you may have.

Migrate your website to new host for enhanced Google Analytics Tracking

Google Analytics is one of the most powerful tools to track your WordPress website’s performance. You can find out what you need to do, to improve and make your website more successful, since it gives an overview on your website’s visitors.

How?

Google Analytics can help you make data-driven decisions by showing you the stats like the geographical location of your audience, Apart from this, standard metrics include the number of users interacting with your application, the screens or web pages that they visit, and number of sessions those users create.

Google Analytics has also found that users respond to different websites located on different web hosts in different ways. The web host you use will have an impact on how your website will be ranked in a search engine

For bounce rates to be lower, one of the most important factors remains the kind of web hosting service a website uses.

While the right web hosting company will not guarantee a boost in your website rankings, it does make a difference. In this manner you can avoid any hazards of choosing the wrong web host for your website. Therefore, you need to choose the right web host for your website carefully.

Factors that affect web hosting

  1. Downtime
  2. Low Speed page loads
  3. Local server Location

You will need to regularly review  the web host speed and downtime. By moving your site to a less busy server, or even a dedicated server, you will instantly notice page load speeds to be improved. Local Servers slow down your site. They affect a website’s SEO ranking since they can fluctuate significantly from time to time. Therefore, it’s wise to not associate yourself with a web hosting service for too long..

Even if you have signed up to a long-term hosting contract, since you might be having problems with website performance, you could forget about the money paid and move to another host anyway. This is a better option compared to doing long-term SEO damage to your website.

Migrate your website to a new web host

In such cases you will have to migrate your website to an appropriate web hosting service to accomplish a steady SEO ranking. A migration plugin like Migrate Guru can help you migrate your website from one web host to another.

Migrate Guru gives WordPress website users the power to move, duplicate or clone site from one web host to another. It does not overload the source website, and ensures that websites even as large as 300 GB can be moved without any downtime.

Migrate Guru Tutorial Video

  1. Install Migrate Guru

    Migrate Guru installation . There are two ways to install Migrate Guru.

    • Upload through WordPress dashboard
    • Upload via SFTP
  2. Complete the Migrate Guru form.
  3.  

    To receive email alerts and details of your site migration, enter your email address.

From the set of web hosts present, click on the web host you are transferring your website to.

3. Fill in the Migrate Guru form with your site details.

The details are your destination web host credentials.

The plugin will give you a small form to fill up with the following fields.

  • Destination Site URL of the site or domain on your new web host.
  • Destination Server IP address of your site configured on your web host account.
  • Click on Advanced Options only if the site being moved or the destination site are https:/’ instead of http://.

To find these details, follow the steps below:

  1. Login to your web hosting service account and click on the Menu bar.
  2. Click on Hosting and pick cPanel.
  3. The destination server IP address is on the left-hand bar of the cPanel page.
  4. For cPanel and SFTP username, access your web hosting service account. The email from your web host when you first signed up for an account will also have these details. The password is usually set when signing up for web host service. It is the same password you use to login to your regular web host account.

Note: On the chance that the URL of your site start with ‘https://’, they are HTTP validated. When your web have domain URL is HTTP confirmation secured, you would have gotten an email with the credential validation. These can likewise be recovered from the site’s server logs.


Migrate Guru will send you an email notification to the email address you entered, to confirm the details of your site migration process.

The real-time progress of your website migration should be visible on the screen. A link to this can also be found in the email sent to you. You do not have to keep an eye on the browser window once the migration begins.

To sum up:
  1. Install Migrate Guru
  2. Eter your hosting details
  3. Click Migrate.

Migrate Guru is the best tool for a stress free site migration. It is uncomplicated, making website migrations a breeze!

Install Migrate Guru from here

If you have any queries you can contact the Migrate Guru team using their contact form at support page.

The bitter truth is that a website that is hosted on a bad host is destined to become a disaster. It is better to pick a suitable hosting option or else be prepared for poor SEO rankings, sudden website crash, downtime, and greater load time.

A Quick Guide to Adding Multiple Google Tag Manager Containers In A Single Android App


Introduction

If you work with Android Apps, you know for a fact that there are situations where you might want to add multiple Google Tag Manager (GTM) containers. One of our clients was in this very situation and an added problem that they were facing was that their GTM container was full.

We were now facing a situation where we had to remove the extra tags and triggers, but this fixed the problem only for a short time. Hence, my team and I were determined to find a long-term solution for this which could be helpful for other clients and Google Tag Manager users like you as well. We started off by trying to add multiple Google Tag Manager containers at once, and guess what? It worked like magic!

This blog post is an ultimate guide that’ll help you add multiple containers inside your Android Application.

Implementation

I assume that you already have one Google Tag Manager container installed as per How to implement Google Tag Manager for Android.

To add the second container, follow the below three steps:

1. Download the binary file from the new Google Tag Manager container as below:

     Inside GTM, Go to the Versions tab-> Action -> Download.

Image 1: Downloading the binary file from the new GTM container

2. Add the downloaded file to the raw folder.

Image 2: Adding downloaded file to raw folder

3. Create an object of PendingResult with a new Google Tag Manager id and call setResultCallBack in your Application Class.

Image 3: Creating an object of PendingResult

Now, you can get the following DataLayer Singleton anywhere in the application :

Make sure that you use the same Data Layer object across your Application.

Now you can push any dataLayer event for both containers. The only thing you need to take care of is to check whether both containers do not contain the same tags. If that’s the case, then, 2 similar tags will be fired even though you push the event only once.

Conclusion

In 3 simple steps, you will be ready to use the second container for tracking the events. When compared to the web, app implementation is simpler since you do not need to add the new container snippet on all the screens.

We hope this blog post proved to be a useful guide to you. We would love to hear from you if you have any feedback for us or even if there are any workarounds that you might have derived. Tell us all about it in the comment section below.

Click here to know more about our Google Analytics Audit Solutions. Feel free to reach out to us in case you need any assistance with Google Tag Manager.

Learn How to Play with Google Analytics Data and Get the Most Valuable Insights

Google Analytics Data Blog Image

Google Analytics Data Blog Image

Introduction

Once we implement the tracking code on a website, the Google Analytics data starts flowing in a particular Google Analytics property. Therefore, it is important to know how various data points can be accessed by understanding the various offerings of the Google Analytics Reporting Interface. Also, in the time-bound schedules of digital marketers and analysts, it becomes essential to identify which information will be accessible from which reporting section. Once the appropriate report is there in front of users it is essential to know various Reporting Features so as to make the data more meaningful and customized according to user’s requirement. In this blog, we are covering the basic features of Google Analytics Reports along with a few use cases.

About Reports

One can avail over 80 reports using the Google Analytics data that are chiefly divided into the below-mentioned parts.

What my users are doing right now?

Who are my users?

From where are my users coming to the Website/App?

What are they doing on my Website/App

How many of them are driving conversion and how?


Basic Features of Google Analytics Report

To get an idea about the basic features of Google Analytics Report, we are considering Source/Medium along with Browser and OS report as a base. You can write the name in a search box available on the left top corner of the Google Analytics Interface. You will get the below-mentioned output upon clicking that icon.


Google Analytics Dashboard UI


    1. Date Range

You can select the date range for which you want to access the Google Analytics data. Over here, the compare function is available - allowing you to compare a particular date range with the other one. It gets really simple and quick to avail daily, weekly, monthly, and yearly data from this feature. It is also possible to fetch the event data for any custom date range.


The custom date range for September 2017


The custom date range for September 2017 compared to August 2017


    2. Segment

You can add various segments to analyze the Google Analytics data for a particular set of audiences. Here are a few examples of segment definitions:

  • The user Type exactly matches “Returning User”
  • Country/Territory does not matches “United States”
  • E-commerce Conversion Rate > “0.2%”

You can create different types of segments based on your need to analyze the Google Analytics data. While creating a segment, multiple dimensions and metrics are considered. The segment remains as it is even if you open another Google Analytics Report after applying a particular segment.

    3. Metrics Line:

It is the line showing the Metrics trend for a particular period. By default, this is set to daily frequency for the date range selected. You can get this line chart with a frequency set to week and month as well. The line chart for any particular metrics is also available from the metrics drop-down option.

    4. Dimension Tab

This tab is useful in changing the value of the primary dimension. E.g. If you want to pull data based on the Operating System instead of Browser then this tab becomes useful.

    5. Secondary Dimension: This feature is essentially used for adding another dimension along with the primary dimension. E.g. if you want to add gender along with the browser then a secondary dimension becomes useful. You can also add a tracked custom dimension using this feature. In case you want to use more than one custom dimension, then there is an option to create a custom report where you can select up to five dimensions/custom dimensions. For this, you simply need to perform the drag-and-drop actions to add or remove dimensions/metrics.


    6. Plot Rows Checkbox

In case you want to see a metrics line (as mentioned in point 3) for a particular dimension value (e.g. only for Chrome and Mozilla browsers from the list of all browsers)you need to tick on the checkbox(es) and then what you get is the line chart only for those dimension values.

    7. Search

Marketers can search for a particular dimension value using the search feature to fetch the Google Analytics data that is limited to the selected dimension value.

    8. Visualization Tab:

This tab allows you to generate the report output in the form of a percentage chart, comparison chart, pivot table, etc. It comes in handy when you or your team require dynamic outputs of Google Analytics data in a particular format.

    9. Other features:

  • Sort:

You can simply click on the top of this metric column to sort your Google Analytics data in a particular metric, either in ascending or descending order

  • Save:

This feature lets you save a particular report by clicking on the Save option available at the right top of the Google Analytics Interface. You can access the same from Customization > Saved Reports.

  • Export:

One can generate Excel, spreadsheet, .csv, and .pdf versions of the reports created using Google Analytics Data by clicking on the Export option available at the top-right corner of Google Analytics Interface.

  • Edit:

You can edit the dimensions and metrics by clicking on the Edit option available at the top-right corner of the Google Analytics Interface. Click here to know more about the usage of this button.

  • Share:

With this feature, share the report configuration by clicking on the Share option available at the top-right corner of the Google Analytics Interface.

Frequently Encountered Questions

Here we are addressing a particular set of questions that you would generally encounter while trying to obtain Google Analytics data based on pre-determined data points.


  1. Is there any report available from which I can get data for the number of drop-offs from a particular conversion funnel?
  • Yes, there is a report called Funnel Visualization which helps in getting such data. One needs to define a destination goal with funnel steps to obtain Google Analytics data in this particular report.
  1. Can filters be applied to real-time data? Also is it possible to automate this process daily?
  • Yes, one can always create a real-time dashboard from Customization > Dashboards with filters. The same can be automated using the email option with daily frequency.
  1. How to access a custom dimension sent with an event?
  • A custom dimension sent with an event can either be taken as a secondary dimension in a particular report or one can opt to create a custom report for the same.
  1. Can someone use offline data in a Google Analytics Report?
  • Yes, one can always use the data import feature available in Google Analytics and once the offline data flows in Google Analytics Custom Dimensions, it is best put to use by a secondary dimension or a custom report where your offline data will merge with the Google Analytics data.
  1. Can someone get data for different segments at the same place?
  • Yes, you can either apply up to four segments for the same report or dashboards with many reports with different filter condition that are possible to create.

Conclusion

Let us conclude with a few general points that one should remember about the data that is available in Google Analytics Reports:

  • Google Analytics data can migrate to the data studio, adwords,  tableau, and Bime. Since it has a free API with additional custom development, it is possible to integrate the same with any other visualization tool.
  • All the user interaction data (hit level) can be sent to Google Analytics and can be accessed through Reports available under the Behavior Section.
  • Apart from Real Time Reports, for other reports, it takes 4 hours to process the data for Google Analytics 360 and 24-48 hours for Google Analytics Standard.

This blog is aimed to deliver to you, the importance of each report as you navigate through various reports. This will enable digital marketers to derive desired data points with the knowledge of various reporting features.

Step-by-step Walkthrough: How to Implement Google Tag Manager v5 for your Android Application

gtm_v5


gtm_v5Google Tag Manager v5 is now all set with Firebase SDK for Apps, adding unique supplementary features to the Google Analytics arena.

Firebase was earlier a stand-alone company until Google purchased it in 2014. Google then tweaked Firebase as a whole new baggage for mobile app development, along with adding few obliging feature of Analytics to it. Firebase now includes tools for app development, like cloud messaging, database storage, hosting, etc. These tools can help us grow our app’s audience using push notifications and app indexing. Yes, Firebase Analytics sits right on top, pulling all the strings of the entire product.

In the previous blog, we had a walkthrough on how to implement tags with Google Tag Manager v4 in your Android application. Moving ahead, in this blog post, I will take you through the process of implementing Google Tag Manager v5.

Steps to set up GTM v5 in an Android Project
Setup Firebase
    1. Login to Firebase Console
    2. Create a Project and add your Application details as per the instructions.
    3. Download the google-services.json file and add it into your Android Application project as shown below.
      gtm

Image 1: Adding google-services.json file to your Android Application project

Add Google Tag Manager in Your Android Application
  1. Add Firebase SDK to your project in your Android Project. At the project level, add build.gradle file and include the google-services Plugin.

    gtm v5Image 2: Adding Firebase SDK  to your Android Application project

  2. At your app level, add the build.gradle file and include dependencies of both Firebase and Google Tag Manager

    androidImage 3: Adding Firebase SDK  to your Android Application project

  3. Create a Firebase Analytics Object and use it to track event by adding appropriate event name and its parameters.

    implement gtm v5Image 4: Creating Firebase Analytics Object in  your Android Application project

With these 3 steps, your Google Tag Manager v5 is now configured with your Android app. But we are missing out on something very important. The question you should be asking is:

Will setting up Firebase and GTM SDK be enough to track the event?  

Well, if we are using Google Tag Manager, it’s mandatory to configure a tag by setting the right triggering event to it. Hence, moving forward with GTM v5, with the features that it provides over the GTM v4 version, we can now control the event configuration with three different action types for a single event that is to be tracked.

Google Tag Manager Tag Configuration for Custom Events
  1. To start off with Google Tag Manager, first create a Container of Firebase type in Google Tag Manager Console :

    gtm console
    Image 5: Creating container

  2. We now begin with the configuration of an event in GTM. As opposed to the v4 tag configuration, v5 event tags are remarkably advanced in providing more actions. We have three actionable options in tag configuration :

    • Add  Event
    • Modify Event
    • Block Event
      Let us understand the strengths of these 3 actions by using it in our event configurations.

      1. Add Event
        Configure a Login event in Google Tag Manager v5 as shown below, for when the user logs into the app. For this use, let’s say the name of the event that fires if “new_login”

        android app
        Image 6: Tag Configuration - Add Event

        gmt v5
        Image 7: Trigger Configuration for the above tag

      2. Edit Event
        Post the successful tag configuration, we have an event for users logging in the app. But down the road, when the app is published on Playstore, we will be required to edit the name of the event that is being tracked from “new_login” to “Login”. Here’s how we can modify our existing Login event tag as shown below, without any efforts from app implementation.

        implement gtm v5
        Image 8: Tag Configuration - Modify Event

      3. Block Event
        Now, If user is signing up in the app for the first time, and it leads user to login automatically for the instance, then in this case we don’t require the Login event to be triggered in Firebase. The block event feature comes in handy for such an instance. Here is how you can use the feature of blocking the event on specific screen(i.e. Sign up screen) as shown below.

        android gtm
        Tag Configuration - Block Event

        google tag manager
        Trigger Configuration for the above tag

  3. Once the tags are configured, we will then need to publish the container, download it and add it to the Android Project. In assets -> container folder.

    google tag manager androidImage 9: Adding Container to Android Project

Please Note :

  • It is necessary to publish the container each time when new tags are configured in GTM
  • Adding the container file to the project is to be done only once when the container is published for the first time.
Concluding

We are now ready to run the application and verify the results as follows:

In the terminal, write following three commands:

gtm v5

View the logs for configured events by applying the filter of “D/FA” in Android Monitor,  or visit your Firebase Console for the same.

So, that’s it. This is how you can integrate Google Tag Manager version 5 in your Android app. Happy Tagging!

If you are stuck anywhere or need guidance while implementing the GTM v5 for your Android app, please feel free to leave us a comment in the section below and our Android experts will be glad to help you out.

All You Need to Know About Targeting Customized Audience in DoubleClick For Publishers using Google Analytics 360 Audience Segment

Targeting Customized Audience in DoubleClick For Publishers using Google Analytics 360

Targeting Customized Audience in DoubleClick For Publishers using Google Analytics 360

Wouldn’t it be awesome if you could increase your Ad Revenue and Click-Through-Rates by using Google Analytics audience behavior? In this blog, I am going to show you just that. Let’s start with the basics of how to target a customized audience from Google Analytics 360 and export it to DoubleClick for Publishers. As a follow-up to this blog, I shall also come up with some eye-opening use cases and benefits that I’ve been able to deliver myself, using this re-marketing strategy.

DoubleClick For Publishers (DFP)

is a Google product that provides a way for online publishers to serve ads on their websites or Mobile-sites or Apps. DFP is available in 2 different versions based on the features and value propositions. (Source: Google)

DoubleClick For Publishers Premium: DFP Premium which has inventory in millions and wants to sell their inventory directly to the advertiser via Programmatic or direct need to use this feature.

DoubleClick For Publishers Small Business: DFP Small Business is a free ad management solution that helps growing publishers sell, schedule, deliver, and measure all of their digital ad inventory.

Key Takeaways:

When two tools as powerful as Google Analytics 360 and DoubleClick For Publishers combine forces, the benefits are bound to be valuable. Here are some key benefits worth listing:

  • Targeting the audience who are coming from a particular channel or source/medium
  • Using GA custom metadata information to segment the audience for Remarketing. This maximizes accuracy and minimizes the costs
  • Figuring out which keywords are helping to generate revenue for your business in terms of SEO
  • Understanding those users’ customer persona that generates more revenue. Also, know, from which inventory

What is Google Analytics Segment?

The segment of data is a subset of your Google Analytics data. Example: If I consider the entire set of users, one segment of users from a particular city and another segment of users who purchase a particular line of products. Segments will help in creating audience segments as per the user requirement with all the appropriate conditions.

(Source: Definition by Google Support)

Segments can be of 3 types:

  1. Subsets of users: Defined as, those users who have viewed the Entertainment section but didn’t view any section related to the News
  2. Subsets of sessions: Example All sessions during which a sports section read
  3. Subsets of hits: For example, all hits in which pageviews were greater than 5

You can create an audience with users who perform some actions or a set of actions on your website which clearly showcases the intent of the users. Here are the examples for the same:

  • Viewed more than 5 pages & “News enthusiasts”
  • Spent more than 5 minutes & viewing the “Sports” category articles
  • Are high-value users who are having pages/sessions of more than 5 or 7 or 10
  • Serving different ads based on those users who subscribed and non-subscribers

Carrying Out Custom Tagging in Google Analytics

Custom Tagging is done based on Custom Dimensions available in Google Analytics. If you have multiple categories on your website, place a custom dimension for that page and assign the category it belongs to. This way you can segment visits that include that category.

  • Example:  ga(‘send’, ‘pageview’, {‘dimension2’:  sports’});

If you have multiple authors/article tags on your website, place a custom dimension for that page and assign the author/article tags it belongs to. This way you can segment visits that include the author/article tags.

  • Example-1: ga(‘send’, ‘pageview’, {‘dimension2’:  manish sharma});
  • Example-2: ga(‘send’, ‘pageview’, {‘dimension3’:  demonetisation});

How to Create Audience Segments and Export to DoubleClick For Publisher

Step-1: Create a segment in GA 360.

How to create a segment

How to create a segment

Step-2: Build an Audience

Building audience

Building audience

Step-3: Select the respective view which will be the source from where we need to select the data and click next to enable remarketing

enable remarketing

Selecting the view from the source to enable remarketing

Step-4: Export to DoubleClick For Publisher

Exporting audience to DFP

Exporting audience to DFP

  • Select the Audience destination which is DFP of your respective network code.
  • Click on Enable button

Benefits of DoubleClick For Publishers and Google Analytics 360 Integration:

We can view the publisher reports data along with GA 360 standard dimensions and metrics:

  • Affinity-Based Content Classification:

    Content Group of data in GA 360 along with the standard DFP metrics. Based on these content grouping we can create a segment of the audience that is interested in a particular segment generating more revenue for the company.

  • Monetizing Publisher Referrals:

    Knowing traffic sources that provide top-performing impressions along with the DFP metrics. Accordingly, we can plan our marketing budget to make sure to invest our money in the right traffic source to generate ROI.

  • Monetizing Publisher Pages:

    Once you know the revenue per page or cost per page, your marketing team can modify their budget plan based on the type of pages from which the revenue is generated and where exactly the cost is too higher. It provides the comparison between investing the amount on a particular page and expecting a return on the same.

  • Know Your Best Content-Type:

    Know whether or not you are investing your money in the correct content where Ad Revenue or if the CTRs generated are low. You can determine the same by knowing which content is driving more revenue or any other DFP metrics.

Concluding Thoughts:

To conclude, GA 360 will provide you with as many numbers of segments as you would require to customize and ensure your users are better engaged. To give you a better sense of audience segments that have great impacts on your business, I invite you to check out

7 Absolutely Must-Have Google Analytics Advanced Segments for Marketers for Unlocking Actionable Insights.

So, what are you waiting for now? Let’s create an audience segment and export it to DFP and start targeting. Are there any difficulties that you are facing while either creating an audience in GA or exporting it to DFP? Tell us about it in the comment section and we’ll be happy to help!

Bot Icon
Bot Icon

Tatvic Bot

Explore About Tatvic and Services