Hello There!

Lorem ipsum dolor sit amet, consectetur adipiscing elit,

Google Analytics vs Google Analytics 360: Features, Limitations & Pricing

Google Analytics vs Google Analytics 360 Features, Limitations & Pricing - Tatvic

TL;DR:

Google Analytics (Free) is a powerful tool for startups, SMBs, and mid-sized businesses, offering essential event tracking, standard reporting, and free integrations. However, it comes with limitations such as data sampling, slower data freshness, no BigQuery integration and lack of enterprise-grade support.

On the other hand, Google Analytics 360 is designed for large enterprises handling massive data volumes. It provides unsampled data, advanced attribution models, faster reporting, seamless BigQuery integration, and dedicated support, with pricing starting around $150,000 per year based on hit volume.

In short, the free version works well for growing businesses with moderate needs, while GA 360 is ideal for enterprises that require precision, scalability, and ROI-driven insights.

Introduction: Google Analytics vs Google Analytics 360: Which One Do You Really Need?

In today’s data-driven world, digital analytics is no longer optional-it’s the foundation of smarter marketing and business decisions. For over a decade, Google Analytics (GA) has been the go-to tool for tracking website traffic, user journeys, and campaign performance. But as organizations grow, so do their data requirements, compliance needs, and expectations for deeper insights.

This is where the question arises: Is the free version of Google Analytics enough, or should you invest in Google Analytics 360?

Both versions are part of the Google Marketing Platform ecosystem, but they cater to different audiences. The free Google Analytics (GA4 standard) is ideal for startups, SMBs, and mid-sized businesses that need cost-effective yet powerful analytics. On the other hand, Google Analytics 360 is the enterprise-grade premium solution, designed for large organizations managing massive data volumes, requiring advanced integrations, and seeking guaranteed support and service-level agreements (SLAs).

This blog offers a comprehensive comparison of Google Analytics vs Google Analytics 360-exploring their features, limitations, pricing, and use cases-so you can confidently decide which solution aligns with your growth stage and digital strategy.

What is Google Analytics (Free GA4)?

Google Analytics (GA4) is Google’s free, event-based analytics platform that enables businesses to track and analyze how users interact with their websites and apps. Unlike the older Universal Analytics, GA4 is built around events and parameters, making it more flexible and future-ready for cross-platform measurement.

It not only tells you what happened (pageviews, clicks, conversions) but also why it happened, with predictive insights powered by Google’s machine learning models. This makes it much more than just a reporting tool, it’s a customer-centric analytics engine.

Key Features of Free Google Analytics (GA4 Standard):

  • Event-based tracking: Unlike Universal Analytics, GA4 focuses on events, giving you granular insights into user actions.

  • Cross-device & cross-platform tracking: Track users seamlessly across websites, iOS, and Android apps.

  • Basic audience segmentation: Build audiences based on demographics, devices, and engagement.

  • Standard reporting suite: Includes real-time reporting, funnel exploration, and retention analysis.

  • Native integrations: Connect easily with Google Ads, BigQuery (export-only in free GA), and Google Search Console.

  • AI-driven insights: Leverages machine learning to provide anomaly detection and predictive metrics (e.g., churn probability, revenue prediction).

Best Suited For:

  • Startups and SMBs looking for free yet powerful analytics.

  • Businesses with moderate traffic volumes.

  • Marketing teams focused on campaign measurement and performance tracking without enterprise-level complexity.

What is Google Analytics 360?

Google Analytics 360 (GA 360) is the enterprise-grade version of Google Analytics, designed for organizations that need to measure, analyze, and activate data at scale. As part of the Google Marketing Platform (GMP), GA 360 goes beyond standard analytics by offering higher data collection limits, advanced attribution capabilities, seamless integrations, and guaranteed enterprise support.

Unlike the free GA4 standard, which is sufficient for startups and SMBs, GA 360 is built for large enterprises managing millions of monthly users, running multi-channel campaigns, and requiring precise, unsampled data for strategic decision-making.

In 2025, with marketing becoming more AI-driven and privacy-first, GA 360 has become the go-to solution for enterprises that need compliance, scalability, and predictive insights integrated across platforms like BigQuery, DV360, SA360, Campaign Manager 360, Salesforce and cloud ecosystems.

Key Features of Google Analytics 360

  • Enterprise-Scale Data Handling
    Collect, process, and analyze billions of events without the sampling limitations found in the free version. This ensures reporting accuracy even for high-traffic websites and apps.

  • Advanced Reporting & Unsampled Data
    Get unsampled reports and advanced funnel exploration to make reliable data-driven decisions, even with complex user journeys.

  • Cross-Property & Roll-Up Reporting
    Combine multiple domains and apps into a single analytics view, enabling enterprise-wide visibility and performance tracking across regions and business units.

  • Advanced Attribution Modeling
    Leverage Data-Driven Attribution (DDA) across channels, helping enterprises measure the true impact of marketing campaigns, online and offline.

  • BigQuery Integration (Unlimited Export)
    Seamlessly connect with Google BigQuery for scalable data warehousing and advanced analysis, enabling machine learning models and custom analytics pipelines.

  • Custom Funnels & Audiences
    Build complex funnels and highly granular audiences, which can be activated across GMP products and ad platforms for precision targeting.

  • Service-Level Agreements (SLAs) & Dedicated Support
    GA 360 comes with 99%+ data collection uptime SLAs, onboarding assistance, and priority access to Google support engineers.

  • Tight Integration with GMP Ecosystem
    Unlock the full potential of DV360, SA360, Campaign Manager 360, and Display Ads, ensuring seamless campaign activation and attribution.

Best Suited For:

  • Enterprises with massive traffic volumes (millions of monthly users across multiple platforms).

  • Global brands and retailers needing omnichannel attribution and advanced marketing orchestration.

  • Data-driven organizations that require precision, scalability, and compliance-first analytics.

  • Companies investing in AI, predictive analytics, and enterprise-grade integrations to stay ahead of competition.

Google Analytics vs Google Analytics 360: A Detailed Comparison

Feature

Google Analytics (Free / GA4)

Google Analytics 360 (Enterprise)

Cost Free Paid (Enterprise-level pricing, typically starting ~$150K/year)
Data Limits Up to 500 events per property, standard hit and sampling limits Billions of events with unsampled reporting, higher limits on properties, events, and custom dimensions
Data Sampling Reports may be sampled for high traffic or complex queries Unsampled data for accurate enterprise decision-making
Attribution Models Limited (cross-channel last-click, position-based) Advanced attribution, including Data-Driven Attribution (DDA) across campaigns and channels
Integrations Google Ads, Search Console, Firebase Deep integrations with BigQuery, DV360, SA360, Campaign Manager 360, Salesforce, Google Cloud
Reporting Standard reports, Explorations, limited funnel analysis Advanced funnel reports, roll-up reporting, cross-property analysis, custom funnels
Audience Building Basic segments and audiences Advanced audience segmentation with unlimited exports to GMP & Ads platforms
Data Export Limited BigQuery export (daily, 1M events) Unlimited BigQuery export, advanced ML/AI analytics, cloud pipelines
User Support Community help & standard docs Dedicated Google support, SLAs, onboarding, and account management
Best For Startups, SMBs, mid-market companies Enterprises, global brands, high-traffic websites, and data-driven organizations

Limitations of Free Google Analytics (GA4)

While the free version of Google Analytics (GA4) is a fantastic tool for startups, SMBs, and mid-market businesses, it does come with limitations that can restrict enterprises or high-traffic websites. As organizations scale, these constraints often become bottlenecks for accurate reporting, advanced marketing measurement, and enterprise-level decision-making.

Here Are The Most Critical Limitations Of Free GA4:

1. Sampling Issues at Scale

Once your property exceeds 500K sessions or complex queries, GA4 begins to apply data sampling. This means not all of your user data is analyzed, which can distort insights-a major drawback for brands needing precision in attribution or conversion analysis.

2. Delayed Data Freshness

Unlike GA 360, which offers near real-time unsampled data, the free GA can have a 24-48 hour reporting lag for large datasets. For businesses running daily campaigns, flash sales, or time-sensitive ads, this delay can lead to missed opportunities and slower decision-making.

3. Limited Custom Dimensions & Metrics

Free GA restricts you to 50 event-scoped custom dimensions and 50 metrics. For enterprises managing complex data pipelines, multiple campaigns, or advanced user segmentation, this ceiling quickly becomes restrictive.

4. No Roll-Up Reporting Across Properties

Free GA does not support roll-up reporting, which allows brands to consolidate performance across multiple domains, subdomains, or apps. Global businesses managing multi-market websites or multi-brand portfolios find this particularly challenging.

5. Basic Attribution Modeling

GA4 free version only provides limited attribution models (last-click, position-based, etc.). Advanced data-driven attribution (DDA), which evaluates the true impact of each channel on conversions, is available only in Google Analytics 360.

6. No Guaranteed Enterprise Support

With free GA, you’re largely dependent on documentation, community forums, and peer support. Enterprises needing priority troubleshooting, SLAs, or implementation guidance will struggle without the dedicated account management available in GA 360.

Key Takeaway:
Free Google Analytics (GA4) is more than sufficient for small to mid-sized businesses, but it was never designed for enterprise-level data needs. If your brand is scaling into millions of monthly visitors, running omnichannel marketing campaigns, or requiring enterprise-grade data accuracy and integrations, these limitations often make the case for upgrading to Google Analytics 360.

Why Upgrade to Google Analytics 360?

For enterprises handling high traffic volumes, complex user journeys, and multi-channel marketing campaigns, the free version of Google Analytics often falls short. Google Analytics 360 (GA 360) addresses these limitations, providing accuracy, advanced insights, and enterprise-grade support.

Here’s Why Organizations Make The Upgrade:

1. Accuracy & Scale

GA 360 delivers unsampled reporting, meaning all your data is analyzed-even for millions of monthly sessions. With higher hit limits, faster data refresh rates, and roll-up reporting across multiple properties, enterprises can trust that every user interaction is accurately measured, enabling precise decision-making for marketing and product strategies.

2. Advanced Insights & Analytics

GA 360 offers features far beyond the free version:

  • Custom funnels & advanced segmentation for granular user behavior analysis.

  • Data-driven attribution to understand each channel’s true contribution to conversions.

  • Cross-property and cross-domain roll-up reports to get a unified view of global operations.

These capabilities empower teams to optimize campaigns, predict trends, and make data-driven decisions with confidence.

3. Enterprise Support & Seamless Integrations

Upgrading to GA 360 comes with dedicated support from Google, including SLAs and 24/7 troubleshooting. Integration with the Google Marketing Platform (GMP)-including BigQuery, Display & Video 360, Search Ads 360, and Campaign Manager 360-enables enterprises to unify marketing, analytics, and BI operations.

ROI Justification: For organizations managing millions in ad spend or generating significant revenue online, the cost of GA 360 is often justified by the value of accurate insights, advanced attribution, and seamless integrations.

Pricing: Google Analytics vs Google Analytics 360

Feature

Google Analytics (Free)

Google Analytics 360

Cost

$0 forever Starts at $150,000/year*

Data Limits

Up to 500K sessions per month Millions of hits per month

Sampling

Applied for large datasets Unsampled reporting

Attribution Models

Basic Data-Driven & Advanced

Support

Community & Documentation Dedicated Google Support

Integrations

Google Ads, Search Console Full GMP ecosystem, BigQuery, Salesforce, and more

Enterprises often negotiate pricing with certified GMP resellers like Tatvic, making it flexible depending on usage.

Which Analytics Solution Should You Choose?

Choosing between Google Analytics (Free) and Google Analytics 360 depends on your business size, data needs, and marketing ambitions. Here’s a clear breakdown:

Free Google Analytics is ideal if:

  • You’re a startup, small, or mid-sized business with moderate traffic.

  • Your team needs essential insights without heavy investment.

  • Advanced reporting, cross-property roll-ups, or unsampled data are not critical for decision-making.

  • You’re looking to track basic conversions, user behavior, and campaign performance efficiently.

Google Analytics 360 is ideal if:

  • You’re an enterprise or large-scale organization with millions of monthly sessions.

  • You require unsampled, high-accuracy data to drive critical business decisions.

  • You leverage BigQuery, AI-powered analytics, and multi-channel marketing for strategic insights.

  • Dedicated Google support and SLA-backed services are essential for your operations.

  • You need advanced attribution, custom funnels, and deep integrations across the Google Marketing Platform ecosystem.

Conclusion

Both Google Analytics and Google Analytics 360 are powerful analytics platforms, but they cater to different scales of business and data requirements.

  • Google Analytics (Free) is perfect for SMBs and marketers who need cost-effective, actionable insights for everyday digital marketing and website performance tracking.

  • Google Analytics 360 is an enterprise-grade solution designed for organizations that demand high-volume data accuracy, advanced integrations, and robust analytics capabilities to drive high-stakes, data-driven decisions.

For businesses unsure which solution aligns with their needs, working with a certified Google Marketing Platform partner like Tatvic can provide clarity. Our experts help organizations assess data maturity, implement the right GA setup, and unlock the full potential of both GA and GA 360, ensuring analytics translates into measurable growth, ROI, and optimized digital strategy.
What is Google Maps API? Benefits, Use Cases, and Implementation

TL;DR

Google Maps API is more than just an interactive map for websites, it’s a powerful location intelligence tool that enables businesses to embed maps, calculate routes, display points of interest, and integrate geolocation features into web and mobile apps. By leveraging Google Maps API, businesses can optimize the customer experience through store locators, delivery tracking, and seamless navigation. It also enhances marketing campaigns with location-based targeting, improves logistics and operations via real-time routing and fleet management, and enables AI-driven insights by integrating maps data with analytics platforms such as GA4 and DV360. With its flexibility, scalability, and real-time data capabilities, Google Maps API has become an essential tool for both enterprises and SMBs, powering applications that range from eCommerce platforms to smart city initiatives.

Introduction: Why Google Maps API Matters

In today’s digital-first world, location is more than just a point on a map; it’s a critical driver of customer experience, operational efficiency, and business intelligence. Consumers expect instant, accurate, and seamless access to physical locations, whether they are finding the nearest store, booking a ride, or tracking a delivery. Businesses that fail to deliver precise location experiences risk losing customers and revenue.

The Google Maps API is a comprehensive suite of developer tools that allows businesses to embed interactive maps, retrieve geospatial data, calculate optimized routes, and display points of interest across web and mobile applications. It transforms location data into actionable intelligence, helping enterprises deliver faster, smarter, and more personalized experiences.

By integrating Google Maps API, businesses can:

  • Turn raw location data into actionable insights that drive operational and marketing decisions.

  • Enhance user experience with intuitive navigation, predictive search, and dynamic location displays.

  • Power marketing campaigns, analytics, and AI-driven personalization, from geo-targeted ads to route optimization.

Whether you run a retail chain, logistics company, travel platform, or healthcare network, Google Maps API bridges the gap between the physical world and digital experiences, enabling seamless location-based interactions that drive engagement and conversions.

What is Google Maps API?

At its core, the Google Maps API is a set of programmable interfaces that allows your website, mobile app, or enterprise system to interact directly with Google Maps’ comprehensive geospatial database. It’s more than just a map, it’s a location intelligence engine.

Google Maps API enables businesses to:

  • Embed interactive maps anywhere online or within applications, providing users with familiar and responsive map interfaces.

  • Retrieve geospatial information, including coordinates, addresses, postal codes, time zones, and administrative boundaries.

  • Calculate optimized routes, distances, and travel times, factoring in traffic conditions, road restrictions, and preferred transit modes.

  • Display points of interest, from stores and restaurants to landmarks and service centers, dynamically based on user location or query.

  • Integrate with other APIs and platforms, enabling location-based analytics, personalized recommendations, and AI-driven services.

The Google Maps API is part of the Google Maps Platform, which encompasses specialized APIs like Maps, Routes, and Places, all managed through a unified platform with centralized billing, monitoring, and usage controls.

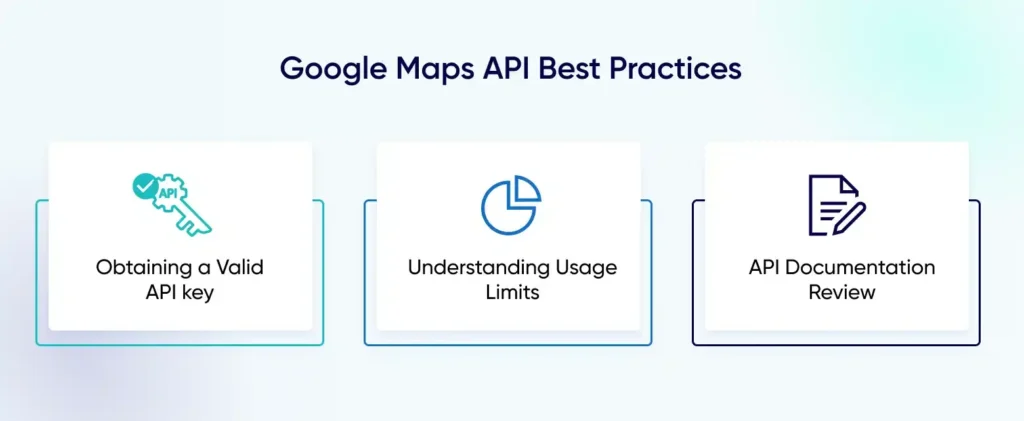
google maps api best practices

Key Components of Google Maps API

Understanding the core components of Google Maps API helps businesses choose the right tools to integrate location intelligence into their applications. Each API serves a distinct purpose, enabling businesses to deliver highly interactive, data-driven, and personalized experiences.

1. Maps API

The Maps API allows businesses to embed fully interactive maps directly into websites and mobile apps. It supports advanced customization, including map styles, overlays, markers, and pop-ups, ensuring the map aligns seamlessly with your brand identity. Whether it’s a store locator for retail chains or an event map for conferences, this API provides a flexible foundation for geospatial visualization.

2. Routes API

The Routes API provides precise, real-time navigation for driving, walking, or public transit. It factors in current traffic conditions, road closures, and preferred travel modes, helping users reach their destinations efficiently. Businesses can leverage this for delivery optimization, field service management, ride-hailing apps, or last-mile logistics, enhancing both operational efficiency and customer satisfaction.

3. Places API

With the Places API, businesses can integrate location-based search and discovery into their applications. Key features include autocomplete search for location input fields, access to detailed information about businesses (reviews, photos, opening hours), and identification of points of interest. Retailers, travel platforms, and hospitality apps can deliver intuitive search experiences that guide users to the right locations effortlessly.

4. Geocoding & Geolocation APIs

The Geocoding API converts human-readable addresses into geographic coordinates, while the Reverse Geocoding API converts coordinates back into readable addresses. Combined with the Geolocation API, which tracks device locations in real time, these tools enable location-based personalization, delivery tracking, asset monitoring, and emergency response applications.

5. Distance Matrix API

The Distance Matrix API calculates travel times and distances between multiple origins and destinations. Businesses can use it to optimize delivery routes, estimate arrival times for services, or analyze network efficiency for logistics and transportation. This API is crucial for improving operational planning and reducing costs in complex route networks.

6. Street View API

The Street View API provides immersive 360° panoramic imagery, allowing users to virtually explore streets, buildings, and landmarks. This is particularly valuable for real estate platforms, tourism apps, and retail locations, offering an interactive experience that drives engagement and helps users make informed decisions.

7. Time Zone & Elevation APIs

The Time Zone API provides accurate global time zone conversions, while the Elevation API delivers precise elevation data for any location. These APIs support logistics planning, outdoor adventure apps, travel itineraries, and any application requiring geospatial intelligence beyond basic maps.

With the right mix of Google Maps APIs, businesses can transform simple maps into intelligent location-based solutions that drive both user satisfaction and operational excellence.

Why Businesses Use Google Maps API

Google Maps API has evolved from a simple mapping tool into a mission-critical business asset, helping enterprises and SMBs leverage location intelligence to improve operations, user experience, and marketing effectiveness. Its applications span across industries:

  • Retail & eCommerce:

    Enable customers to find nearby stores, check product availability in real time, and access click-and-collect or curbside pickup options. Interactive maps enhance shopping journeys and reduce friction in the buying process.

  • Logistics & Transportation:

    Optimize fleet management, calculate the fastest routes, predict delivery times, and minimize fuel costs. Real-time traffic updates help logistics companies improve operational efficiency and customer satisfaction.

  • Travel & Hospitality:

    Offer immersive trip planning experiences, highlight nearby attractions, and provide hotel or restaurant proximity insights. Maps and Street View integration help travelers make informed decisions instantly.

  • Healthcare:

    Allow patients to locate clinics, hospitals, or pharmacies efficiently. Geolocation services ensure timely access to medical facilities and improve patient engagement.

  • Marketing & Advertising:

    Drive location-based campaigns, geofencing strategies, and footfall analysis. Businesses can deliver hyper-targeted promotions and track campaign effectiveness using location data.

  • Real Estate:

    Showcase property locations with interactive maps and Street View integration, providing potential buyers and renters with an immersive virtual tour experience before visiting.

By incorporating Google Maps API, businesses transform raw location data into actionable intelligence, enabling smarter operational decisions, enhanced customer satisfaction, and measurable ROI.

You May Also Like to Read 👉 Which Mapping Platform Is Best in 2025?

Benefits of Google Maps API

Leveraging Google Maps API provides businesses with a suite of tangible advantages that go beyond simple navigation:

  • Accuracy & Reliability:

    Real-time updates ensure that maps, routes, and points of interest are always current, reducing errors and enhancing trust.

  • Scalability:

    Handle millions of API calls seamlessly without performance degradation, making it suitable for global enterprises and high-traffic applications.

  • Enhanced User Experience:

    A familiar Google Maps interface builds trust, encourages engagement, and simplifies navigation for end-users.

  • Customization:

    Businesses can tailor map styles, markers, overlays, and info windows to match brand identity, creating a cohesive and professional experience.

  • Data-Driven Insights:

    Integration with platforms like GA4 and DV360 allows businesses to analyze geospatial data for marketing, operational planning, and AI-driven personalization.

  • Cross-Platform Integration:

    Google Maps API works consistently across web applications, Android, iOS, and enterprise software, ensuring seamless multi-device experiences.

  • Operational Efficiency:

    By optimizing routes, managing assets, and predicting demand, companies can save time and resources while delivering better customer outcomes.

In essence, Google Maps API empowers businesses to connect the digital and physical worlds, creating smarter, faster, and more engaging experiences for customers while driving measurable business growth.

Google Maps API Pricing

Google Maps Platform operates on a flexible pay-as-you-go model, making it accessible for startups, SMBs, and large enterprises alike.

  • Free Tier:

    Every account receives a $200 monthly credit, ideal for small-scale apps, testing environments, or initial proof-of-concept projects. This allows businesses to explore Maps, Routes, and Places APIs without upfront costs.

  • Paid Plans:

    Charges are usage-based and vary according to API consumption, including Maps, Routes, Places, Distance Matrix, and other specialized APIs. This ensures scalability-your costs grow only as your usage grows.

  • Budget Control:

    Google Cloud provides configurable usage limits, alerts, and billing dashboards to prevent unexpected overages. Businesses can monitor API consumption in real-time and optimize workflows to stay within budget.

Pro Tip: Use Google’s Pricing Calculator to estimate monthly API costs accurately. Planning ahead allows you to forecast budgets, evaluate ROI, and prioritize high-impact applications.

How to Implement Google Maps API

Integrating Google Maps API into web or mobile applications is straightforward if approached systematically:

  1. Create a Google Cloud Project:

    Start by setting up a project in the Google Cloud Console and enable billing.

  2. Enable Required APIs:

    Depending on your needs, enable APIs such as Maps, Routes, Places, Geocoding, Distance Matrix, and Street View.

  3. Generate an API Key:

    Configure your API key with proper usage restrictions (HTTP referrers, IP addresses, or app restrictions) to enhance security.

  4. Add SDKs or Libraries:

    Incorporate the Google Maps SDK for Web, Android, or iOS platforms based on your application environment.

  5. Test and Monitor:

    Verify your implementation using the Google Cloud Console, Debugger tools, and real-world tests.

  6. Advanced Integration:

    For businesses seeking deeper insights, APIs can be integrated with analytics platforms like GA4 or DV360, combining geospatial data with behavioral analytics for AI-driven personalization, marketing optimization, and operational efficiency.

How to Pull Data with Google Maps API

One of the most powerful features of the Google Maps API is the ability to extract and use location-based data within your applications. By leveraging the Maps Platform, developers can retrieve detailed information about specific locations, including full addresses, latitude and longitude coordinates, nearby points of interest (POIs), business details, and even real-time traffic data. This capability forms the backbone of location intelligence applications, enabling everything from mapping services and geolocation apps to logistics management and location-driven marketing campaigns.

For instance, a retail app can dynamically display store locations near a user, a travel app can provide nearby attractions, and a delivery platform can optimize routes in real time all by pulling and processing data from the Google Maps API.

However, accessing this data requires a valid Google Maps API key, which ensures secure and authorized usage. Developers must also be mindful of usage limits and billing policies, as exceeding free-tier allocations can result in additional charges. The Google Maps API documentation provides comprehensive guidelines for quotas, pricing, and best practices for managing requests efficiently.

To pull data effectively, developers can use APIs such as Places API (for POIs and business details), Geocoding API (for converting addresses into coordinates and vice versa), and Distance Matrix API (for calculating travel distances and times). Combining these APIs allows businesses to create highly customized, data-driven experiences that leverage real-time location intelligence.

Practical Use Cases Across Industries

Google Maps API is versatile, powering location intelligence and enhancing user experience across multiple sectors:

  • Retail:

    Implement store locators, show inventory by nearest location, and offer click-and-collect or curbside pickup points, improving customer convenience and conversion rates.

  • Logistics:

    Optimize fleet operations with real-time tracking, dynamic route planning, and delivery ETA updates, reducing costs and increasing operational efficiency.

  • Healthcare:

    Help users locate the nearest hospitals, clinics, or pharmacies and provide emergency routing, enhancing patient safety and accessibility.

  • Travel & Tourism:

    Deliver interactive trip planners, local guides, and immersive Street View experiences for travelers seeking detailed, real-world context.

  • Marketing:

    Enable hyper-local campaigns, geofencing promotions, footfall tracking, and location-based targeting for better ROI on digital marketing investments.

  • Real Estate:

    Visualize property locations, conduct proximity analysis, and create virtual tours with Street View integration, helping buyers make informed decisions.

By leveraging Google Maps API across these industries, businesses can transform location data into actionable intelligence, streamline operations, enhance customer experience, and unlock new revenue streams.

Common Pitfalls to Avoid When Using Google Maps API

Even with a powerful tool like Google Maps API, improper implementation can lead to security risks, inefficiencies, and missed opportunities. Avoid these common mistakes:

  • Not Securing API Keys: Leaving API keys unrestricted exposes your account to misuse, resulting in unexpected charges or malicious activity. Always set HTTP referrer, IP, or app restrictions.

  • Ignoring Usage Quotas: Google Maps APIs have usage limits, and exceeding them without monitoring can lead to overage fees. Set alerts and monitor usage in the Google Cloud Console.

  • Over-Reliance on Default Map UI: Using un-customized maps may lead to a generic or confusing user experience. Customize map styles, controls, and markers to match your brand and improve engagement.

  • Lack of Integration with Analytics: Without connecting Maps API to platforms like GA4 or DV360, you miss valuable insights on user behavior, engagement, and campaign performance.

By proactively addressing these pitfalls, businesses can protect their investment, improve UX, and maximize ROI from location-based applications.

Advanced & Future Considerations

Google Maps API is evolving beyond simple maps into a full-fledged location intelligence platform. Forward-thinking businesses can leverage these innovations to stay ahead:

  • AI-Powered Maps: Predictive routing, dynamic traffic analysis, and crowd density forecasting help enterprises optimize logistics, improve delivery times, and enhance customer experience.

  • Augmented Reality (AR) Integration: Overlay directions, promotions, or product information in retail, navigation, and tourism apps, offering immersive user experiences.

  • Electric Vehicle (EV) Navigation: Real-time charging station locations, availability updates, and route optimization for EV fleets are becoming essential for sustainable logistics and urban mobility.

  • Privacy-First Maps: Compliance with regulations such as GDPR, CCPA, and DPDP ensures that location data is collected and processed securely, building user trust.

  • Conversational Interfaces: Integration with AI assistants like ChatGPT, Gemini, and Claude enables voice-based directions, predictive suggestions, and context-aware search, making maps more interactive and accessible.

In today’s digital landscape, Google Maps API is no longer just a mapping tool-it’s a strategic platform for business intelligence, operational efficiency, and customer engagement. Enterprises that adopt these advanced capabilities can transform raw geospatial data into actionable insights that drive revenue, optimize operations, and elevate the overall user experience.

Google Maps API vs Competitors

While several mapping solutions exist, Google Maps API consistently stands out due to its accuracy, scalability, and extensive ecosystem. Here’s how it compares:

  • Mapbox: Known for high customization and developer flexibility, but its points-of-interest (POI) database is smaller, which may limit real-world applications.

  • OpenStreetMap (OSM): Free and open-source, making it ideal for cost-conscious projects, but real-time traffic and route optimization are less reliable compared to Google.

  • MapMyIndia: Excellent for India-specific mapping and geospatial data, offering precise regional insights. However, it lacks the global coverage and integration ecosystem that Google Maps API provides.

Despite these alternatives, Google Maps API remains the most comprehensive, reliable, and widely adopted platform for enterprises seeking robust location intelligence, real-time routing, and AI-enabled geospatial analytics.

Conclusion: Why Google Maps API is a Strategic Growth Engine

Google Maps API is no longer just a tool for embedding maps-it has become a core driver of business growth and operational efficiency. Businesses that harness its capabilities can:

  • Enhance User Experience: Deliver intuitive navigation, predictive search, and location-based recommendations.

  • Optimize Logistics & Operations: Streamline fleet management, route optimization, and real-time delivery tracking.

  • Drive Data-Driven Marketing: Use geospatial insights to power hyper-local campaigns, audience segmentation, and footfall analysis.

  • Enable AI & Personalization: Combine Maps API data with analytics platforms like GA4 and DV360 to fuel AI-powered personalization engines, predictive services, and smart automation.

With advanced analytics and GA4 implementation in place, Tatvic’s experts specialize in setting up, validating, and scaling Google Maps API for enterprises. From reducing friction in customer journeys to transforming raw geospatial data into actionable insights, we ensure your Maps API implementation drives measurable growth and strategic advantage.

Whether you’re in retail, logistics, healthcare, travel, or real estate, Google Maps API empowers your business to connect the physical world with digital experiences, making every interaction smarter, faster, and more meaningful.


Are You Making The Best Out Of Your Net Promoter Score (NPS) Surveys With Google Analytics?

Are you making the best of your NPS Surveys with Google Analytics - Tatvic

TL;DR: Net Promoter Score (NPS) is one of the simplest ways to measure customer loyalty but its real value emerges when combined with Google Analytics 4 (GA4). By capturing NPS responses as GA4 events, segmenting promoters, passives, and detractors, and overlaying sentiment on behavioral data, businesses can uncover the why behind customer actions. In 2025, AI-powered analysis, predictive scoring, and privacy-first tracking make NPS far more actionable. The result? Better retention, higher lifetime value, improved conversion funnels, and faster growth.

Introduction

Net Promoter Score (NPS) remains one of the most reliable and widely adopted measures of customer loyalty. With just a single, straightforward question, it separates enthusiastic promoters from dissatisfied detractors and provides a benchmark for long-term growth. However, in 2025, businesses know that an NPS score alone is not enough. Without context, it’s just a number.

When paired with Google Analytics 4 (GA4), especially its advanced event-driven model NPS transforms from a static metric into a powerful diagnostic tool. Instead of asking “What’s our score?”, companies can now uncover “Why did this customer rate us a 6?”, “Which journeys create promoters?”, and “What behaviors correlate with detractors?”.

By linking customer sentiment with behavioral analytics, you gain the ability to:

  • Diagnose friction points in real time.

  • Attribute promoter scores to specific product flows.

  • Identify detractor segments before they churn.

  • Feed insights into AI-driven personalization and retention strategies.

This article explores how to maximize the value of Net Promoter Score (NPS) surveys with Google Analytics in 2025, covering modern best practices, privacy-first data collection, AI-powered insights, and step-by-step implementation strategies. Done right, this integration doesn’t just track satisfaction-it translates customer voice into business growth, retention, and competitive advantage.

What Is Net Promoter Score (NPS) ?

Net Promoter Score (NPS) is one of the simplest yet most predictive customer experience metrics. It asks a single, powerful question:

“On a scale of 0-10, how likely are you to recommend our company, product, or service to a friend or colleague?”

Based on responses, customers are segmented into three distinct groups:

  • Promoters (9-10): Loyal enthusiasts who actively recommend your brand, fueling referrals and long-term growth.

  • Passives (7-8): Satisfied but unenthusiastic customers-neutral today but easily swayed by competitors.

  • Detractors (0-6): Dissatisfied customers who may churn, leave negative reviews, or discourage others.

Why Net Promoter Score (NPS) Still Matters in 2025

In an era where AI-driven search, predictive analytics, and hyper-personalized experiences dominate customer engagement, some may question whether a single-question survey still carries weight. The answer is a resounding yes NPS continues to be a cornerstone of customer intelligence, but its role has evolved.

Here’s why NPS remains indispensable in 2025:

  • Predictive of Business Growth

    Studies consistently link higher NPS scores to stronger referrals, higher retention rates, and lower customer acquisition costs. In fact, many investors and boards now monitor NPS as a leading indicator of long-term profitability.

  • Universally Simple & Comparable

    Unlike complex satisfaction indexes, NPS is easy to administer and benchmark across industries, markets, and even geographies. A score of “8” means the same whether you’re a SaaS platform or a retail brand.

  • Actionable When Paired With Behavior

    The real power of Net Promoter Score (NPS) in 2025 lies in combining survey data with behavioral analytics.
    For example, by connecting NPS responses with Google Analytics 4 (GA4) events, businesses can diagnose:

        • Which journeys produce promoters.
        • What friction points lead to detractors.
        • How promoter behavior differs in terms of session depth, engagement, or lifetime value.
  • Aligned With Privacy-First Measurement

    With stricter global privacy laws (GDPR, CCPA updates, and India’s DPDP Act), businesses need lightweight, compliant feedback mechanisms. NPS surveys fit perfectly: they collect minimal personal data while offering maximum insight.

  • AI-Enhanced Insights

    Modern analytics tools now use AI to enrich Net Promoter Score (NPS) data predicting churn risk, clustering detractors by sentiment themes, and even generating automated recovery recommendations in real time.

Why Integrate Net Promoter Score (NPS) into Google Analytics

At its core, Net Promoter Score (NPS) tells you what customers feel, while Google Analytics (GA4) reveals how they behave. When treated separately, these insights remain incomplete. By integrating NPS into GA4, you bridge sentiment with behavior-turning subjective feedback into actionable intelligence.

The Business Case for Integration

In 2025, customer journeys are increasingly complex, spanning multiple touchpoints, channels, and devices.

A single NPS score without behavioral context can’t answer questions like:

  • What drives promoters to advocate?

  • Why are detractors dropping out at a specific funnel step?

  • Which product features correlate with loyalty or churn?

By connecting NPS and GA4, businesses create a 360° view of customer experience making loyalty measurable, diagnosable, and improvable.

Key Benefits of Integrating Net Promoter Score (NPS) with GA4

  1. Behavioral Segmentation at Scale

    Instead of treating NPS responses as isolated feedback, link them to GA4 events.

    This allows you to:

    • Compare session depth, engagement rate, and purchase frequency for promoters vs detractors.

    • Measure the lifetime revenue impact of promoter-driven referrals.

    • Identify behavioral patterns unique to passives who could be converted into promoters.

  2. Contextual Diagnosis of Pain Points

    Net Promoter Score (NPS) highlights dissatisfaction, but GA4 pinpoints where it happens.

    For example:

    • If detractors consistently abandon the checkout flow at Step 2, the issue isn’t loyalty-it’s UX friction.

    • If promoters spend more time exploring product tutorials, you know those resources are value drivers.

    This moves feedback from guesswork to evidence-based problem solving.

  3. Personalization & Recovery Flows

    Integrated systems enable real-time, sentiment-based personalization:

    • Trigger recovery campaigns for detractors (e.g., chat support or discount offers).

    • Encourage promoters to leave reviews, participate in referral programs, or share case studies.

    • Create tailored product onboarding flows based on sentiment segments.

  4. Product & Roadmap Insights

    When GA4 shows that a specific feature has disproportionately high engagement among promoters, product teams gain evidence-backed validation for roadmap priorities. Conversely, if detractors frequently interact with a problematic feature, it becomes a clear candidate for redesign.

  5. Privacy-First & AI-Driven Integration

    With GA4’s event-based data model and consent mode v2, integrating NPS is not only richer but also more compliant with global privacy regulations.

    Layer in AI-driven analysis, and you can:

    • Cluster detractors by root cause themes.

    • Predict promoter likelihood based on early interactions.

    • Automatically recommend corrective actions at scale.

Best Practices for Running Net Promoter Score (NPS) Surveys (2025 Edition)

In 2025, the best Net Promoter Score (NPS) surveys are short, contextual, and omnichannel, delivered at the right moment in the customer journey rather than through generic email blasts. Keep the question simple (“How likely are you to recommend us?”), but pair it with one open-ended follow-up to capture why. Use GA4-linked events to trigger surveys in-app, post-purchase, or after key milestones, ensuring relevance.

Finally, adopt privacy-first practices and AI-powered text analysis to uncover sentiment themes at scale while staying compliant with GDPR and evolving global regulations.

1 Personalize & Brand Surveys

  • Keep the survey voice consistent with your brand: short, empathetic, and clear.
  • Use the respondent’s context (in-app vs post-purchase vs email) to customize wording.
  • Reinforce anonymity where appropriate-customers provide more honest feedback when they trust privacy.

2 Timing & Triggers

  • Trigger surveys at meaningful moments: after onboarding completion, post-purchase delivery, or following support resolution.
  • Balance frequency to avoid survey fatigue-prioritize quality of responses over quantity.
  • Use sampling strategies for high-traffic experiences to avoid bias and overload.

3 Effective Format

  • The canonical approach: one NPS scale question + one optional open-ended follow-up (the “why” question).
  • Offer contextual multiple-choice follow-ups when needed (e.g., “What influenced your score?”).
  • Keep the UI frictionless on mobile-large tappable areas and minimal typing.

4 AI-Driven Analysis for Open Responses

  • Use Natural Language Processing (NLP) to cluster themes and surface sentiment trends across thousands of verbatim responses.
  • Combine topic modeling with text embeddings to identify recurring issues and opportunities.
  • Use AI to prioritize which detractor feedback requires immediate intervention (e.g., safety, product-breaking issues).

5 Closing the Feedback Loop

  • Respond quickly to detractors-offer help, escalation, or remediation.
  • Reward promoters with referral prompts, exclusive previews, or ask them to leave public reviews.
  • Publicly act on aggregated feedback to demonstrate you listen-this builds trust and can lift NPS over time.

How to Implement Net Promoter Score (NPS) Tracking in Google Analytics (GA4)

Implementing Net Promoter Score (NPS) tracking in GA4 in 2025 isn’t just about collecting responses-it’s about transforming feedback into behavioral intelligence you can act on. With GA4’s event-driven model, you can seamlessly connect customer sentiment with digital behavior, helping you understand not just what users feel but why.

Here’s a step-by-step approach to Implement NPS Tracking in Google Analytics (GA4)

1. Choose the Capture Method

Select an Net Promoter Score (NPS) survey tool or in-house widget that integrates directly with Google Analytics through webhooks, APIs, or GTM (Google Tag Manager). For web experiences, embed short contextual surveys; for apps, use GA4’s app SDK to fire NPS events at the right customer journey points (post-purchase, onboarding, or feature usage).

2. Record the NPS Event in GA4

Set up a dedicated event-for example, nps_responsewith parameters such as:

  • nps_score (0-10)

  • nps_segment (promoter | passive | detractor)

  • nps_reason (text input)

  • Contextual attributes like page_location, product_id, or user_type

Ensure events are tied to first-party identifiers (hashed IDs or consented user IDs) to remain compliant with global privacy regulations like GDPR, CPRA, and India’s DPDP Act.

3. Create Custom Dimensions or User Properties

Map nps_segment as a user-scoped property. This allows GA4 to track how Promoters, Passives, and Detractors behave over time-revealing post-survey patterns in engagement, conversion, and retention.

4. Enrich with GA4 Audience Segments

Build dedicated audience segments inside GA4:

  • Promoters (9-10)

  • Passives (7-8)

  • Detractors (0-6)

These segments can be used for cohort analysis, funnel performance tracking, or remarketing campaigns in Google Ads provided users have given explicit consent.

5. Build Net Promoter Score (NPS) Dashboards

Use Looker Studio or GA4’s Explore reports to create dashboards showing:

  • NPS distribution over time

  • Conversion and churn rates by segment

  • Funnel completion rates for promoters vs. detractors

  • Revenue per segment and lifetime value insights

This transforms NPS into a diagnostic lens, not just a vanity metric.

6. Link to Downstream Systems

Push NPS data to your CRM, product analytics, and support systems for maximum impact. For example:

  • CRM → Assign promoters to referral campaigns or loyalty programs.

  • Product analytics → Correlate high scores with feature usage to inform roadmap priorities.

  • Support platforms → Auto-generate tickets for detractors who leave negative feedback.

7. Privacy & Compliance in 2025

With stricter privacy laws globally, ensure you:

  • Collect NPS data with consent.

  • Use first-party tracking only (no third-party cookies).

  • Anonymize open-text responses before sharing across teams.

  • Limit retention windows for sensitive feedback.

Real-World Use Cases & Business Impact of Net Promoter Score (NPS) with Google Analytics

Integrating Net Promoter Score (NPS) with Google Analytics 4 (GA4) transforms customer feedback from a simple score into actionable business intelligence.

By linking customer sentiment with digital behavior, brands can uncover patterns that directly influence conversion rates, retention, and revenue growth.

Here are some industry-specific examples:

1. Ecommerce: Product and Checkout Insights

In ecommerce, Net Promoter Score (NPS) can reveal friction points hidden in plain sight.

By analyzing NPS scores alongside browsing and checkout behavior, retailers can answer critical questions:

  • Which product categories generate the highest promoters?

  • Are detractors clustering around certain product lines or experiences?

For example, if detractors disproportionately visit “size & fit” pages, this highlights an opportunity to improve size charts, product images, or return policy visibility. Similarly, by comparing checkout completion rates across NPS cohorts, businesses can pinpoint whether detractors abandon at specific funnel stages-signaling UX or payment flow fixes that will have measurable revenue impact.

2. SaaS: Feature Adoption & Churn Prediction

For SaaS businesses in 2025, Net Promoter Score (NPS) is more than a sentiment metric, it’s a predictive churn signal.

By mapping NPS cohorts to feature usage, you’ll notice trends such as:

  • Promoters frequently engage with retention-driving features (e.g., dashboards, automation tools, integrations).

  • Detractors show lower activation or shallow engagement with critical features.

This insight fuels targeted interventions: improved onboarding flows, AI-driven in-app guidance, or contextual nudges. Even more powerful, a dip in NPS followed by reduced feature usage often precedes churn. Monitoring this correlation gives customer success teams a real-time early warning system to intervene before revenue is lost.

3. Services & Support: Operational Improvements

In service-heavy industries, Net Promoter Score (NPS) linked to GA4 can surface hidden inefficiencies. Detractors often generate higher ticket volumes, slower resolution times, or repeated queries. By connecting NPS with support events, businesses can identify systemic issues such as:

  • Knowledge base gaps (articles not answering real user questions).

  • SLA misses leading to frustration.

  • Escalation delays from poor ticket routing.

Fixing these operational bottlenecks not only lifts NPS but also reduces support costs per customer.

4. Revenue & Lifecycle Impact

The ultimate power of Net Promoter Score (NPS) lies in its connection to the customer lifecycle and profitability.

GA4 enables brands to segment revenue, retention, and acquisition metrics by NPS group:

  • Promoters typically display higher lifetime value (LTV), stronger retention, and lower acquisition costs thanks to referrals.

  • Passives represent a massive untapped opportunity nudging them to promoter status can unlock disproportionate ROI.

  • Detractors drag growth not only through churn but also by spreading negative word of mouth.

In 2025, forward-looking brands are using predictive analytics and AI-driven modeling to simulate the financial impact of converting passives into promoters proving that Net Promoter Score (NPS) isn’t just about satisfaction; it’s a lever for profitable growth.

Tools & Tech Stack for Maximizing NPS + Google Analytics Insights (2025)

Running an effective Net Promoter Score (NPS) program in 2025 requires more than just sending surveys-it demands the right tech stack to capture responses, connect them with behavioral data in GA4, and turn them into actionable insights.

Below is a breakdown of the essential layers:

1. Survey & Capture Options

The first step is capturing NPS feedback at the right moments, without creating fatigue. Modern options include:

  • Cloud-native NPS platforms (e.g., Delighted, Qualtrics, Medallia) with webhooks or direct GA4 connectors for seamless event forwarding.

  • In-app SDKs for product-led companies, enabling contextual NPS prompts triggered at key events (e.g., feature activation, checkout completion, subscription renewal).

  • Conversational interfaces that let users respond via chatbots or voice assistants increasing response rates on mobile and voice-first environments.

2. Analytics & Dashboards

Once captured, Net Promoter Score (NPS) needs to be correlated with behavioral and revenue data:

  • GA4: Track nps_response events and segment by promoters, passives, and detractors. Use funnel reports and path analysis to see where sentiment diverges.

  • Looker Studio: Blend NPS scores with revenue, churn, and support data to create executive-friendly dashboards.

  • BigQuery: Ideal for enterprise-scale use cases enabling longitudinal cohort tracking, advanced joins, and large-scale text + behavioral analytics.

3. Text & Sentiment Analysis

Open-text responses are where the “why” behind NPS truly emerges. In 2025, leading teams use a hybrid approach:

  • Cloud NLP APIs (Google Cloud, AWS Comprehend, Azure Cognitive Services) or open-source LLM embeddings (like BERT or SentenceTransformers) to cluster themes and detect underlying sentiment.

  • Automated labeling combined with manual human review for critical segments (like detractors) to ensure nuance and accuracy.

  • Advanced topic modeling to identify recurring friction points-whether it’s “shipping delays,” “feature complexity,” or “pricing.”

4. Orchestration & Automation

Capturing feedback isn’t enough closing the loop is where ROI lives:

  • Workflow automation tools (Zapier, Workato, Segment Personas, or CDPs) route detractor responses to support teams instantly, while promoters can be nudged toward referral or testimonial programs.

  • Marketing automation platforms personalize follow-ups-offering discounts, upsells, or loyalty points based on NPS segment.

  • Crucially, all automations must respect privacy preferences and consent signals to stay compliant in 2025’s regulatory landscape.

5. Pitfalls to Avoid

Even with the best stack, poor execution can kill impact.

Watch out for:

  • Over-surveying: Bombarding users with Net Promoter Score (NPS) prompts reduces quality and increases churn. Instead, sample strategically across touchpoints.

  • Treating NPS as a vanity metric: A high score means nothing unless tied to conversion, retention, or LTV metrics.

  • Data silos: If NPS lives in isolation (separate from GA4, CRM, or product analytics), you lose the ability to connect feedback to behavior.

  • Ignoring mobile & voice-first channels: With the rise of voice assistants and mobile-first browsing, ensure surveys are optimized for touch and conversational responses.

  • Staying reactive only: Many brands focus only on fixing detractor pain points. But in 2025, leaders also activate promoters turning them into referral engines and content advocates.

👉 In short, the 2025 Net Promoter Score (NPS)  tech stack is not just about measurement it’s about integration, automation, and AI-driven insights. When combined with GA4 and advanced orchestration, NPS stops being a static number and becomes a real-time growth engine.

Actionable Checklist (Quick Wins for NPS + Google Analytics)

If you’re serious about making your Net Promoter Score (NPS) program actionable, here’s a set of quick wins you can implement right away.

Each step ensures that survey data not only gets captured but also fuels measurable improvements in customer experience, retention, and revenue.

1. Map Net Promoter Score (NPS) events to GA4

    • Send a dedicated event like nps_response with parameters: nps_score (0-10), nps_segment (promoter|passive|detractor), and nps_reason (open-text feedback).
    • Include contextual attributes such as page_location, product_id, and user_type for richer insights.

2. Create user-scoped NPS properties

    • Store nps_segment as a user property in GA4.
    • Enables longitudinal tracking of customer journeys post-survey (e.g., Do detractors recover? Do promoters keep converting?).

3. Build Net Promoter Score (NPS)-based audiences

    • Segment users into Promoters, Passives, and Detractors.
    • Use these cohorts for funnel comparisons, remarketing (with consent), and lifecycle messaging.

4. Visualize funnel conversion by NPS segment

    • In Looker Studio, blend GA4 and survey data to highlight drop-offs, conversion rates, and revenue differences across cohorts.
    • Use this to prioritize UX fixes where detractors struggle most.

5. Run monthly NLP analysis on open-ended feedback

    • Apply natural language processing (NLP) to cluster recurring themes like “pricing,” “delivery,” or “support delays.”
    • Share top insights directly with product, marketing, and support teams for rapid action.

6. Trigger automated follow-up flows

    • Detractors: Route instantly to customer support for proactive outreach or escalation.
    • Promoters: Trigger referral prompts, loyalty rewards, or testimonial requests to amplify advocacy.

7. Monitor LTV and churn by Net Promoter Score (NPS) segment quarterly

    • Compare lifetime value (LTV), churn risk, and repeat purchase behavior across NPS groups.
    • Use trends to demonstrate ROI of NPS-driven improvements to leadership.

8. Ensure consent-aware and privacy-compliant tracking

  • Use only first-party identifiers and respect user opt-outs.
  • Anonymize open-text feedback when sharing outside the core team to maintain compliance with 2025 privacy regulations.

👉 By following this Net Promoter Score (NPS) checklist, you move beyond vanity scores and create a closed feedback loop where customer sentiment directly informs growth strategies.

Conclusion & Next Steps

In 2025, Net Promoter Score (NPS) is no longer just a standalone survey metric, it’s a strategic growth lever when integrated with analytics. By connecting what customers say (NPS feedback) with what they actually do (GA4 behavior data), businesses unlock a powerful diagnostic engine that goes beyond surface-level scores. This shift transforms NPS from a vanity measure into a predictive tool for retention, product adoption, and revenue growth.

When properly set up in Google Analytics 4, NPS responses reveal:

  • Which features create promoters and drive advocacy.

  • Which friction points turn passives into detractors.

  • How sentiment correlates with lifetime value (LTV), churn signals, and funnel performance.

The real advantage comes from closing the loop: building cohorts, running AI-assisted text analysis, and creating personalized recovery or advocacy flows. Done right, this reduces churn, accelerates product-market fit, and boosts both short-term conversions and long-term loyalty.

At Tatvic, our CRO practice helps leading brands move beyond measurement to action. We specialize in instrumenting NPS within GA4, building dashboards that tie sentiment to revenue, and designing conversion-driven follow-up journeys that turn feedback into measurable outcomes. Whether you need help with implementation, funnel optimization, or advocacy design, our team ensures NPS works as a growth engine not just a survey.

Ready to unlock the true value of your Net Promoter Score (NPS) program?

  • Audit your setup: Are NPS events tracked in GA4 with user cohorts?

  • Check your dashboards: Can you see promoters and detractors across funnels and revenue metrics?

  • Operationalize feedback: Are you turning insights into retention campaigns, advocacy flows, and product priorities?

If not, start with the actionable checklist above or connect with Tatvic for a specialized NPS + GA audit that aligns surveys, analytics, and CRO strategy. The difference between tracking NPS and acting on NPS is where true growth lies.

Collaborative Filtering 101: How Netflix, Amazon, and Spotify Personalize Your Experience

Collaborative Filtering 101: How Netflix, Amazon, and Spotify Personalize Your Experience - Tatvic

Introduction: The Hidden Engine Behind Your Recommendations

Ever wondered why Netflix knows your Friday night mood, why Amazon predicts your next purchase, or why Spotify drops a playlist that feels handcrafted for you? The secret isn’t mind-reading-it’s Collaborative Filtering (CF), the invisible engine powering personalization in 2025.

From streaming platforms to ecommerce giants, collaborative filtering has become the foundation of customer retention and engagement, shaping decisions that influence billions in revenue every year. And as personalization evolves with Artificial Intelligence (AI), Deep Learning, and Large Language Models (LLMs), understanding collaborative filtering is no longer optional-it’s essential for every marketer, product strategist, and technologist.

TL;DR:

Collaborative Filtering (CF) is the core technology behind how Netflix, Amazon, and Spotify personalize your experience. It analyzes user behavior and preferences to recommend what you’re most likely to watch, buy, or listen to. The two main approaches-user-based CF (finding similar users) and item-based CF (suggesting similar items) power recommendations like Netflix’s “Because you watched…”, Amazon’s “Customers also bought…”, and Spotify’s “Discover Weekly.” While challenges like cold start issues, scalability, and data privacy remain, 2025 is seeing a shift toward hybrid models, AI-driven embeddings, and federated learning. For businesses, CF is no longer optional-it’s a strategic necessity to boost engagement, retention, and revenue.

What is Collaborative Filtering?

Collaborative Filtering (CF) is one of the most widely used machine learning techniques for personalization. At its simplest, it predicts what you’ll like by analyzing patterns in user behavior-essentially, “people like you also enjoyed this.”

Think of it this way:

  • User-Based CF → “Find people like you and recommend what they loved.”

  • Item-Based CF → “Find items similar to what you liked and suggest them.”

Why does it work so well? Because humans trust the “people like me effect.” If thousands of users with similar tastes binge-watched a show, bought a gadget, or streamed a playlist, chances are you’ll enjoy it too.

And here’s the twist in 2025: Collaborative Filtering is no longer just a recommendation engine-it’s a trust engine.
It powers not just entertainment, but ecommerce, finance, healthcare, retail, and even AI assistants-driving hyper-personalized decisions that shape billions of dollars in annual revenue.

Types of Collaborative Filtering in 2025

Collaborative Filtering has evolved beyond basic similarity checks. Today’s systems blend multiple approaches, deep learning, and real-time context.

They now account for cross-device behavior, temporal patterns (like when you listen or shop), and contextual signals such as location or mood. Modern platforms also combine CF with content-based methods and reinforcement learning to deliver hyper-personalized, dynamic recommendations that adapt instantly to user intent.

Deep Down on Types of Collaborative Filtering

1. User-Based Collaborative Filtering

  • How it works: Finds users with similar preferences and recommends what they enjoyed.

  • Example: If you and another user both loved futuristic sci-fi shows on Netflix, you’ll be shown their top-rated content-even before they trend globally.

2. Item-Based Collaborative Filtering

  • How it works: Focuses on relationships between items, not users.

  • Example: If you bought the iPhone 16 Pro Max, CF instantly suggests MagSafe 3.0 accessories, spatial audio earbuds, and trending apps purchased by similar buyers.

3. Matrix Factorization & Advanced Embeddings

  • How it works: Uses mathematical models like Singular Value Decomposition (SVD), neural embeddings, and transformer-based models to find hidden patterns across billions of interactions.

  • Example: Amazon or Flipkart scaling recommendations for 500M+ users in milliseconds using AI-accelerated embeddings.

4. Implicit vs. Explicit Feedback

  • Explicit Signals: Direct ratings, reviews, likes, or thumbs-down.

  • Implicit Signals: Clicks, watch time, search queries, dwell time, purchases, skips.

Modern CF systems blend explicit + implicit feedback in real-time, making personalization smarter, context-aware, and adaptive.

Why Collaborative Filtering Matters in 2025

In 2025, Collaborative Filtering (CF) is no longer just a recommendation engine, it’s the backbone of personalization across ecommerce, streaming, social media, and even healthcare and finance. Beyond predicting what you might buy or watch, CF now powers hyper-personalized product discovery, financial advice, and patient care journeys.

With AI and real-time data integration, it has shifted from being reactive to proactive anticipating needs before customers even express them.

Here’s Why Collaborative Filtering Matters More Than Ever:

1. Omnichannel Personalization

Collaborative Filtering now works seamlessly across devices and platforms. Whether you start a movie on your smart TV, browse products on your phone, or check reviews on your smartwatch, your watchlist, shopping cart, and playlists follow you everywhere. This unified experience keeps users engaged without friction.

2. AI + LLM-Powered Recommendations

Unlike earlier rule-based systems, modern CF integrates with Large Language Models (LLMs) such as ChatGPT, Gemini, Claude, and Perplexity. This means recommendations are not just statistical-they’re conversational, contextual, and adaptive. You can literally ask, “What should I watch based on my last three shows?” and get a human-like, rationale-backed suggestion, making CF feel like talking to a trusted friend.

3. Reducing Choice Overload & Building Trust

With millions of products, movies, or songs available, choice fatigue is real. Collaborative Filtering helps users cut through the noise by surfacing what truly matters to them. This personalization fosters trust and loyalty, as users begin to rely on platforms for curated, relevant decisions rather than endless scrolling.

4. Direct Revenue & Engagement Impact

The business impact is massive.

According to studies:

  • Personalized recommendations powered by CF contribute to 35-40% of ecommerce revenue globally.

  • Streaming platforms report 2.3x higher average session time when CF-driven personalization is applied.

  • Subscription-based businesses using CF see up to 27% higher retention rates, proving its role in reducing churn.

5. Expanding Beyond Entertainment & Retail

In 2025, CF is no longer limited to Netflix or Amazon. Healthcare apps use it to recommend wellness plans, finance apps to suggest investment strategies, and edtech platforms to personalize learning paths. This cross-industry adoption shows that CF has evolved into a universal personalization framework.

How Netflix Uses Collaborative Filtering

When people think about personalized streaming, Netflix is the gold standard and Collaborative Filtering (CF) is at the heart of its recommendation engine. In 2025, Netflix doesn’t just rely on viewing history-it blends CF with deep neural networks, A/B testing, and contextual AI to refine every recommendation. From personalized trailers to adaptive thumbnails, the platform ensures that no two user experiences are alike. This constant evolution has made Netflix’s CF model a benchmark for how data-driven personalization can directly drive engagement, retention, and billion-dollar revenue impact.

1. User Clustering at Scale:

Netflix doesn’t just compare simple watch histories anymore. In 2025, it uses advanced matrix factorization and neural CF models to cluster users based on nuanced behavioral signals-such as rewatch habits, search abandonment, and even interaction with trailers.

2. Contextual & Omnichannel Personalization:

Recommendations now adapt in real time depending on the time of day, device type, location, and even mood signals (inferred from user activity). For example, the content you’re recommended on a smart TV during prime time may differ from what you see on mobile during a commute.

3. AI-Driven Micro-Personalization:

Beyond shows and movies, Netflix applies deep learning-powered CF to personalize every layer of engagement-thumbnails, trailers, preview lengths, and even subtitle fonts in some regions-based on what maximizes your likelihood to click and stay engaged.

4. Impact at Scale:

As of 2025, over 82% of all viewing hours on Netflix come from recommendations powered by collaborative filtering and reinforcement learning. Analysts estimate this saves Netflix more than $1.3 billion annually by reducing churn and increasing engagement, making it one of the clearest ROI cases for CF in the world.

5. Beyond Entertainment:

Netflix is also experimenting with cross-domain collaborative filtering, where insights from content consumption inform gaming recommendations, merchandise suggestions, and even live event promotions making CF a growth engine, not just a retention tool.

Takeaway: Netflix demonstrates how collaborative filtering in 2025 has evolved from basic user-item matching to an AI-augmented ecosystem that shapes not only what we watch, but how we experience digital entertainment.

How Amazon Uses Collaborative Filtering

When it comes to ecommerce personalization, Amazon is the undisputed pioneer. Its recommendation system powered heavily by Collaborative Filtering (CF) isn’t just a feature, it’s the backbone of its revenue strategy. Over the years, Amazon has refined CF into a profit engine that influences everything from product discovery to checkout.

By analyzing billions of interactions in real time, it delivers hyper-relevant suggestions that feel almost predictive. In fact, Amazon’s ability to recommend the “next best product” has set the benchmark for ecommerce personalization globally.

1. Item-to-Item Collaborative Filtering

Instead of comparing users directly, Amazon perfected item-based CF, which looks at relationships between products. For example, “Customers who bought this also bought…” or “Frequently bought together” aren’t just clever UI elements, they’re the result of billions of data points being processed in real time.

2. Hybrid Recommendation Models

By 2025, Amazon no longer relies solely on classic CF. It uses hybrid models that blend:

  • Collaborative Filtering (user-product interactions)

  • Content-based filtering (product metadata like category, brand, specs)

  • Context-aware personalization (location, browsing history, voice queries via Alexa, purchase frequency)

This ensures that recommendations are hyper-relevant, whether you’re shopping on mobile, desktop, or speaking to Alexa.

3. Cross-Sell and Upsell at Scale

Amazon leverages CF to power bundling strategies (main product + accessories), upsells (higher-tier versions), and personalized promotions (e.g., Prime Day tailored offers). This means every customer’s journey is dynamically shaped to maximize cart value and long-term loyalty.

4. Real-Time Context Integration

In 2025, CF on Amazon is enhanced by real-time behavioral signals-like what you just searched, how long you hovered on a product page, or what device you’re using. These signals are layered on top of CF to fine-tune recommendations on the fly.

Business Impact

  • 35% of Amazon’s revenue still comes directly from its recommendation system in 2025.
  • CF-driven personalization helps Amazon generate billions in incremental sales, reduce cart abandonment, and increase Prime membership stickiness.
  • More importantly, Amazon’s CF algorithms are continuously trained on trillions of interactions daily, making them self-optimizing engines of profit.

For ecommerce brands, this is the ultimate lesson: Collaborative Filtering isn’t just about better suggestions-it’s about profit optimization at scale, turning every click into a potential sale.

How Spotify Uses Collaborative Filtering

When it comes to personalized music discovery, Spotify has redefined what listening means in the digital age. At the heart of this transformation lies Collaborative Filtering (CF) working alongside advanced machine learning, NLP, and audio intelligence.

1. Discover Weekly at Scale:

Spotify’s legendary Discover Weekly playlist remains one of the most iconic uses of CF. Each week, more than 40 million uniquely generated playlists are delivered, tailored to each listener’s taste. It’s not just algorithmic math-it feels personal, almost like a friend curating songs for you.

2. Implicit Behavioral Signals:

Unlike traditional platforms that rely heavily on explicit likes or ratings, Spotify’s CF engine thrives on implicit data-skips, replays, listening duration, playlist saves, and even the time of day you listen. This silent feedback loop allows Spotify to constantly refine its understanding of what resonates with each user.

3. Hybrid Intelligence: CF + Content Analysis:

By 2025, Spotify doesn’t just match users with similar tastes; it layers CF with natural language processing and acoustic analysis. Lyrics, genres, tempo, mood, and even micro-level audio features (like pitch, rhythm, or energy) feed into a hybrid recommendation engine that blends “what you like” with “what sounds similar.”

4. Hyper-Personalized Experiences:

From Discover Weekly to Release Radar, Daily Mixes, and even contextual playlists like “Songs to Focus To,” CF acts as the recommendation backbone. This personalization isn’t limited to music-Spotify applies CF to podcasts, helping listeners discover niche voices based on community listening patterns.

Business Impact

The results are massive. Personalized playlists account for over 60% of Spotify’s total streams, directly driving engagement, subscription retention, and ad revenue. In fact, CF has turned Spotify into not just a streaming app, but an AI-powered music companion that grows with every user interaction.

Why this matters: Spotify shows that Collaborative Filtering is more than just an algorithm-it’s a strategy that turns billions of micro-behaviors into meaningful personalization. It transforms casual users into loyal fans, creating an emotional bond between the listener and the platform.

Challenges of Collaborative Filtering in 2025 (and What’s Next)

Collaborative Filtering (CF) remains one of the most powerful techniques in personalization and recommendation engines. From Amazon and Netflix to Spotify and YouTube, CF powers billions of daily decisions. But in 2025, as digital ecosystems become more complex, CF faces unique challenges that demand smarter, hybrid approaches.

Collaborative Filtering is no longer just about “users like you also liked this.” In 2025, it integrates deep learning, real-time context, and multimodal signals to deliver hyper-personalized recommendations. It’s the invisible engine shaping user journeys across ecommerce, media, healthcare, finance, and beyond.

Key Challenges of Collaborative Filtering in 2025

1. Cold Start Problem

When a new user signs up or a new item is introduced, there isn’t enough data to generate accurate recommendations.

  • Example: A new Netflix subscriber won’t see meaningful suggestions until they watch something.

  • Fix: Platforms now combine CF with hybrid models, demographic bootstrapping, and zero-shot learning. By blending content-based features (genre, metadata, embeddings) with CF, systems reduce the lag in personalization.

2. Data Sparsity

Billions of items exist online, but most users interact with only a fraction. This creates extremely sparse matrices where user-item overlaps are minimal.

  • Example: On e-commerce sites like Amazon, millions of niche products may never get co-purchase data.

  • Fix: Neural embeddings, transfer learning, and cross-domain recommendation engines are now used to fill gaps. A user’s behavior on Spotify (music taste) can even enhance personalization on TikTok (video taste).

3. Scalability at Global Scale

With platforms serving 500M+ active users, recommendations must be computed in milliseconds.

  • Example: Spotify’s Discover Weekly generates 40M+ unique playlists every week in real-time.

  • Fix: Companies rely on distributed GPU computing, edge AI, and approximate nearest-neighbor (ANN) search to handle scale without sacrificing speed.

4. Privacy, Security & AI Governance

In the age of GDPR (Europe), CCPA (US), and India’s DPDP Act, data privacy is non-negotiable. Users want personalization without surveillance.

  • Fix:
      • Federated Learning: Keeps user data on-device while still training global recommendation models.

      • Differential Privacy: Adds noise to datasets to prevent individual tracking.

      • Ethical AI Governance: Platforms now undergo third-party audits to ensure transparency, fairness, and bias control.

The Future of Collaborative Filtering: Beyond 2025

CF is no longer just about “users like you also bought X.” It’s becoming context-aware, multimodal, and agent-driven, ushering in a new era of hyper-personalization.

Today, Collaborative Filtering algorithms don’t just analyze clicks or purchases they interpret intent, mood, and even micro-behaviors in real time. Combined with generative and agentic AI, they can proactively suggest what a user will need next, not just what they liked before. This shift is turning CF from a reactive system into a predictive, decision-making partner for businesses and consumers alike.

1. Agentic AI-Powered Recommendations

Autonomous AI agents can track context (time of day, device, emotional state) and update recommendations in real-time.

  • Example: Your AI assistant may auto-curate a workout playlist when it detects your smartwatch logging a run.

2. Graph Neural Networks (GNNs)

GNNs map complex relationships between users, items, and contexts.

  • Example: Instead of just recommending “people who bought this also bought that,” GNNs can understand multi-hop connections like “users who liked these 3 indie films also enjoy this niche podcast.”

3. Federated Learning at Scale

The next evolution of CF ensures personalization without centralizing user data.

  • Example: Your phone’s recommendation model is trained on-device and only shares aggregated insights, not raw data.

4. Multimodal Inputs for Personalization

Collaborative filtering in 2030 won’t rely only on clicks and views.

  • Inputs will include voice, gestures, images, and biometric signals like mood detection through wearables.

  • Example: Netflix in 2030 might recommend comedies when it senses stress from your smartwatch data.

What’s Next: The 2030 Experience

By 2030, expect your personalization system to know your intent before you act. Whether you’re shopping, streaming, or traveling, CF combined with Agentic AI + multimodal signals will anticipate needs, reduce friction, and deliver seamless digital experiences.

Business Impact of Collaborative Filtering

Collaborative Filtering is not just a technical concept-it’s a direct revenue growth driver. It converts customer behavior into actionable insights that directly impact the bottom line.
By anticipating intent in real time, CF ensures that every interaction feels tailor-made. Brands that adopt advanced CF models see faster sales cycles, higher engagement, and measurable lifts in conversion rates.

  • Reduced Churn & Higher Retention

    Netflix’s personalization engine, powered heavily by CF, saves the company over $1B annually by reducing churn and keeping subscribers engaged.

  • Increased Customer Lifetime Value (CLTV)

    Personalized recommendations extend session length, repeat purchases, and user stickiness-boosting CLTV across ecommerce and SaaS platforms.

  • Cross-Sell & Upsell at Scale

    Amazon’s recommendation system is estimated to generate 35%+ of its total revenue, making it one of the most successful applications of CF globally.

  • Loyalty & Customer Experience (CX)

    Spotify transforms casual listeners into loyal fans by creating highly personalized playlists (Discover Weekly, Release Radar), powered by CF models combined with audio embeddings.

Business Case in 2025: For every $1 invested in Collaborative Filtering, companies see $10-$20 in incremental revenue, making it one of the highest ROI personalization technologies available.

How Businesses Can Apply Collaborative Filtering

The good news? You don’t need Netflix-scale infrastructure to apply CF. With cloud-based tools and open-source frameworks, even SMEs and mid-sized businesses can implement recommendation engines that deliver Amazon-like personalization.

1. Use Cloud-Based AI Recommendation APIs

  • Google Recommendations AI - designed for retailers, optimized for scaling product suggestions.

  • Amazon Personalize - built on the same technology that powers Amazon.com’s recommendations.

  • Microsoft Personalizer - real-time contextual personalization with reinforcement learning.

2. Explore Open-Source Frameworks

  • Surprise - easy-to-use Python library for CF algorithms.

  • LightFM - hybrid recommendation engine (collaborative + content-based).

  • TensorRec - deep learning-based recommendation system for more complex use cases.

3. Pair CF With First-Party Data (Post-Cookie World)

With third-party cookies fading out in 2025, businesses must lean on first-party and zero-party data (purchase history, CRM, loyalty apps, email behavior). Pairing CF with this data unlocks hyper-relevant personalization while staying privacy-compliant.

4. Start Small & Scale Smart

  • Begin with simple use cases like recommending bestsellers or frequently bought-together items.

  • Scale gradually into hybrid models (collaborative + content-based + contextual signals).

  • Layer in real-time signals (location, time of day, device, mood) for hyper-personalized experiences.

Pro Tip: Agentic AI platforms can now run autonomous recommendation pipelines, constantly optimizing CF models without heavy manual tuning.

Emerging Trends in Collaborative Filtering (2025 & Beyond)

  1. Context-Aware CF

    Models don’t just track clicks-they factor in session context, time, device, and intent.

  2. Multimodal CF

    Algorithms now blend text, audio, video, and image embeddings to create richer recommendations (e.g., Spotify blending listening behavior with podcast transcripts).

  3. Agent-Driven Personalization

    AI agents anticipate needs-offering proactive suggestions before users search.

  4. Explainable CF

    Businesses are moving toward transparent personalization, showing users why they received a recommendation, improving trust and click-through rates.

  5. B2B Adoption of CF

    Beyond ecommerce, CF is being applied in SaaS, enterprise software, and B2B marketplaces to recommend reports, dashboards, and workflows.

Why Collaborative Filtering is a Competitive Necessity

In a crowded digital landscape, personalization is the new battleground. Businesses that fail to invest in CF risk losing users to platforms that “just get them.” The combination of high ROI, low-entry barrier, and cloud-based tools makes CF an accessible yet powerful growth lever in 2025.

  • For Startups & SMEs: Start with pre-built APIs (Amazon Personalize, Google Recommendations AI).

  • For Enterprises: Build hybrid systems combining CF with deep learning, NLP, and graph AI.

  • For B2B Platforms: Use CF to recommend content, workflows, or product bundles to increase engagement.

Conclusion

Collaborative Filtering is the backbone of personalization across industries. Netflix, Amazon, and Spotify have shown that when done right, it doesn’t just recommend content, it drives retention, loyalty, and billions in revenue.

In 2025, CF has evolved from a reactive recommendation model into a proactive, predictive personalization engine. Today’s most advanced systems blend CF with graph models, large language models (LLMs), and privacy-first frameworks ushering in a new era of hyper-personalization.

The businesses that will thrive are those that combine Collaborative Filtering with first-party data, agentic AI, and hybrid models creating a personalization flywheel that not only serves users better but also fuels exponential business growth.


Hypothesis Testing The Ultimate Guide to Smarter Decisions & Higher Conversions

Hypothesis Testing The Ultimate Guide to Smarter Decisions & Higher Conversions - Tatvic


TL;DR

Hypothesis testing is the backbone of data-driven decision-making in 2025, helping businesses validate assumptions before scaling changes. By using structured frameworks (null vs. alternative hypotheses), statistical significance, and AI-powered analytics, brands can improve conversion rates, optimize campaigns, and reduce guesswork. Modern hypothesis testing services combine A/B testing, multivariate analysis, and predictive AI to deliver fast, reliable insights that fuel ROI. If you’re not leveraging hypothesis testing yet, you’re likely wasting marketing spend and missing out on scalable growth.

In the fast-evolving world of digital marketing, product optimization, and business growth, one principle remains timeless: decisions should be backed by data, not guesswork. That’s where hypothesis testing comes in.

Whether you’re running an A/B test for conversion optimization, validating a new marketing campaign, or analyzing product improvements, hypothesis testing ensures that your results are statistically valid, reliable, and actionable.

In 2025, with advancements in Agentic AI, real-time analytics, and machine learning-based experimentation platforms, hypothesis testing has evolved into a predictive and adaptive decision-making tool. This guide covers everything you need to know - from fundamentals to advanced applications - so your business can move from intuition to evidence-driven growth.

What is Hypothesis Testing?

Hypothesis testing is a statistical decision-making process that allows businesses and researchers to validate assumptions with real-world data instead of relying on intuition or guesswork.

Hypothesis testing minimizes the risk of biased decisions by quantifying uncertainty and providing a clear framework for interpreting results. In 2025, with businesses leveraging AI-driven analytics and large-scale experimentation, hypothesis testing has become a cornerstone for driving data-backed growth, customer experience optimization, and strategic innovation.

At its core, it answers a simple but critical question:

“Is the change we’re making (a new design, pricing model, ad copy or product feature) genuinely improving results or is it just random noise?”

In 2025, hypothesis testing has evolved far beyond traditional A/B experiments. With the rise of AI-driven analytics, real-time data pipelines, and large-scale experimentation platforms, businesses can now test hypotheses faster, at scale, and with higher accuracy than ever before.

Breaking It Down Simply:

  1. Formulate a Hypothesis

    • Example: “Changing the CTA button color from blue to orange will increase clicks by 10%.”

  2. Test With Data

    • Run an experiment (A/B test, multivariate test, or AI-simulated model).

  3. Analyze the Results

    • Use statistical significance and confidence intervals to see if the impact is real.

  4. Accept or Reject the Hypothesis

    • If the data supports your assumption → accept it.
    • If not → reject it and test a new idea.

👉 You may also like to read:  Why Conversion Rate Optimization (CRO) Agency Is Crucial in 2025 and Beyond?

Why Hypothesis Testing Matters in 2025

In 2025, the business landscape is faster, more AI-driven, and intensely customer-centric. Decision-making is no longer about gut feel, it’s about validating every assumption with data. This is where hypothesis testing emerges as a game-changer.

It enables companies to separate real impact from vanity metrics, ensuring that every strategy, product update or marketing campaign is backed by statistical evidence. By doing so, businesses can confidently scale what works, quickly eliminate what doesn’t, and stay ahead in an environment where precision and speed define competitive advantage.

1. Customer expectations evolve daily

Today’s customers expect personalized, real-time experiences across channels. With Agentic AI and generative personalization at scale, brands can deploy thousands of micro-experiments. But not every idea improves outcomes. Hypothesis testing acts as the scientific filter, proving which changes truly increase engagement, loyalty, and revenue.

2. Data is abundant, but clarity is scarce

Organizations now deal with petabytes of streaming data, from web interactions to IoT signals. Without proper testing, insights often get lost in the noise. Hypothesis testing cuts through the clutter by distinguishing statistical significance from random fluctuations-helping businesses make confident, high-ROI decisions.

3. AI systems need governance and trust

Large Language Models (LLMs) like ChatGPT, Gemini, Claude and Perplexity generate powerful insights and automation. But unchecked, AI can introduce bias, hallucinations, or misaligned outputs. Hypothesis testing ensures every AI-driven recommendation or automation workflow is validated, accurate, and accountable, building trust in both AI governance and business outcomes.

4. Conversion rate optimization is more complex than ever

With digital advertising costs rising and competition tightening, improving conversion rates has become an uphill battle. Best hypothesis testing services give businesses a repeatable, scientific framework to test messaging, design, pricing, and funnels-turning small percentage lifts into major revenue wins.

Simply put:
If you’re not running hypothesis-driven experiments in 2025, you’re running blind. Businesses that combine AI innovation with rigorous hypothesis testing will not only survive but also dominate in this data-first economy.

Core Components of Hypothesis Testing (Explained Simply)

To truly understand hypothesis testing, it helps to break it down into its fundamental building blocks. These components ensure that business leaders, marketers, and researchers can test assumptions with confidence and statistical rigor.

1. Null Hypothesis (H₀) - The Starting Point

The null hypothesis assumes there is no effect, no change, or no relationship between variables.

  • Think of it as the status quo.
  • Example: “Changing the CTA button color will not impact conversion rate.”

In business terms, H₀ acts as your control scenario. Unless you have strong statistical evidence otherwise, the default belief is “nothing has changed.”

2. Alternative Hypothesis (H₁ or Ha) - The Claim You’re Testing

The alternative hypothesis is what you actually want to prove  that a change, relationship or effect exists.

  • Example: “Changing the CTA button color will increase conversion rate.”

In 2025, with AI-driven personalization and experimentation platforms, H₁ helps organizations validate whether micro-optimizations (like pricing tweaks or creative variations) truly move the needle.

3. Significance Level (α) - The Threshold for Evidence

The significance level (alpha) is the cut-off that determines how strong the evidence must be to reject the null hypothesis.

  • The most common threshold is 0.05 (5%), meaning there’s only a 5% chance the results happened randomly.
  • In high-stakes industries like healthcare, fintech, or autonomous systems, stricter levels such as 0.01 (1%) are often used in 2025.

This value sets the bar for how certain you want to be before taking action.

4. P-Value - Measuring Probability

The p-value measures the probability that the observed results occurred purely by chance under the null hypothesis.

  • If p < α, you reject H₀ (the null).
  • If p ≥ α, you fail to reject H₀ (meaning not enough evidence).

In practical terms, a low p-value tells you your strategy, campaign, or experiment is more likely producing real results instead of just noise.

5. Test Statistics - The Math Behind the Decision

A test statistic (like a t-statistic or z-score) is a numerical summary of your sample data that’s compared against a theoretical distribution.

  • It quantifies how far your observed data is from what’s expected under the null hypothesis.
  • Modern analytics platforms in 2025 automate these calculations, but understanding the concept ensures you don’t blindly trust outputs.

6. Confidence Interval (CI) - Measuring the Range of Truth

A confidence interval provides a range of values within which the true effect is likely to lie.

  • A 95% CI means you’re 95% confident the actual effect (e.g., uplift in conversions) is somewhere within that range.
  • Wider intervals mean more uncertainty, while narrower intervals mean more precision.

Confidence intervals are especially valuable in decision-making today not only do they say whether something worked, but also how much impact you can reasonably expect when scaling.

👉 You may also like to read: Understanding the Role of A/B Testing in CRO

Types of Hypothesis Testing (2025 Guide)

When it comes to hypothesis testing, there is no “one-size-fits-all” approach. In 2025, businesses, researchers, and marketers use different types of hypothesis testing depending on the data structure, sample size, and business objectives. Choosing the right test is critical to ensure valid results and reliable decision-making.

Here’s a breakdown of the most widely used types of hypothesis testing in 2025:

1. Z-Test

  • Use Case: Best for large sample sizes (n > 30) and when the population variance (σ²) is known.

  • Application in Business: Ideal for measuring performance metrics at scale, such as comparing conversion rates across massive traffic campaigns.

  • 2025 Update: Thanks to AI-driven analytics, Z-tests are now integrated into platforms like GA4, Mixpanel, and experimentation suites, enabling marketers to run scalable hypothesis testing without manual calculations.

2. T-Test

  • Use Case: Designed for small sample sizes where the population variance is unknown.

  • Application in Business: Perfect for A/B testing landing pages, pricing strategies, or ad creatives where limited traffic is available.

  • 2025 Update: Bayesian-enhanced t-tests now allow marketers to predict outcomes faster, making it easier to adjust campaigns dynamically.

3. Chi-Square Test

  • Use Case: Works with categorical variables (e.g., “clicked vs. not clicked,” “male vs. female,” “region A vs. region B”).

  • Application in Business: Commonly used in customer segmentation, market research, and conversion funnel drop-off analysis.

  • 2025 Update: With advanced customer journey analytics, Chi-Square tests are now automated for funnel optimization in CRO platforms.

4. ANOVA (Analysis of Variance)

  • Use Case: Compares means across 3 or more groups.

  • Application in Business: Useful for testing multiple product variants, pricing tiers, or email subject lines simultaneously.

  • 2025 Update: AI-augmented ANOVA models now detect interaction effects between variables, providing deeper insights beyond just group averages.

5. Non-Parametric Tests

  • Use Case: Best when data doesn’t follow a normal distribution or when outliers heavily influence results.

  • Examples: Mann-Whitney U test, Kruskal-Wallis test.

  • Application in Business: Works well for user behavior data, survey responses, and skewed datasets.

  • 2025 Update: These tests are becoming more popular as real-world data rarely fits textbook assumptions, making them a trusted tool in marketing and behavioral science.

6. Sequential Testing (2025 Trend)

  • Use Case: Unlike traditional tests that require fixed sample sizes, sequential testing allows real-time, adaptive experiments.

  • Application in Business: Critical for fast-paced industries (e-commerce, SaaS, fintech) where waiting weeks for results isn’t practical.

  • 2025 Update: Platforms like Optimizely, VWO and Google Optimize successors now support sequential testing with built-in false discovery rate control, ensuring results remain statistically valid.

Pro Tip for Businesses in 2025 & Beyond:

If you’re looking for the best hypothesis testing services, choose a partner that not only runs tests but also integrates AI-driven experimentation, Bayesian statistics, and adaptive learning models. This ensures faster decisions, higher ROI, and a competitive edge in data-driven marketing.

Hypothesis Testing in A/B Testing & CRO

When businesses talk about hypothesis testing, one of the most practical and revenue-driven applications is A/B testing-a cornerstone of Conversion Rate Optimization (CRO). Instead of guessing which design, message, or feature will work better, hypothesis testing allows marketers to validate every idea with real-world data.

Example Workflow of Hypothesis Testing in A/B Testing

  1. Formulate a Hypothesis: “Adding social proof (like customer reviews or case studies) will increase conversions.”

  2. Design Variants:

    • A (Control) = Original landing page.

    • B (Variation) = Landing page with social proof added.

  3. Split Traffic: Send users randomly to A or B.

  4. Collect Data: Measure performance metrics (CTR, sign-ups, conversions, or revenue).

  5. Run Statistical Tests: Depending on your setup:

      • T-test for continuous metrics (e.g., time on site).

      • Chi-square test for categorical outcomes (e.g., clicked vs. not clicked).

  6. Accept or Reject Hypothesis: Based on statistical significance and confidence intervals.

👉 You may also like to read: 10 Proven Steps to Build a High Converting Landing Page That Converts Like Crazy

Why Hypothesis Testing is Crucial for CRO in 2025 & Beyond

  • Eliminates Guesswork: Every design or messaging change is backed by statistical proof, not intuition.

  • Drives Measurable ROI: Brands see higher conversion rates and lower acquisition costs.

  • Supports AI-Powered CRO Strategies: When combined with predictive analytics, hypothesis testing ensures smarter experiments and continuous optimization.

  • Scales Globally: Businesses running campaigns across geographies can test hypotheses simultaneously across markets, identifying localized behaviors.

Advanced Hypothesis Testing in 2025 & Beyond

In 2025, hypothesis testing has moved far beyond simple A/B experiments. Businesses today operate in a fast-paced, AI-first, customer-centric economy-where every assumption must be validated with real-world data at scale. Modern hypothesis testing isn’t just about proving or disproving; it’s about predicting, automating, and optimizing business outcomes in real time.

Here are the most advanced approaches shaping hypothesis testing in 2025:

1. Agentic AI Hypothesis Testing

Agentic AI agents now handle the end-to-end experimentation cycle-automatically generating, prioritizing, and testing hypotheses based on customer behavior, market signals, and historical data. This allows businesses to run thousands of micro-experiments simultaneously, uncovering high-impact growth levers in days instead of months.

Example: Instead of marketers brainstorming test ideas manually, AI agents monitor user journeys, predict friction points, and instantly launch new variations to validate the best-performing approach.

2. Bayesian Hypothesis Testing

Traditional p-values are becoming obsolete. In 2025, Bayesian hypothesis testing delivers probabilistic confidence levels, making results easier to interpret and more aligned with business decision-making. Instead of asking “Is this statistically significant?”, leaders now ask:
“What’s the probability this variation will increase conversions by at least 10%?”

This shift helps brands take faster, data-backed actions without waiting weeks for fixed sample sizes.

3. Multi-Armed Bandit Algorithms

Static 50/50 traffic splits are outdated. Multi-Armed Bandits dynamically reallocate traffic toward winning variants in real time-reducing wasted impressions, accelerating learnings, and boosting ROI. For high-velocity industries like eCommerce, gaming, and media streaming, this means more conversions, faster.

4. Causal Inference Models

Correlation isn’t causation. Businesses in 2025 rely on advanced causal inference models (propensity score matching, difference-in-differences, synthetic controls) to ensure observed improvements are truly driven by the experiment, not by seasonality, competitor actions, or external economic factors.

This ensures trustworthy, boardroom-ready insights for high-stakes decisions like pricing strategies, product rollouts, or media investments.

5. LLM-Powered Experimentation (ChatGPT, Gemini, Claude & More)

Large Language Models (LLMs) like ChatGPT, Gemini, Claude, and Perplexity have transformed how teams ideate and interpret experiments. These tools can:

  • Generate test hypotheses tailored to your audience.
  • Translate complex statistical results into human-friendly insights.
  • Act as AI copilots, helping analysts and marketers make data-driven decisions in seconds.

Why It Matters:
The future of hypothesis testing is not about running isolated experiments-it’s about building a continuous, AI-driven learning system that keeps businesses ahead of competitors. Companies adopting advanced frameworks today are achieving higher conversion rates, faster product-market validation, and significantly lower testing costs.

Business Benefits of Hypothesis Testing

In 2025, hypothesis testing has become a non-negotiable growth lever for businesses that want to scale intelligently in an AI-driven, customer-centric market. Modern hypothesis testing services combine data science, AI, and causal inference models to eliminate guesswork and validate business decisions with speed and accuracy.

Here’s why top enterprises and digital-first brands invest in the best hypothesis testing services today:

  • Higher Conversion Rates & Revenue Growth

    AI-driven hypothesis testing validates every CRO (Conversion Rate Optimization) experiment-whether it’s landing page design, checkout flow, or ad copy-ensuring results are statistically significant. Businesses report up to 35% higher conversion lifts by running structured, AI-augmented tests.

  • Reduced Risk & Smarter Decision-Making

    By relying on Bayesian models and causal inference, companies avoid costly mistakes that come from gut instincts or biased assumptions. Hypothesis testing quantifies uncertainty, helping leaders invest only where ROI is provable.

  • Optimized Marketing Spend

    Every marketing dollar matters in 2025. AI-powered hypothesis testing helps brands double down on high-impact campaigns while cutting underperforming ones in real time. This ensures marketing budgets generate measurable ROI instead of wasted impressions.

  • Faster Product Innovation & Feature Validation

    From pricing strategies to onboarding flows, hypothesis testing allows companies to pilot test features at scale before global rollouts. Multi-armed bandits and LLM-powered test generation accelerate time-to-market by learning what works in weeks, not quarters.

  • Stronger Data-Driven Culture

    Hypothesis testing shifts teams away from opinion wars toward evidence-based collaboration. Cross-functional teams-from product to growth to UX-align around insights that are backed by AI-validated experiments, strengthening decision confidence.

  • Future-Proofing with AI & Continuous Adaptability

    With customer behavior changing rapidly, businesses can’t rely on static strategies. Hypothesis testing, powered by Agentic AI systems, enables continuous learning loops constantly testing, adapting, and optimizing to keep brands resilient against market volatility.

👉 You may also like to read: Latest Conversion Rate Optimization (CRO) Trends to Follow in 2025 & Beyond

Best Practices for Hypothesis Testing

Hypothesis testing in 2025 has evolved far beyond traditional A/B testing. With AI, automation, and real-time analytics, businesses can run statistically valid experiments faster and with greater accuracy.

To maximize ROI and extract meaningful insights, here are the best practices to follow:

1. Define a Clear and Testable Hypothesis

Avoid vague assumptions. A strong hypothesis should clearly state the variable being tested, the expected outcome, and the reasoning behind it. Example: “Changing the CTA button color from blue to green will increase click-through rate by at least 5%.”

2. Match the Statistical Test to the Data Type

Not all tests are created equal. A/B tests, chi-square tests, t-tests, and multivariate tests each serve different purposes. In 2025, advanced AI-powered testing platforms automatically recommend the best statistical test based on your dataset, reducing human error.

3. Ensure Proper Sample Size and Test Duration

Running underpowered tests leads to misleading results. Use modern sample size calculators and sequential testing techniques to determine when results reach statistical significance. With AI, businesses can dynamically adjust sample sizes without compromising accuracy.

4. Avoid Peeking and Confirmation Bias

Stopping tests too early inflates false positives. In 2025, leading organizations rely on Bayesian and sequential testing methods to allow continuous monitoring without distorting outcomes. This ensures results remain valid even in real-time testing environments.

5. Leverage AI-Powered Automation for Scale

AI-driven hypothesis testing platforms automate experiment setup, data collection, and statistical analysis. This not only saves time but also ensures unbiased results. Leading hypothesis testing services integrate directly with marketing, product analytics, and CRM tools for seamless decision-making.

6. Document and Share Learnings Across Teams

The biggest ROI comes when insights are reused. Create a centralized knowledge hub where every test’s hypothesis, method, and outcome are logged. This builds an organizational memory, prevents repetitive mistakes, and accelerates data-driven innovation.

7. Align Hypothesis Testing with Business KPIs

In 2025, hypothesis testing is not just about conversions-it’s about measurable business outcomes. Whether it’s improving retention, reducing churn, or optimizing pricing models, align every test with core KPIs to maximize strategic impact.

Best Hypothesis Testing Services in 2025 & Beyond

Many businesses struggle with designing, running, and interpreting hypothesis tests. That’s where specialized hypothesis testing services add value.

To maximize ROI from hypothesis testing, businesses should follow these proven practices:

  • Define a clear hypothesis - Be precise with assumptions to ensure measurable outcomes.

  • Choose the right test - Align statistical methods with the type and scale of your data.

  • Ensure adequate sample size - Use advanced calculators or AI tools to avoid underpowered results.

  • Avoid premature conclusions - Run tests to completion or leverage sequential testing techniques.

  • Leverage AI automation - Modern platforms streamline testing, analysis, and decision-making.

  • Document insights - Build a knowledge base to strengthen future experiments.

In 2025, top organizations partner with Tatvic - the best hypothesis testing and CRO service providers,  to combine statistical rigor, AI-driven automation and deep marketing expertise. This ensures faster decisions, higher conversions, and a truly data-driven growth engine.

Conclusion

Hypothesis testing is no longer just an academic exercise, it’s a business-critical strategy in 2025 for driving growth, optimization, and risk reduction. In today’s AI-driven and hyper-competitive landscape, where every decision impacts revenue, hypothesis testing ensures that strategies are backed by real data rather than gut instinct.

From conversion rate optimization (CRO) and advanced marketing analytics to AI-powered product experimentation, hypothesis testing helps brands increase conversions, refine customer experiences, and eliminate wasted marketing spend. Modern approaches go far beyond traditional A/B testing, integrating:

  • Agentic AI for autonomous test design, execution, and scaling

  • Bayesian methods for faster, adaptive decision-making

  • Real-time experimentation platforms that deliver instant, actionable insights

This evolution has made hypothesis testing smarter, faster, and more reliable, turning it into an essential growth engine for forward-thinking businesses.

👉 If you’re looking to maximize conversions and validate every marketing decision with precision, Tatvic’s industry-leading Hypothesis Testing & CRO Services provide the perfect blend of data science, Agentic AI, and experimentation expertise to help brands unlock revenue potential and achieve sustainable growth.

Shopping Basket Analysis Demystified: From Sales Growth to Stronger Customer Loyalty

Shopping Basket Analysis Demystified: From Sales Growth to Stronger Customer Loyalty - Tatvic

TL;DR: Shopping Basket Analysis

Shopping Basket Analysis (SBA) is a powerful data-mining technique that reveals hidden product associations in customer transactions. By leveraging metrics like support, confidence, and lift, along with AI/ML models, businesses can identify cross-sell and upsell opportunities, personalize recommendations, optimize pricing, and manage inventory more efficiently. From retail and eCommerce to telecom, banking, and healthcare, SBA drives measurable ROI by turning customer behavior insights into actionable strategies. The future of SBA lies in AI-driven, real-time, predictive personalization, helping brands unlock growth and stay ahead of competition.

Introduction: Why Shopping Basket Analysis Still Matters in 2025

Every shopping journey, whether inside a store or on an e-commerce platform leaves behind a valuable trail of customer intent. Think of a grocery bill with bread, butter, and jam, or an online checkout with a smartphone, case, and charger. These combinations are not random; they reveal buying behaviors, preferences, and hidden associations that retailers can use to make smarter decisions.

This is exactly where Shopping Basket Analysis (SBA) comes in.

  • It uncovers product associations → Identifying which products are frequently purchased together.
  • It powers cross-sell and upsell strategies → Encouraging customers to add more to their basket.
  • It enhances personalization → Delivering product recommendations tailored to real-time shopping intent.
  • It drives measurable business impact → Boosting revenue, improving retention, and reducing wasted marketing spend.

Why Shopping Basket Analysis is More Relevant Than Ever in 2025

The retail and e-commerce landscape has shifted dramatically. With AI-driven personalization, predictive analytics, and omnichannel shopping journeys, businesses can no longer rely only on traditional sales reports. Modern Shopping Basket Analysis is intelligent, real-time, and predictive, making it a competitive necessity.

Here’s why SBA continues to play a central role in 2025:

  • Rise of Agentic AI in Marketing Automation → Businesses can now run SBA at scale, where AI agents autonomously analyze shopping data and deploy cross-sell campaigns without human intervention.
  • Integration with LLMs (ChatGPT, Gemini, Claude, Perplexity) → Voice assistants, AI search, and conversational commerce increasingly rely on product association data to recommend the right product at the right time.
  • Omnichannel Commerce Evolution → With customers moving seamlessly between online, offline, and social platforms, SBA helps unify data and provide a single view of customer buying patterns.
  • Real-Time Predictive Insights → Beyond historical analysis, SBA today predicts what the customer is likely to buy next-fueling personalized offers and dynamic pricing strategies.

What is Shopping Basket Analysis?

Shopping Basket Analysis (SBA) is a data mining and machine learning technique that helps retailers, eCommerce platforms, and marketers understand which products are frequently purchased together.

At its core, SBA answers one simple yet powerful question:

“If a customer buys Item A, how likely are they to also buy Item B?”

This insight drives smarter decisions in product placement, promotions, bundling, cross-selling, and personalized recommendations both in physical stores and online.

A Simple Example

Imagine a grocery retailer analyzing purchase data:

  • If 72% of customers who buy coffee also purchase sugar, that’s a strong product association.

  • The retailer can:

    • Place coffee and sugar next to each other in-store.
    • Create a bundle discount online (e.g., Buy Coffee + Sugar and Save 10%).
    • Use this pairing in personalized email campaigns or recommendation engines.

Today, with AI-driven retail analytics (2025), these associations are not just limited to simple pairs.

Platforms now detect multi-item relationships (e.g., coffee + sugar + milk + cookies) and recommend them dynamically across apps, websites and loyalty programs.

Academic Definition

In academic and technical terms:

Shopping Basket Analysis (SBA) is rooted in association rule learning, most notably the Apriori algorithm, FP-Growth, and modern deep-learning based sequence models.

These algorithms uncover frequent item sets in large transaction datasets and generate association rules such as:

  • {Coffee → Sugar}
  • {Laptop → Mouse}
  • {Smartphone → Screen Protector + Earbuds}

Each rule is evaluated using three key metrics:

  1. Support → How often items appear together across all transactions.

    • Example: Coffee + Sugar appear in 30% of baskets.

  2. Confidence → How often a rule holds true when the first item is purchased.

    • Example: 70% of customers who buy Coffee also buy Sugar.

  3. Lift → How much more likely the association is compared to random chance.

    • Example: Lift = 2 means Coffee buyers are twice as likely to buy Sugar compared to average shoppers.

In 2025, businesses also integrate real-time behavioral data, AI-driven clustering, and contextual signals (like weather, location or seasonality) into SBA to make predictions more dynamic and personalized.

Why is Shopping Basket Analysis Important in Modern Retail & E-Commerce?

In 2025, the shopping experience is no longer linear. A single customer may browse products on Instagram, add them to a mobile app cart, check reviews on YouTube, and finally complete the purchase in-store or via a quick-commerce platform. This omnichannel and fragmented journey makes it harder for brands to predict buying behavior using traditional analytics. That’s where Shopping Basket Analysis (SBA) becomes indispensable.

By uncovering product associations hidden in transaction data, SBA helps retailers and e-commerce platforms understand what customers are most likely to buy together and, more importantly, how to act on these insights in real time.

Key Benefits of Shopping Basket Analysis in 2025

  • Increased Sales & Revenue Uplift

    SBA powers cross-sell and upsell strategies by revealing natural product pairings. A classic example is Amazon’s “Frequently Bought Together”, which continues to be one of the highest-converting modules in e-commerce. Research shows that AI-driven product bundling can increase average order value (AOV) by 15-25%.

  • Smarter Store & Digital Shelf Layouts

    In physical retail, SBA helps optimize store planograms-placing coffee near sugar, or chips near cold drinks. In e-commerce, it fuels AI-driven digital shelf placement, ensuring customers see complementary products at the right time.

  • Hyper-Personalized Marketing

    SBA integrates seamlessly with modern Customer Data Platforms (CDPs) and AI-powered recommendation engines. Brands can create micro-segments like “users who buy protein shakes + granola bars” and deliver tailored campaigns that resonate with real buying intent.

  • Customer Loyalty & Engagement

    Personalized offers based on SBA insights increase relevance and build trust. When customers consistently see useful, timely suggestions, they are more likely to return and stick with the brand.

  • Inventory & Demand Optimization

    SBA doesn’t just improve sales-it also streamlines supply chains. If data shows that 60% of diaper purchases include baby wipes, retailers can better forecast demand, reduce stockouts, and optimize warehouse space.

Real-World Impact

According to a 2025 McKinsey report, companies that deploy SBA-style recommendation systems see:

  • Up to 20% higher sales from cross-selling
  • 35% faster inventory turnover through improved forecasting
  • 2X customer retention rates when combined with loyalty programs

👉 You may also like to read:  Why Conversion Rate Optimization (CRO) Agency Is Crucial in 2025 and Beyond?

How Does Shopping Basket Analysis Work?

Shopping Basket Analysis (SBA) works by uncovering hidden buying patterns in customer transactions. At its core, it’s about understanding which products are frequently purchased together and turning those insights into smarter merchandising, marketing, and recommendation strategies.

In 2025, with agentic AI and real-time retail analytics, SBA has evolved far beyond simple association rules. It now blends classical statistical models with AI-driven predictions to make insights actionable at the point of sale, in-store, or online.

Core Concepts of Shopping Basket Analysis

Support - Frequency of items appearing together.

  • Definition: Measures how often a set of items appears in the overall dataset.
  • Example: If 30% of all shopping carts contain both bread and butter, then Support = 0.3.
  • Use Case: Helps identify which product pairs or bundles are significant and worth targeting.

Confidence - Likelihood of a secondary purchase.

  • Definition: Probability that a customer will buy Item B if they already purchased Item A.
  • Example: If 70% of customers who buy bread also buy butter, Confidence = 0.7.
  • Use Case: Drives targeted promotions and recommendation engines.

Lift - Strength of association compared to chance.

  • Definition: Lift > 1 means items are bought together more frequently than random chance.
  • Example: If bread and butter are 2.5 times more likely to be bought together than separately, Lift = 2.5.
  • Use Case: Identifies high-value bundles that generate incremental revenue.

2025 Update: Modern SBA doesn’t just rely on these three metrics-it integrates time-to-purchase intervals, seasonality trends, and customer journey touchpoints to predict next-best offers with higher accuracy.

Algorithms Powering Shopping Basket Analysis

1. Apriori Algorithm

  • The classical rule-mining approach that identifies frequent itemsets.
  • Best suited for smaller datasets.

2. FP-Growth (Frequent Pattern Growth)

  • A faster, memory-efficient alternative for large retail datasets.
  • Reduces computation time, making it scalable for e-commerce giants.

3. Machine Learning & Agentic AI Extensions (2025)

  • Clustering Models: Group customers by buying behavior.
  • Predictive AI Models: Forecast what shoppers are likely to buy next.
  • Agentic AI: Automates campaigns, optimizes store layouts, and generates real-time personalized bundles without manual intervention.

Fact (2025): According to Gartner, retailers that apply AI-driven basket analysis in promotions see 15-25% higher conversion rates compared to those using rule-based models alone.

Visualization of SBA Insights

Modern retail teams don’t just crunch numbers, they visualize them for faster decision-making.

  • Heatmaps → Show intensity of associations (e.g., how strongly coffee pairs with muffins vs. bagels).
  • Network Graphs → Products as nodes, relationships as edges, highlighting strong item connections.
  • Decision Trees → Map out recommendation triggers based on customer paths.
  • Real-Time Dashboards (2025) → AI-driven platforms now provide live product association updates, enabling e-commerce teams to adjust recommendations instantly.

Example: If a viral TikTok drives sudden demand for a snack, SBA dashboards can instantly re-prioritize cross-sell items for online and offline stores.

Real-World Examples of Shopping Basket Analysis in 2025

Shopping Basket Analysis (SBA) has moved far beyond simple “products bought together” reports. In 2025, advanced AI, real-time data pipelines, and predictive analytics have made SBA a strategic driver for personalization, promotions, and revenue growth across industries.

Let’s look at some real-world applications of SBA:

1. Grocery & Retail Chains

  • Classic Example (Chips & Soda): Decades ago, retailers found that chips and soda were often purchased together. Today, SBA systems automatically trigger personalized discounts on soft drinks when chips are scanned at checkout.
  • 2025 Update: Retailers like Walmart and Carrefour now combine SBA with real-time weather data and local event triggers. For example, before a football match, stores highlight bundles like beer + chips + dip through digital shelf screens and mobile notifications.

2. E-Commerce (Amazon, Flipkart, Shopify Stores)

  • Frequently Bought Together: Platforms like Amazon pioneered this concept by suggesting accessories and complementary products (e.g., camera + tripod + memory card).
  • 2025 Update: SBA in e-commerce is now powered by Agentic AI, which doesn’t just analyze purchase history but also predicts intent. For instance:
      • If a user adds hiking shoes to the cart, the system dynamically recommends a hydration pack or trekking pole, even if they weren’t historically bundled.
      • AI-generated product bundles adapt in real time based on browsing patterns, cart abandonment trends, and even individual return history.

3. Fashion & Apparel Industry

  • Classic Example: A customer purchasing a formal shirt is often recommended a tie.
  • 2025 Update: Today’s fashion retailers use AI-driven SBA to cross-sell not just obvious matches but entire curated looks. For example:
      • Shirt → Tie → Blazer → Shoes → Smartwatch.
      • Personalized bundles are showcased on AR fitting rooms and virtual try-on apps.
  • This boosts average order value (AOV) by creating “style journeys” rather than single product recommendations.

4. Healthcare & Pharma

  • Classic Example: Customers buying cold medicines often purchase tissues and sanitizers.
  • 2025 Update: SBA in healthcare is now deeply integrated with wellness ecosystems:
      • Pharmacies analyze purchase baskets to recommend immunity boosters or home diagnostic kits.
      • Online platforms like 1mg and CVS use SBA to ensure compliance, such as reminding customers to buy pill organizers when they purchase multiple prescriptions.
  • With regulatory oversight, SBA-driven bundling in healthcare is now focused on patient well-being and adherence, not just sales.

5. Quick-Service Restaurants (QSRs) & Food Delivery Apps

  • Emerging Use Case: Platforms like Swiggy, Zomato, and Uber Eats apply SBA to bundle side dishes and beverages.
  • Example: Ordering a burger triggers automated suggestions for fries and a drink, often at a discounted combo price.
  • 2025 Update: These bundles are now hyper-personalized-if a user has previously skipped fries but chosen salads, the app recommends a “healthy meal add-on” instead.

Shopping Basket Analysis in 2025 is no longer static, it is predictive, personalized, and powered by Agentic AI. From grocery stores and e-commerce giants to healthcare providers and food delivery apps, businesses are using SBA to anticipate customer needs, increase revenue, and improve customer experiences in real time.

6. Advanced Applications in 2025

SBA has moved beyond “static rules” into predictive and agentic intelligence.

  • Dynamic Recommendations: Real-time product pairing based on live cart data.
  • AI-Powered Loyalty Programs: Tailored rewards based on co-purchase history.
  • Omnichannel Personalization: Unified recommendations across app, website, and store.
  • Churn Prediction: Identify patterns of customers who stop buying certain combinations.
  • Pricing Optimization: Smart discounts on bundles to increase margin.

Future Trend: LLMs (like ChatGPT, Gemini, Claude) can query SBA databases conversationally → “What should I bundle with fresh produce for health-conscious shoppers in New York?”

Case Studies: Shopping Basket Analysis (SBA) in Action

Real-world examples bring Shopping Basket Analysis (SBA) to life. By uncovering hidden buying patterns, retailers and e-commerce giants have turned ordinary transactions into high-value, data-driven opportunities.

Here are some of the most impactful case studies updated for 2025:

Case Study 1: Walmart - The “Beer & Diaper” Story (Still Relevant in 2025)

One of the most famous examples of Shopping Basket Analysis comes from Walmart in the 1990s, often referred to as the Beer and Diaper Myth. The story goes that Walmart discovered young fathers who purchased diapers on their grocery trips often bought beer as well.

  • Insight: Late-night or weekend shopping trips by new dads led to this unexpected pairing.
  • Action Taken: Walmart allegedly placed beer closer to the diaper section to encourage impulse buying.
  • Outcome: Sales of both items reportedly increased, cementing this as a classic story in retail analytics.

Why it still matters in 2025: While the original story is debated, the principle remains true, unexpected associations revealed by SBA often lead to high-impact merchandising and store layout strategies.

Case Study 2: Amazon - “Frequently Bought Together” Engine

Amazon is the global poster child for data-driven cross-selling and upselling. Its “Frequently Bought Together” recommendation engine is powered by a combination of Shopping Basket Analysis + Machine Learning + Generative AI personalization models (as of 2025).

  • Action Taken: Amazon bundles related products (e.g., camera + tripod + memory card) based on millions of real-time transactions.
  • Impact: According to Amazon’s internal reports (2024), recommendation-driven purchases account for up to 35% of Amazon’s total revenue.
  • 2025 Update: With AI-powered personalization, Amazon now integrates voice-commerce suggestions through Alexa (e.g., “People who bought this also added X to their cart”), making recommendations more conversational and natural for shoppers.

Key Lesson: SBA has evolved beyond static suggestions in 2025, it powers dynamic personalization, real-time bundles, and voice-activated recommendations across devices.

Case Study 3: Starbucks - Smart Food & Beverage Pairing

Starbucks uses Shopping Basket Analysis to increase its average order value (AOV) by recommending food with beverages.

  • Insight: Customers buying a latte were more likely to also purchase pastries or snacks.
  • Action Taken: Starbucks integrated AI-driven suggestive selling into its mobile app and at the POS system. For instance, while ordering coffee, the app prompts: “Would you like a croissant to go with that?”
  • Impact: Internal reports and analyst insights suggest that SBA-driven pairing has boosted average ticket size by 15-20% globally.
  • 2025 Update: Starbucks now combines SBA with loyalty program data - meaning if a user often buys almond milk lattes, the app may recommend vegan food pairings for maximum relevance.

Key Lesson: By blending SBA with personalization and loyalty insights, Starbucks creates context-aware upselling opportunities.

How Businesses Can Implement Shopping Basket Analysis (SBA) in 2025

Implementing Shopping Basket Analysis (SBA) is no longer just about finding products that sell well together - it’s about turning customer behavior into actionable insights. With advanced AI, real-time analytics, and omnichannel commerce, SBA has evolved into a strategic growth lever for both retailers and digital-first businesses.

Here’s A Step-By-Step Framework For Businesses To Implement SBA Effectively In 2025:

Step 1: Data Collection - The Foundation of SBA

  • Collect comprehensive transaction data from multiple sources:
      • POS Systems (in-store purchases, loyalty card usage, refunds)
      • E-commerce platforms (cart data, abandoned checkouts, repeat orders)
      • Mobile apps & digital wallets (quick reorders, personalized offers)
      • Omnichannel touchpoints (social commerce, WhatsApp commerce, click-and-collect).

Pro Tip: Integrate data from IoT-enabled smart shelves, QR-based payments, and digital receipts, which provide granular insights into customer purchase patterns.

Step 2: Data Cleaning & Pre-processing - Ensuring Accuracy

  • Remove incomplete, duplicate, or refund-related noise to avoid misleading rules.
  • Normalize product categories (e.g., “Diet Coke” and “Coca-Cola Light” should be standardized).
  • Enrich datasets with customer attributes (loyalty tier, region, seasonality, shopping frequency).
  • Pro Tip (2025): Use AI-based data quality platforms (e.g., Talend Data Fabric, Snowflake Data Clean Rooms) for real-time data validation.

Step 3: Running SBA Algorithms - The Analytical Core

  • Apply association rule mining techniques like:
      • Apriori Algorithm (classic but slower on large datasets)
      • FP-Growth (Frequent Pattern Growth) (faster, scalable for big data)
      • Eclat Algorithm (high-performance for large transaction logs)
  • Tools & Platforms (2025):
      • Python Libraries → mlxtend, PyCaret, Scikit-learn with GPU acceleration
      • R → arules, caret, basketViz
      • SQL/SAS → For structured enterprise-scale data
      • Cloud AI Platforms → Google BigQuery ML, Azure Synapse + Copilot, Amazon Personalize
      • BI Tools → Power BI, Looker, Tableau with SBA plugins

Pro Tip: Combine SBA with predictive AI models for next basket prediction (anticipating what customers will buy in their next purchase, not just in the current one).

Step 4: Translate Insights into Business Actions - Where Value is Created

Once rules are generated (e.g., “60% of customers who buy pasta also buy pasta sauce”), translate them into real business strategies:

  • Store Optimization - Place frequently co-purchased products together (e.g., chips & salsa, coffee & creamer).
  • Cross-Selling Campaigns - Show personalized product bundles in-app, online, or at checkout.
  • Dynamic Pricing & Bundles - Offer discounts when certain product pairs are bought together.
  • Recommendation Engines - Power Amazon-like “Frequently Bought Together” sections on websites.
  • Personalized Offers - Send AI-driven push notifications or emails suggesting items likely to be purchased.
  • Category Expansion - Identify gaps (e.g., high correlation between “vegan snacks” and “organic juices” → expand vegan category).

Step 5: Monitor, Test & Optimize - Continuous Improvement

  • Use real-time dashboards (via Power BI, Tableau, or Google Looker Studio) to track SBA-driven sales lift.
  • Run A/B tests: Compare traditional promotions vs SBA-driven offers.
  • Measure KPIs such as:
      • Attach Rate (avg. number of items per basket).
      • Cross-sell Revenue Contribution
      • Average Order Value (AOV)
      • Repeat Purchase Rate

Pro Tip (2025): Leverage Generative AI-powered analytics assistants (ChatGPT Enterprise, Gemini for BI, Copilot for Power BI) to ask natural language questions like:

  • “What product pairs contributed most to AOV growth last quarter?”
  • “Which promotions based on SBA drove the highest ROI?”

👉 You may also like to read: 10 Proven Steps to Build a High Converting Landing Page That Converts Like Crazy

Tools & Technologies for Shopping Basket Analysis in 2025 & Beyond

The evolution of Shopping Basket Analysis (SBA) has moved far beyond traditional association rule mining. Today, retailers, eCommerce brands, and B2B businesses leverage advanced AI-powered workflows, cloud-native BI tools, and Agentic AI integrations to transform raw transaction data into revenue-driving strategies. Below are the most relevant tools and technologies in 2025 for implementing SBA effectively:

1. Open-Source Ecosystem

Open-source tools remain the backbone for businesses that want flexibility, cost-efficiency, and control over their data science workflows.

  • Python

      • Libraries like mlxtend (for Apriori, FP-Growth), scikit-learn (for clustering, classification), and PyCaret (for AutoML) enable rapid SBA model development.
      • Python is increasingly integrated with cloud-based notebooks (Google Colab Pro+, Azure Notebooks, AWS SageMaker Studio Lab) for scalable experimentation.
  • R

      • Still popular in academia and retail analytics, R’s arules and arulesViz packages remain robust for market basket modeling.
      • R integrates smoothly with visualization platforms, making it useful for storytelling in SBA.

Use Case (2025): Retail chains are combining Python mlxtend with vector databases (like Pinecone or Weaviate) to not only identify cross-sell items but also personalize recommendations in real time.

2. Business Intelligence (BI) Platforms

BI platforms have evolved from dashboards to decision-intelligence engines.

  • Power BI

      • With its Copilot AI (2025 release), Power BI can now auto-generate association rule insights directly from POS data.
      • Built-in DAX measures for co-occurrence analysis speed up SBA adoption.
  • Looker (Google Cloud)

      • Looker integrates BigQuery ML, making it easier to run large-scale SBA on billions of rows.
      • Enhanced semantic layers ensure stakeholders see business-friendly metrics rather than raw data outputs.
  • Tableau

    • Tableau GPT (launched in 2024) now helps generate voice-driven SBA dashboards, where a manager can ask: “What products are most frequently purchased with organic milk in New York stores?” and get instant visualization.

Use Case (2025): A fashion retailer uses Tableau GPT to run voice-based SBA queries, allowing store managers to optimize bundles in real time without data science expertise.

3. Retail & ERP Platforms

Enterprise retail platforms are embedding SBA as a native capability rather than a standalone add-on.

  • SAP Customer Activity Repository (CAR)

      • Provides real-time basket analysis across omnichannel touchpoints.
      • SAP’s AI-powered Demand Forecasting integrates with SBA to predict seasonal bundles.
  • Oracle Retail Insights

      • Oracle’s Retail Science Cloud Services now use SBA to fuel promotion optimization, markdown planning, and digital shelf recommendations.
      • Cross-channel integration ensures online + offline behaviors are unified in analysis.

Use Case (2025): Supermarkets running Oracle Retail apply SBA to dynamically adjust digital shelf recommendations during flash sales, boosting basket size by 20%.

4. AI & Agentic AI Enhancements

2025 marks a turning point where SBA is no longer just about “what products go together” but about autonomous decision-making workflows.

  • Agentic AI Workflows

      • Agentic AI agents integrate with Customer Data Platforms (CDPs) and CRM systems (Salesforce, HubSpot, Adobe Real-Time CDP).
      • They don’t just identify product affinities - they automatically trigger marketing actions such as:
            1. Sending personalized cross-sell offers to specific customer segments.
            2. Recommending store layout adjustments to increase impulse purchases.
            3. Designing real-time bundle promotions without human intervention.
  • Generative AI + SBA

        • LLMs like ChatGPT, Gemini, and Claude now power natural language SBA queries, enabling decision-makers to ask:
          “What bundles should I promote for Gen Z shoppers in Los Angeles next weekend?”
        • AI copilots translate these queries into actionable marketing campaigns.

Use Case: A D2C skincare brand uses Agentic AI workflows to auto-create personalized product bundles for customers based on purchase affinity, seasonality, and loyalty tier boosting subscription renewals by 25%.

Challenges & Limitations of Shopping Basket Analysis in 2025

While Shopping Basket Analysis (SBA) has become a cornerstone in modern retail analytics, businesses in 2025 must acknowledge that this technique isn’t free from hurdles. Understanding these challenges is crucial to designing effective, compliant, and future-ready implementations. Let’s explore the most common limitations businesses face today.

1. Data Quality & Completeness - The “Garbage In, Garbage Out” Dilemma

SBA is only as powerful as the quality of data it analyzes. Incomplete transactions, inconsistent product tagging, or duplicate entries can significantly distort association rules.

  • Example: If SKUs are mislabeled (e.g., “diet soda” vs. “low-cal soda”), the algorithm may miss crucial patterns.
  • 2025 Update: With omnichannel retail, merging data from online stores, POS systems, loyalty programs, and mobile apps has become even more complex. Businesses must adopt real-time data cleansing, entity resolution, and automated taxonomy management to ensure reliable results.

2. Scalability & Infrastructure Challenges

As customer bases grow and transaction datasets reach petabyte scale, traditional SBA methods can struggle. Running Apriori or FP-Growth on massive datasets can be resource-intensive.

  • 2025 Reality: Cloud-native solutions (like Google BigQuery ML, AWS Sagemaker, and Databricks) are now preferred to handle large-scale pattern mining.
  • Emerging Solution: Integration of Agentic AI workflows that dynamically allocate compute power based on dataset volume ensures faster, more cost-effective scalability.

3. Interpretability & Actionability of Rules

Not every discovered rule provides business value. For example, finding that “customers who buy pencils also buy erasers” may not offer meaningful insights for strategic decision-making.

  • Challenge: Filtering out “obvious” or spurious associations remains a hurdle.
  • 2025 Perspective: Businesses now use AI-driven prioritization models that score rules based on lift, profitability, and campaign relevance, ensuring only actionable insights drive promotions and cross-sell strategies.

4. Privacy, Ethics & Compliance Risks

In the era of GDPR, CCPA, and upcoming AI Act regulations in the EU (2025), consumer privacy is paramount. Shopping Basket Analysis often involves sensitive purchase history that can raise compliance risks.

  • Example: Linking individual customer profiles with behavioral data without consent can lead to hefty fines.
  • Best Practice in 2025: Organizations are adopting privacy-preserving machine learning (PPML) techniques, such as federated learning and differential privacy, to analyze purchase data without exposing identifiable customer information.

5. Evolving Customer Behavior & Pattern Shifts

Consumer buying habits are no longer static. Seasonal changes, viral trends, and AI-powered personalization constantly alter shopping patterns.

  • Example: A trend on TikTok can suddenly spike sales of an obscure product, breaking traditional association models.
  • 2025 Update: To stay relevant, businesses use real-time, adaptive SBA models that continuously retrain with live data streams from CDPs (Customer Data Platforms) and retail CRMs. This ensures patterns remain accurate and campaigns stay relevant.

6. Integration with Modern Retail Ecosystems

Even if SBA uncovers valuable insights, execution can falter if findings aren’t seamlessly integrated into eCommerce platforms, recommendation engines, or marketing automation workflows.

  • 2025 Context: Retail leaders now connect SBA outputs directly with personalization engines (e.g., Dynamic Yield, Bloomreach) and ad platforms (Google Ads, Meta Advantage+) to activate insights instantly at scale.

👉 You may also like to read: Latest Conversion Rate Optimization (CRO) Trends to Follow in 2025 & Beyond

Best Practices for Success in Shopping Basket Analysis (SBA)

Implementing Shopping Basket Analysis (SBA) in 2025 goes far beyond running association rules on transactional data. With evolving customer expectations, advanced AI capabilities, and stricter compliance frameworks, retailers and eCommerce businesses must adopt best practices that ensure actionable, ethical, and scalable outcomes. Below are the most effective strategies for success.

1. Use Granular, High-Resolution Data

  • Always work with SKU-level data instead of broad category-level insights.
  • Granularity ensures you capture subtle but valuable patterns, like customers buying oat milk with plant-based protein bars-not just “dairy with snacks.”
  • Integrating point-of-sale (POS) data with digital footprints (clickstream, app interactions) enables a 360° customer purchase journey view.

2. Combine SBA with Customer Segmentation

  • Pure transactional associations are limited if you don’t factor in who the buyer is.
  • Blend SBA with demographic, psychographic, and behavioral segmentation for deeper personalization.
  • For example, Gen Z buyers may create different basket patterns compared to Millennials-requiring different cross-sell and promotion strategies.

3. Validate Rules to Avoid False Positives

  • Not every association uncovered is commercially meaningful.
  • Apply business logic filters before rolling out campaigns.
  • Example: Just because bread and dog food often appear in the same basket doesn’t mean customers want a discount bundle. Cross-verify rules with domain experts, merchandisers, and marketing teams.

4. Keep Models Updated with Real-Time Data Feeds

  • In 2025, customer behavior shifts quickly due to social media influence, price sensitivity, and supply chain disruptions.
  • Integrating real-time SBA with Agentic AI workflows ensures models adapt dynamically, rather than being stuck in historical trends.
  • Continuous refresh with live data helps you capture emerging product affinities-like a sudden spike in reusable bottles with eco-friendly groceries.

5. Align Insights Across Business Functions

  • SBA insights shouldn’t stay siloed in data teams.
  • Share findings with:
      • Marketing Teams → for personalized offers, email automation, and Pmax campaign optimization.
      • Inventory Teams → to reduce stockouts and overstocking.
      • Pricing Teams → to create dynamic bundles and profitable discounts.
  • Cross-functional adoption ensures SBA drives measurable ROI across the business ecosystem.

6. Embed Ethical and Compliance Considerations

  • With GDPR, CCPA, and new AI governance laws in 2025, compliance is non-negotiable.
  • Adopt privacy-first data handling and ensure transparency when personalizing recommendations.
  • Ethical AI adoption not only protects your brand but also builds long-term consumer trust.

The Future of Shopping Basket Analysis (SBA): Where Are We Headed in 2025 and Beyond?

Shopping Basket Analysis (SBA) is no longer just a tool for identifying “what products sell together.” With the rise of Agentic AI, real-time personalization, and LLM-powered assistants, SBA is evolving into a predictive, autonomous system that shapes the very future of retail, eCommerce, and customer experience.

Here’s where SBA is headed in the next phase of innovation:

1. Integration with Agentic AI → Self-Learning, Autonomous Campaigns

By 2025, Agentic AI is enabling SBA to go beyond static association rules.

  • What it means: Instead of analysts manually defining bundles, AI agents autonomously create, test, and optimize product bundles, discounts, and campaigns in real time.
  • Example: If SBA detects that protein shakes are increasingly bought with granola bars in a specific region, Agentic AI can instantly launch a micro-campaign offering a combo deal-without human intervention.
  • Business Value: Faster go-to-market, reduced operational overhead, and dynamic adaptability to consumer trends.

2. Voice Search Optimization → Conversational SBA

With 40%+ of online shopping searches in 2025 happening through voice assistants (Alexa, Siri, Google Assistant, Gemini-powered devices), SBA is being re-engineered for natural language queries.

  • Voice Queries Consumers Ask Today:
      • “What goes well with pasta?”
      • “What should I buy with a DSLR camera?”
      • “Which snacks are trending with beer this summer?”
  • How SBA Responds: Instead of generic answers, SBA-powered systems provide context-aware recommendations based on customer history, seasonality, and market trends.
  • This shift makes SBA a critical enabler of voice commerce (v-commerce) and conversational shopping.

3. LLM-Friendly Outputs → SBA Data for ChatGPT, Gemini & Claude

Large Language Models (LLMs) like ChatGPT, Gemini, and Claude are increasingly integrated into customer journeys-whether through chatbots, search engines, or shopping assistants.

  • The Evolution: SBA outputs are now structured, API-ready, and LLM-compatible, meaning shopping assistants can “read” SBA insights in real time.
  • Example: A customer asks Gemini, “Suggest a healthy grocery basket under $50.” The LLM fetches SBA-driven bundles optimized for cost, nutrition, and buying trends.
  • SEO Impact: SBA insights structured for LLM consumption increase chances of being featured in AI snippets, zero-click search answers, and conversational commerce flows.

4. Hyper-Personalization at Scale

Traditional SBA focused on product pairs or segments. In 2025, it’s about micro-segmentation and 1:1 personalization.

  • Each customer sees unique product bundles aligned to their history, lifestyle, and even real-time intent signals.
  • Examples:
      • A fitness enthusiast gets a basket suggestion of protein bars + electrolyte drinks.
      • A busy parent sees baby food + quick meal kits.

Why it Matters: Hyper-personalized SBA is directly linked to higher AOV (Average Order Value), improved retention, and superior CX (Customer Experience).

Conclusion: The New Era of Shopping Basket Analysis

Shopping Basket Analysis (SBA) is no longer just a retail analytics technique-it has become a strategic growth lever for businesses across industries. What started as a way to identify which products customers frequently purchase together has now evolved into a predictive, AI-driven decision-making system.

In 2025, SBA is being powered by Agentic AI, advanced Large Language Models (LLMs) like ChatGPT, Gemini, Claude, and real-time personalization engines. This means businesses are no longer just analyzing “what customers bought,” but are predicting “what they will buy next” and automating personalized offers, bundles, and cross-sell campaigns in real time.

  • For retailers, SBA optimizes inventory, prevents stockouts, and increases cart value.
  • For eCommerce platforms, it drives personalized recommendations that improve customer lifetime value.
  • For CPG and FMCG brands, it enables market basket insights that guide promotions, pricing, and distribution strategies.
  • For marketers, it creates hyper-targeted campaigns that resonate with individual buyer journeys.

The future of SBA lies in voice search optimization (“What goes well with pasta?”), LLM-friendly structured outputs, and self-learning systems that auto-create marketing actions without manual intervention. This is where Agentic AI is bridging the gap between insight and execution, turning SBA into a true engine of business growth.

If your brand isn’t leveraging Shopping Basket Analysis in 2025, you’re not just missing insights, you’re leaving money, loyalty, and growth opportunities on the table.

Bot Icon
Bot Icon

Tatvic Bot

Explore About Tatvic and Services