Ever since the computerization of point-of-sale systems, retailers have been collecting vast amounts of customer purchasing and behavior data. The problem is how to make sense of it all. Traditional reports don’t reveal much of the information but the challenge is to take it one step further – to identify relationships between products. This problem is equally applicable to online era as well where there is need to know how one product is behaving with respect to other product. Whether these two products are complementary in nature and are they purchased together?
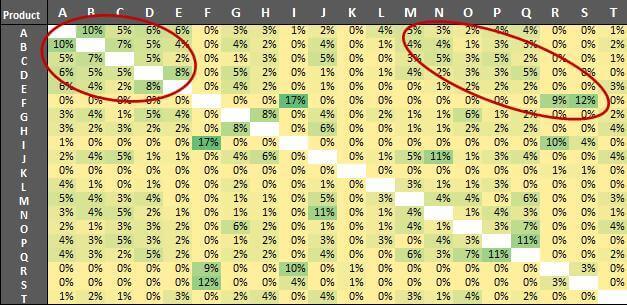
We felt this need and tried to solve this problem at a very basic level out of which is simple 2 by 2 chart of top 20 products of a clothing client. We extracted the transaction data to find out the probability of two or more products being purchased simultaneously in a single transaction. We used Tatvic GA Excel Plugin and some pure excel functions to extract the data. Below are the findings of data that we analyzed:
Data Analysis and Findings
Through careful analysis we realized that:
- In 10% transactions of product “A”, product “B” was also purchased.
- In 17% transactions of product “F”, product “I” was also purchased followed by 12% transactions having product “S”.
- In approximately 5% transactions of product “I”, products R and S were also purchased.
- In 11% transactions of product “P” product “Q” was also purchased.
- Red circles in the diagram show hot zones where maximum slot of transactions happen and should be our focus.
Recommendation:
Above insights can be used to decide optimum promotion and pricing strategies like:
- Ensuring that products being purchased in combination are on same page side by side.
- Highlighting those products on top landing pages of site.
- Providing discount in form of shipping benefits to group of products giving higher average order value.
- Finding out single product transactions and tie those products to moving items at discounted rate.
There is a whitepaper “Product Purchase Pattern Analysis” which covers this article in comprehensive manner.
Stay tuned for second part of shopping basket analysis where you can analyze up to 50 products and their purchase data based on affinity rules.


