Hello There!

Lorem ipsum dolor sit amet, consectetur adipiscing elit,

Marketing Attribution Analytics: How to Detect Silent Failures Before They Drain Your Budget

In the previous blog in this series, we covered what proactive analytics means and why reactive monitoring costs businesses more than they realise. This blog goes one level deeper into one of the most financially damaging places where reactive measurement fails: marketing attribution analytics.

Here is the core problem:

  • Attribution tells you which channels, campaigns, and touchpoints drove a conversion
  • When it works, it is one of the most powerful tools a marketing team has
  • When it breaks silently, and it breaks far more often than most teams acknowledge, it becomes one of the most expensive problems in digital measurement

The critical issue: marketing attribution analytics does not fail loudly. No error is thrown. No warning appears in GA4. Your reports still populate. Your dashboards still update. The numbers just quietly stop reflecting reality.

The Attribution Confidence Gap Is Larger Than Most Teams Admit

The data on this is striking:

  • A 2024 survey by Ascend2 and RevSure found that only 31% of marketing professionals are extremely confident in the accuracy of their attribution data
  • Nearly 7 in 10 marketers are making budget decisions on data they are not fully confident in
  • McKinsey’s 2024 Digital Marketing Survey found that 76% of marketers still struggle to determine which channels deserve credit for conversions
  • Research from the Digital Marketing Institute puts the cost at up to 30% of total marketing budget misallocated due to poor attribution

For a team spending $500,000 per quarter on paid media, that is $150,000 allocated based on flawed or incomplete attribution.

These are not niche problems affecting underfunded teams. They are systemic failures that exist inside sophisticated, well-resourced marketing organisations.

How Attribution Breaks Silently

Marketing attribution analytics breaks in predictable ways. None of them surface as obvious errors in your reporting. Understanding where the breaks happen is the first step toward catching them proactively.

UTM parameters go missing or inconsistent.
  • Campaign launches without properly tagged URLs
  • Traffic lands in GA4 as “direct/none” with no campaign credit
  • According to a SEMrush 2024 study, 42% of companies implement UTMs without a clear strategy
  • Only 58% of marketing teams have a documented naming convention
  • The same LinkedIn campaign can appear as “LinkedIn,” “linkedin,” and “LI” in three separate reports, fragmenting data across three false sources
UTM parameters get stripped in redirects.
  • Campaign URL is tagged correctly at launch
  • Landing page involves a redirect and UTM parameters are dropped during it
  • Session lands as direct traffic with no recoverable attribution
  • Common failure point: domain migrations and cross-subdomain tracking setups
Cross-domain tracking gaps misroute sessions.
  • User clicks a paid ad, lands on a campaign page, then moves to the main site to purchase
  • If cross-domain tracking is not configured correctly in GA4, the session resets at the domain boundary
  • The purchase attributes to “direct” instead of the paid campaign that started the journey
Channel self-competition distorts spend decisions.
  • Paid and organic results for the same brand terms compete for attribution credit
  • A conversion from organic search after an earlier paid click may attribute to organic entirely
  • Neither channel gets an accurate picture, and neither budget gets optimised correctly
Privacy changes are widening the gaps further.
  • 56% of marketers say privacy regulations have made attribution harder
  • iOS14’s App Tracking Transparency reduced observable mobile conversions by 18 to 32%
  • Cookie deprecation is expected to impact 78% of existing attribution setups by 2026
  • These are structural signal losses that passive monitoring cannot compensate for

Why Reactive Attribution Monitoring Fails Here

In reactive marketing attribution analytics, failures are typically discovered in one of three ways:

  • A finance reconciliation shows GA4 revenue does not match backend sales
  • A channel’s ROAS inexplicably drops and someone investigates retroactively
  • A quarterly audit finds a campaign that has been running untagged for weeks

By the time any of these discoveries happen, the damage is already compounded:

  • Budget has been reallocated away from channels that were actually performing
  • Channels that looked strong were benefiting from misattributed credit
  • Leadership has made strategic decisions on a picture of performance that was never real

This is the 100x cost principle from Blog 1 applied directly to attribution. Finding a UTM tagging error before campaign launch costs almost nothing. Finding it six weeks later, after it has shaped budget decisions, costs orders of magnitude more.

What Proactive Marketing Attribution Analytics Looks Like

Proactive attribution monitoring does not wait for a finance discrepancy or a quarterly review to surface problems. It continuously watches the signals that indicate attribution is breaking, and flags them in near real-time.

1. Monitoring direct traffic spikes proactively.
  • A sudden, unexplained spike in direct traffic is almost always a symptom of attribution failure, not genuine behaviour change
  • Proactive marketing attribution analytics sets intelligent baselines for direct traffic by channel, device, and landing page
  • When direct traffic spikes beyond expected variance, an alert fires with context: which pages, which segments, and since when
  • The team investigates a tracking gap, not a phantom behaviour change
2. Validating UTM parameter coverage continuously.
  • Proactive systems scan incoming traffic for untagged or inconsistently tagged sessions in real time
  • When a campaign drives traffic with missing or malformed parameters, the monitoring layer flags it within hours of launch, not weeks after data has been permanently misfiled
  • This is where Tatvic’s data sanity automation plugs directly into attribution health
3. Detecting cross-domain tracking failures at the session level.
  • Proactive monitoring tracks session continuity across domain boundaries
  • When a known cross-domain journey starts producing sessions that reset at the transition point, a break in the tracking chain is flagged immediately
  • This is caught before it inflates direct traffic figures and before budget decisions are influenced by the distorted picture
4. Running anomaly detection on channel attribution patterns.
  • Proactive marketing attribution analytics uses anomaly detection not just on volume metrics but on attribution patterns themselves
  • When paid social’s share of conversion credit drops sharply over 48 hours without a corresponding spend change, that is an anomaly
  • When organic search suddenly claims attribution credit for conversions that previously traced to email, that is a signal worth investigating
  • Tatvic’s anomaly detection framework applies this logic to attribution data, not just traffic and conversion volume
5. Monitoring the GA4 data layer and GTM for tracking integrity.
  • Attribution in GA4 is only as reliable as the data collection layer beneath it
  • Tatvic’s AI-powered GTM health monitoring continuously checks that conversion tags, GA4 configuration tags, and event parameters are firing correctly
  • A misconfigured conversion tag does not just break conversion data. It breaks the entire attribution chain downstream

Signs That Your Attribution Has Already Broken

Run through this list quickly:

  • Direct traffic has grown as a percentage of conversions over the last 90 days without a clear explanation
  • Two or more channels show overlapping conversion credit for the same campaigns
  • GA4 revenue and backend/CRM revenue differ by more than 5% consistently
  • Your paid campaigns show ROAS figures your finance team cannot reconcile
  • A campaign launched in the last 60 days without a UTM audit before go-live
  • Your team has not tested the cross-domain tracking setup since the last site update.
  • You discovered a UTM error from a completed campaign only after reviewing its performance

If three or more of these apply, your marketing attribution analytics setup has active gaps. Each one is fixable, but only if detected before it compounds.

Where to Start with Proactive Attribution

The order of intervention matters. Starting with the wrong layer wastes effort and still leaves spend leaks open.

Step 1: Audit and automate UTM governance.
  • Standardise naming conventions across all channels and teams
  • Automate UTM generation where possible to eliminate manual errors
  • Add a pre-launch validation step to every campaign workflow

A formal UTM governance framework reduces tracking errors by 42% on average (Gartner 2024)

Step 2: Set anomaly detection on direct traffic and channel attribution shares.
  • These two signals catch the widest range of attribution failures
  • When either moves outside expected ranges, something in your tracking chain has broken
  • Intelligent, ML-driven alerts on these signals surface problems before data propagates into decisions
Step 3: Validate conversion and GA4 configuration tags continuously.
  • Attribution is downstream of data collection
  • A broken conversion tag disrupts attribution accuracy, regardless of how well you structure your UTMs.
  • Continuous monitoring of your GA4 tagging layer creates the foundation for reliable marketing attribution analytics.
Step 4: Reconcile GA4 attribution against a second source monthly.
  • Use your CRM, e-commerce backend, or media mix model as the comparison point
  • Regular reconciliation catches attribution drift before it becomes attribution blindness
  • Teams that build this into a monthly workflow catch errors an average of three weeks earlier than those that wait for discrepancies to surface in reporting

The Takeaway

Marketing attribution analytics is not a set-and-forget configuration. It is a living system that breaks in predictable, silent ways, and those breaks compound the longer they go undetected.

Proactive attribution monitoring does not add complexity to your stack. It adds:

  • A monitoring layer that watches for signals indicating your attribution chain is failing
  • Near real-time alerts that surface issues while there is still time to act
  • A foundation for budget decisions that are based on real performance data, not a distorted picture

The difference between reactive and proactive attribution is not just operational. It is the difference between a marketing budget allocated on truth, and one allocated on a fiction your reporting has been quietly telling you.

If your attribution is reactive today, the spend leaks have already started. The question is how long they go undetected.

Not sure if your attribution setup is telling you the truth? Tatvic’s analytics team can run a full attribution health check across your GA4 setup, GTM configuration, and UTM governance in one structured review. Schedule a call with Tatvic’s experts today.

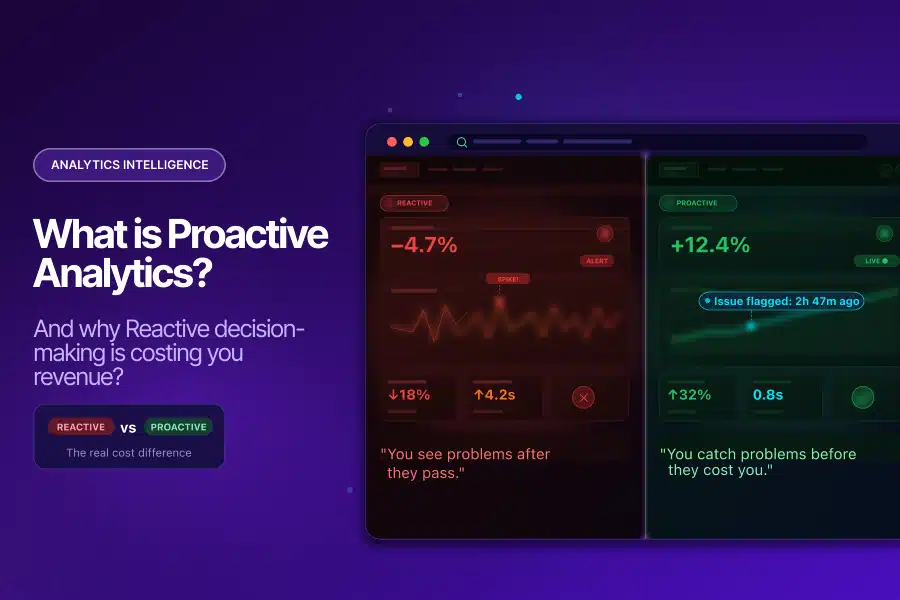
What Is Proactive Analytics And Why Reactive Is Costing You

Your analytics setup might be lying to you right now, and you will not know until it is too late.

Here is what that looks like in practice:

  • A tag fires incorrectly for two weeks, and no one notices
  • A conversion event starts doubling due to a misconfiguration
  • A campaign runs on corrupted attribution data for an entire month

None of these issues sends an alert. You find them when a stakeholder asks why the numbers look strange in a Monday morning review.

That is reactive analytics: discovering problems after they have already done their damage. Proactive analytics flips this model entirely, and in 2026, the cost of not making that switch is becoming impossible to ignore.

Why Reactive Analytics Is the Default (And Why That Is a Problem)

Most analytics teams are reactive by default. The pattern looks the same everywhere:

  • Check dashboards after the fact
  • Run audits on a quarterly schedule
  • Investigate issues only when someone notices something that looks wrong

This is not a failure of effort. It is a structural flaw in how traditional analytics is designed.

Traditional BI tools are fundamentally retrospective. They surface what happened, not what is currently going wrong. By the time a reporting lag resolves and data appears in your dashboard, a pipeline error has already propagated through your BigQuery tables, your attribution models, and every decision made from them.

The Financial Reality of Bad Data

The numbers make this hard to dismiss:

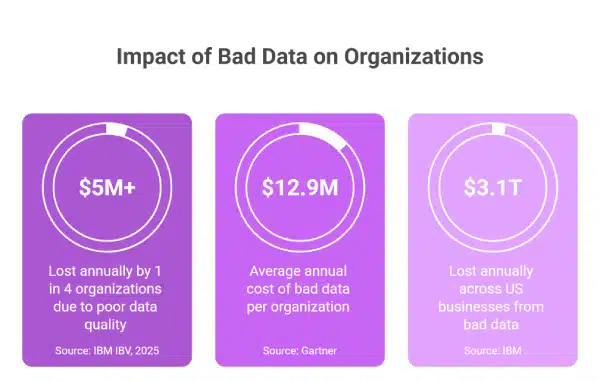
  • A 2025 IBM Institute for Business Value report found that more than a quarter of organizations lose over $5 million annually due to poor data quality
  • A Gartner study puts the average financial impact at $12.9 million per organization, per year
  • IBM’s broader research estimates that US businesses collectively lose $3.1 trillion annually from bad data.
These are not abstract figures. They represent:

  • Campaigns run on inflated conversion data
  • Budgets optimized against fabricated ROAS
  • Strategic decisions made from reports that were never accurate to begin with

The 1-10-100 Problem Nobody Talks About

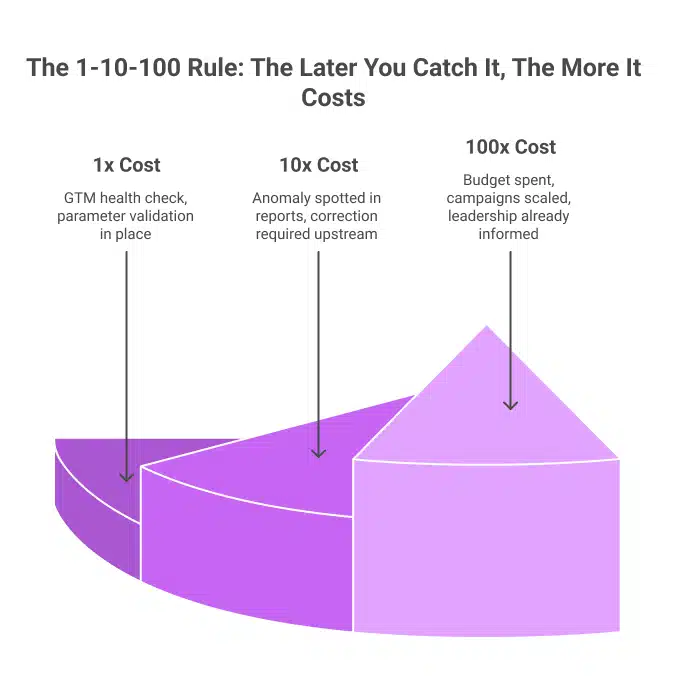
There is a well-documented principle in data management called the 1-10-100 rule:

  • 1x cost to fix a data quality issue at the point of entry
  • 10x cost to catch it midway through the pipeline
  • 100x cost once bad data has reached the decision-maker

Reactive analytics almost always catches errors at the 100x stage. An analyst notices something strange in a report, traces it upstream, and discovers the issue began weeks ago. By then:

  • Budget decisions have already been made
  • Campaigns have been scaled on false signals
  • The data that influenced those calls cannot be recovered
What Is Proactive Analytics?

Proactive analytics is an approach to data monitoring where issues are identified and flagged before they reach your reports and influence your decisions.

Instead of waiting for something to look wrong, proactive systems:

  • Continuously monitor your data streams
  • Learn what normal behavior looks like for your specific metrics
  • Alert your team the moment something deviates

This is meaningfully different from setting static alert thresholds in GA4. Static thresholds:

  • Miss anomalies that fall just below the trigger level
  • Generate false positives that cause alert fatigue
  • Cannot adjust for seasonal patterns or business cycles

True proactive analytics uses machine learning to:

  • Continuously learn the baseline behavior of every metric being monitored
  • Detect deviations that static rules would miss entirely
  • Alert teams in near real-time with context: what changed, by how much, and since when
  • Distinguish between genuine anomalies and normal variability, reducing noise

Why Reactive Analytics Is Getting More Dangerous

The complexity of modern digital measurement has grown considerably. The average marketing team now pulls data from 12 to 15 different sources: Google Ads, Meta, LinkedIn, CRM systems, email platforms, and analytics tools, each generating data in its own format, with its own quirks and failure modes. When these sources feed into a central analytics setup without automated quality checks, the result is not insight. It is noise disguised as insight.

Two dynamics are making this worse.

Data volume is outpacing human capacity. The global datasphere stood at over 147 zettabytes in 2024, with projections exceeding 175 zettabytes in 2025, according to IDC. No analytics team, regardless of skill, can manually monitor every metric, dimension, and event parameter at this scale. Reactive monitoring breaks down under this volume before it ever gets started.

AI tools are amplifying bad data. Organizations are investing heavily in AI-powered analytics, predictive models, and ML-driven attribution. However, AI trained on bad data produces bad outputs consistently. Research by Adverity found that CMOs estimate 45% of the marketing data their teams use is incomplete, inaccurate, or outdated. Nearly half the data feeding your AI models may be actively working against you.

What a Two-Week Detection Delay Actually Costs

Here is a scenario that Tatvic’s clients encounter more often than most would expect:

  1. A GTM misconfiguration causes purchase events to fire twice per transaction
  2. Conversion data doubles overnight
  3. ROAS looks exceptional, so the team scales the budget
  4. Two weeks later, a finance reconciliation reveals that the revenue numbers do not match
  5. The team traces the error back to the tag

Two weeks of corrupted data have already influenced budget allocation, campaign strategy, and leadership reporting. A same-day fix would have cost a fraction of the damage. This is not a hypothetical risk. It is the predictable outcome of reactive measurement.

What Proactive Analytics Looks Like in Practice

Shifting from reactive to proactive analytics does not require rebuilding your entire stack. It requires adding the right monitoring layer on top of what you already have.

Here is what the shift looks like in practice:

Reactive Proactive
Traffic drop found in the Monday review Anomaly alert fires within 3 hours
Conversion parameter error found in the quarterly audit Automated data sanity check flags it within 24 hours
GTM bloat discovered in annual performance audit Continuous GTM monitoring catches it as it builds
An analyst spends 4-6 hours running a GA4 audit Automated audit completes in minutes

The operational improvement is clear. Tatvic’s AI-powered GTM health monitoring is one example of how continuous intelligence replaces periodic manual review, catching tag conflicts, ghost tags, and container inefficiencies before they affect data collection or site performance.

Is Your Analytics Setup Reactive? Check These Signs

Run through this quickly:

  • Data issues are discovered in meetings, not in real-time alerts
  • GA4 audits happen quarterly or only when something looks wrong
  • Analysts spend more time validating data than analyzing it
  • There is a known discrepancy between your CRM and GA4 that has existed for more than two weeks
  • Your static threshold alerts either trigger daily (noise) or never trigger (blind spots)
  • Your GTM container has not been reviewed in over 90 days

If two or more of these are true, your analytics posture is reactive. Each gap maps directly to a specific capability within a proactive analytics framework.

Where to Start: A Practical Order of Operations

The most common mistake when shifting to proactive analytics is trying to monitor everything at once. A smarter approach is to start where the risk is highest and build outward.

Step 1: Secure data collection integrity first. Your entire analytics stack is only as reliable as the data coming in. Start with GTM health monitoring and automated data sanity checks to ensure what reaches GA4 is accurate before it is ever analyzed.

Step 2: Add anomaly detection on your highest-value KPIs. Revenue, purchase events, and primary acquisition sources are where a silent anomaly does the most damage. Intelligent, ML-driven monitoring on these metrics gives you early warning where it matters most.

Step 3: Build a response workflow. An alert without a playbook is just noise. Define who receives each alert type, what action is expected within the first hour, and how issues escalate. This is what turns proactive analytics from a monitoring tool into a business protection system.

The market is already moving in this direction. Grand View Research values the global predictive analytics market at $18.89 billion in 2024, projecting growth to $82.35 billion by 2030. The organizations driving that growth are not waiting for problems to show up in weekly reports.

The Takeaway

Reactive analytics is not a strategy. It is what happens when an analytics setup built for a simpler era meets the complexity of modern digital measurement. The volume of data, the number of sources, and the speed of decisions have all outpaced the pace of manual monitoring.

Proactive analytics does not demand a complete overhaul. It demands the right monitoring layer, the right alerting logic, and a team or partner who understands how to build them for your specific data environment.

Every analytics setup has issues. The question is whether you are finding them before or after they influence a decision that matters.

Not sure where your analytics setup sits on the reactive-to-proactive spectrum? Schedule a call with Tatvic’s analytics experts today!

The Real Cost of US Tech Hiring in 2026: What to Do About It

Every open technical role costs you $500 a day. The average hire takes 44 days. That is $22,000 gone before your new hire completes a single task. And in 2026, the talent market is not getting any easier.

The dedicated FTE model is how mid-sized US brands are breaking out of this cycle. Pre-vetted analytics and data talent, fully integrated into your team, at 40 to 70% of US hiring costs.

Here is the full picture, backed by tier-1 data.

The US Tech Talent Market Is at a Crisis Point

The scale of the problem is hard to overstate.

The Bureau of Labor Statistics projects the US developer shortage will exceed 1.2 million unfilled roles by 2026. IDC estimates that the global IT skills gap will result in $5.5 trillion in losses for organizations this year alone.

It is not just about numbers. It is about who is available to hire.

Robert Half’s 2025 Building Future-Forward Tech Teams report found that 87% of US tech leaders currently face challenges finding skilled talent. Another 76% say a tech skills gap is already visible inside their own departments.

  • 1.2M Unfilled US developer roles by 2026       -Bureau of Labor Statistics
  • $5.5T Projected global losses from the IT skills gap in 2026     -IDC
  • 87% US tech leaders are struggling to find skilled talent      -Robert Half 2025

Tech unemployment sits at just 2.8%, well below the national average of 4%. In practical terms, you are not hiring from a pool of available candidates. You are competing to pull employed workers away from other companies.

For mid-sized brands without the brand pull of Big Tech, that is a fight that is hard to win on salary alone.

The True Cost of a US Tech Hire Is Not the Salary

The multiplier most budgets miss

Base salary is just the starting point.

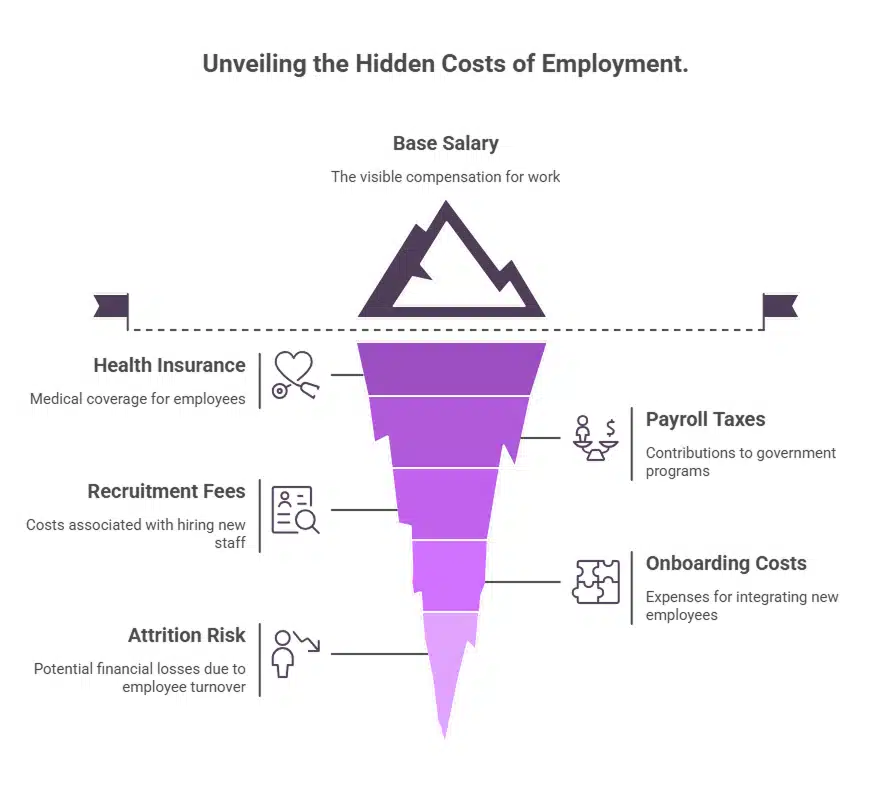
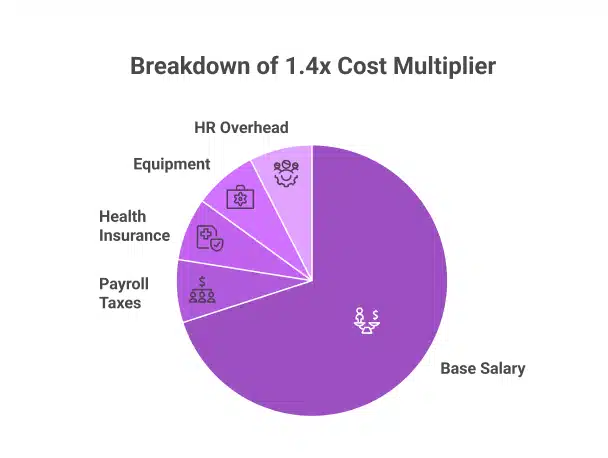
The U.S. Small Business Administration and SHRM confirm that the true annual cost of a US employee runs 1.25x to 1.4x their base salary, once payroll taxes, paid leave, equipment, software licenses, and HR overhead are factored in.

On a $120,000 base, that adds up to $48,000 in overhead before the hire completes their first sprint cycle.

Healthcare alone is a budget line

Mercer’s 2026 projection puts average employer health insurance at $17,496 per employee per year. For a five-person analytics team, that is $87,480 annually, purely in healthcare. That number is rising every year. (CompTIA 2025)

Median tech worker wage is 127% higher than the US national median wage. (Mercer 2026)

Employers pay an average of $17,496 per year in health insurance for each tech hire

If a hire leaves in year one, which Gartner data suggests is likely, given that only 29% of IT workers intend to stay long-term, you absorb every dollar again. Plus the cost to replace them.

Vacancy Is Not Neutral. It Costs $500 Every Day.

The daily drain

Deloitte’s Recruitment Efficiency Report puts the cost of an unfilled technical role at $500 per day in lost productivity, delayed projects, and increased load on existing team members.

SHRM benchmarks the average time-to-fill a technical position at 42 to 44 days.

At $500 a day over 44 days, that is more than $22,000 lost before a new hire clears onboarding.

Carrying three open roles through a standard 44-day cycle costs over $66,000 in vacancy losses alone, before a single recruiter invoice arrives.

It is getting worse, not better

One source tracking the 2026 hiring environment puts the average time to fill a senior engineering role at four to six months through traditional channels. Compensation has risen 12% since 2024, with median US developer salaries now above $130,000.

Top candidates are fielding multiple offers simultaneously. The window between posting a role and losing your preferred candidate to a faster-moving company has never been tighter.

Recruitment Overhead Adds Another $8,000 Before Day One

Most hiring budgets forget the cost of finding the candidate in the first place.

  • SHRM’s 2025 Benchmarking Report puts the national average cost-per-hire at $5,475 for non-executive roles
  • ScoutLogic’s 2025 analysis puts technical and engineering roles at $6,200 to $8,000, driven by candidate scarcity
  • For five analytics hires in a fiscal year, that is more than $35,000 in recruitment overhead alone

A single mis-hire restarts the entire clock. Every dollar spent, spent again.

Global IT Outsourcing Has Hit $660 Billion for a Reason

US companies have already voted with their budgets.

Global IT outsourcing spending reached $660 billion in 2025, up from $520 billion in 2023. Nearshore and offshore outsourcing grew 21% year-over-year in 2025 alone. Deloitte’s 2024 global survey found that 80% of executives planned to maintain or increase third-party talent investment, a trend that has held firm into 2026.

“The organizations that succeed are those that build inclusive systems and embrace the full potential of a global workforce.” - X-Team Global Talent Report, January 2026

The infrastructure has caught up with the ambition. Shared dashboards, real-time collaboration tools, and async-friendly workflows mean that a dedicated FTE in Ahmedabad can operate as a genuine part of your US team, not a distant vendor.

The savings are real and well-documented. Offshore talent hubs like India consistently deliver 40 to 70% cost savings compared to equivalent US hiring.

What a Dedicated FTE Model Actually Means in Practice

Not outsourcing. An extension of your team.

One named professional. Assigned exclusively to you. Not rotated across accounts or pulled off mid-sprint.

They attend your standups, used your tools and report to your leads.

  • Productive in 7 to 14 days, compared to the 42 to 180-day window of US hiring in 2026
  • Zero recruitment cost and zero payroll tax complexity
  • Pre-vetted expertise in your specific stack, with no skill discovery on your budget
  • Flat monthly billing with no surprise benefit surcharges
  • A managed replacement path if performance falls short

The accountability of an in-house hire. At a cost structure, mid-market brands can actually sustain.

Why Tatvic, and Why Now

Most FTE providers offer generalist talent. Tatvic is purpose-built for data and analytics teams.

Over a decade of client engagements has produced deep expertise across GA4, BigQuery, Looker Studio, and marketing data infrastructure. Every professional deployed through Tatvic’s FTE model has worked on real client projects, not internal training exercises.

Who benefits most in 2026

  • E-commerce and DTC brands scaling GA4 or CDP implementations
  • Mid-market companies that need senior analytics capacity without US salary overhead
  • Agencies expanding delivery without growing domestic headcount
  • Growth-stage companies where time-to-insight is a direct competitive advantage

The 12-Month Cost Comparison

Cost Category US Full-Time Hire (2026)
Base Cost $110,000 to $140,000
Health Insurance $17,496 (Mercer 2026)
Payroll Taxes and Benefits (1.4x) $44,000 to $56,000 extra
Recruitment Cost $6,200 to $8,000 (SHRM 2025)
Vacancy Loss $22,000 over a 44-day cycle
Attrition Risk High. Full cost restarts on exit.

Sources: SHRM 2025, Mercer 2026, Deloitte 2024, U.S. SBA, IDC, Robert Half 2025, Bureau of Labor Statistics

Over 12 months, a Tatvic FTE typically delivers 40% to 60% total savings versus the fully loaded cost of an equivalent US hire. That gap widens with every recruitment cycle avoided, and every attrition event eliminated.

Stop Absorbing Costs That Are Optional

The BLS projects 1.2 million unfilled tech roles in the US this year. IDC puts the financial damage at $5.5 trillion globally. Robert Half confirms 87% of tech leaders are already feeling it.

This is not a blip. It is a structural shift in where technical talent lives and what it costs to access it.

A dedicated FTE model gives you pre-trained, specialized professionals who work as part of your team. Transparent pricing. Up and running in two weeks. Savings from month one.

Tatvic’s model is built specifically for analytics, data engineering, and marketing technology teams in the US market.

See what a dedicated analytics FTE would cost your team in 2026.

Share your role requirements, and we will walk you through who would be assigned, how onboarding works, and what the monthly engagement looks like. No vague proposals. No sales pressure.

Book a consultation with Tatvic

Creative Intelligence in Marketing: Why Winning Creatives Don’t Scale

If Your Creative Worked Once… Why Can’t You Make It Work Again?

You launch a few creatives, and one clearly outperforms the rest. It drives higher clicks, better engagement, and stronger conversions. Naturally, you scale it, expecting similar results across audiences and campaigns.

But the performance doesn’t hold. The next iteration underdelivers, and what once seemed like a “winning creative” suddenly feels inconsistent. At that point, most teams go back to testing - new hooks, new formats, new variations - hoping to find the next winner.

The real issue isn’t the lack of testing. It’s the lack of clarity.

Most teams don’t actually know why the first creative worked. They only know that it did. And that distinction is what separates repeatable growth from inconsistent performance.

The Illusion of a “Winning Creative”

Marketing teams today are highly data-driven, but that data is often interpreted at a surface level. Performance is measured through metrics like CTR, conversions, engagement rates, and ROAS, and based on those numbers, a creative is labeled as “winning.”

This approach answers an important question: what performed better?
But it doesn’t answer the more critical one: what made it perform better?

That gap becomes visible when you try to scale. Without understanding the drivers behind performance, scaling becomes repetition rather than optimization. And repetition without context rarely produces consistent outcomes.

Why Performance Doesn’t Repeat

A creative is not a single variable. It is a combination of elements working together - messaging, visuals, structure, timing, and audience context. When a creative performs well, it’s usually because a specific combination of these elements aligns effectively.

However, when teams treat the creative as one unit, they miss that nuance. Any attempt to replicate it often changes key variables unintentionally. The hook might shift slightly, the audience might differ, or the context might change.

As a result, performance drops - not because the idea was flawed, but because the underlying drivers were never clearly understood.

This Isn’t a Data Problem. It’s a Clarity Problem.

Most organizations already have access to abundant data. Campaign dashboards, attribution tools, and analytics platforms provide detailed visibility into performance across channels and audiences.

But visibility alone does not create clarity.

As discussed earlier in the series, simply having access to data does not mean teams can instantly understand it. (Read more in What if you didn’t have to explore data to understand it?.)

Even today, most workflows rely on manual analysis - segmenting performance, comparing trends, forming hypotheses, and validating assumptions. This process is time-intensive and often inconsistent, especially when applied to creative performance.

What Creative Intelligence Actually Means

Creative intelligence goes beyond identifying high-performing creatives. It focuses on breaking down performance into meaningful components and understanding how each element contributes to outcomes.

Instead of evaluating an ad as a single unit, creative intelligence analyzes it at a granular level. It looks at how specific hooks, formats, tones, and calls-to-action influence engagement and conversion across different audiences.

This shift changes the core question teams ask. Instead of asking “Which ad worked?”, the focus moves to “What within this ad worked - and where else can we apply it?”

That is where optimization becomes intentional rather than reactive.

From Creatives to Patterns

When performance is analyzed at the element level, patterns begin to emerge. These patterns often remain hidden when looking only at campaign-level metrics.

For instance, certain messaging styles may consistently drive higher engagement among new users, while user-generated content formats may outperform polished creatives for specific segments. Similarly, emotional hooks may increase interaction, but not always lead to conversions.

These are not isolated observations. Over time, they form repeatable patterns that can be applied across campaigns. This is what turns creative performance from unpredictable outcomes into structured insights.

Why This Matters More Than Ever

The importance of understanding creative drivers has increased significantly in recent years. Marketing environments are more dynamic, audiences are more fragmented, and content fatigue sets in faster.

At the same time, expectations around personalization continue to rise. According to McKinsey & Company, 71% of consumers expect personalized experiences, yet most brands struggle to deliver them consistently.

The gap exists because personalization is often applied at a superficial level. Without understanding what truly resonates with different audience segments, personalization becomes difficult to scale effectively.

Creative intelligence addresses this by linking content patterns directly to audience response, making personalization more actionable and less dependent on guesswork.

Why Traditional Workflows Break at Scale

Most creative workflows follow a familiar cycle: launch, measure, identify a winner, and scale. While this approach works in controlled scenarios, it begins to break down as complexity increases.

Modern campaigns operate across multiple channels, audiences, and formats. Each variable introduces additional layers of complexity, making it harder to isolate what actually drives performance.

As highlighted earlier in the series, analytics systems today are largely built for investigation rather than real-time understanding (explored in Analytics today is built for investigation-not detection).

This limitation extends to creative analysis as well. By the time insights are derived, the opportunity to act on them has often passed.

How Agentic AI Enables Creative Intelligence

This is where agentic AI changes the equation. Instead of relying on manual analysis, it continuously evaluates creative performance at a deeper level and connects multiple data points in real time.

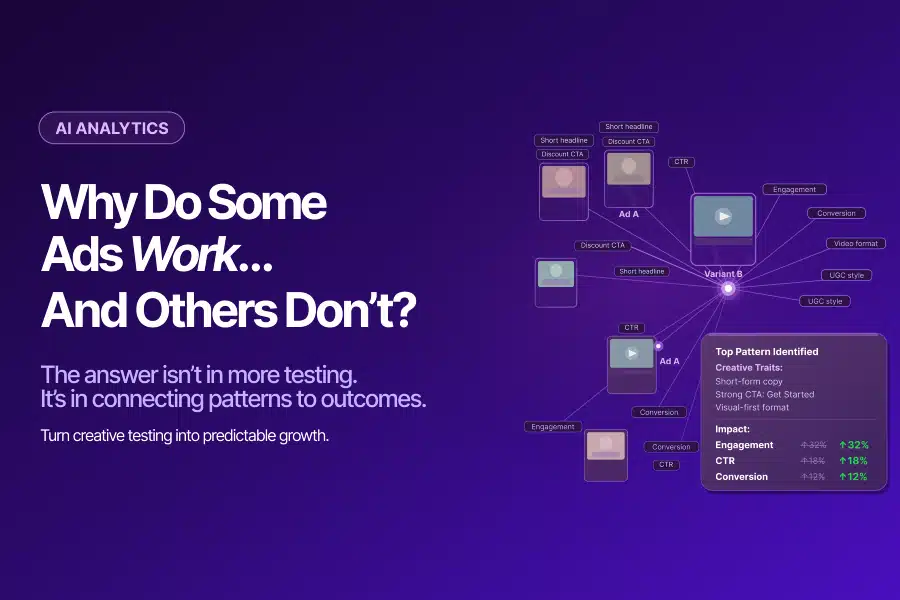
Rather than focusing only on outcomes, it links creative elements to performance signals and identifies patterns across campaigns. It breaks down creatives into components such as hooks, visuals, messaging, and calls-to-action, and maps each component to engagement and conversion metrics.

Over time, this creates a structured understanding of what drives performance. Instead of isolated campaign insights, teams gain access to reusable patterns that can be applied across contexts.

This shift transforms the workflow. Teams no longer start with exploration. They start with insight - clear, contextual, and actionable.

What Gets Measured &Why It Changes Decisions

To support this approach, measurement frameworks need to evolve beyond campaign-level metrics. Creative intelligence introduces new dimensions of analysis that focus on element-level performance.

This includes evaluaitng:

  • Which hooks capture attention
  • Which messaging resonates with specific audience segments
  • Which formats perform best across different channels
  • How individual creative elements contribute to overall outcomes

By shifting measurement to this level, teams move from observing performance to understanding it. Decisions are no longer based solely on outcomes but on the drivers behind those outcomes.

From Testing More to Learning Faster

Many teams believe that increasing the number of tests will lead to better performance. While experimentation is important, the real advantage lies in how quickly teams can learn and apply insights.

Creative intelligence shortens this cycle by making insights more accessible and actionable. Instead of running multiple tests without clear direction, teams can focus on refining elements that are already proven to work.

According to McKinsey & Company, organizations that effectively use data and AI in marketing can improve ROI by 20-30%. These improvements are not driven by more testing alone, but by faster and more informed decision-making.

The Compounding Impact of Understanding

The benefits of creative intelligence extend beyond individual campaigns. Over time, every campaign contributes to a growing repository of insights.

These insights do not remain isolated. They compound.

As a result, future campaigns start with a stronger foundation. Testing cycles become shorter, performance becomes more predictable, and resource allocation becomes more efficient.

This is where marketing shifts from reactive execution to strategic optimization.

The Role of Human Creativity

Despite the increasing role of advanced analytics, human creativity remains central to the process. Creative intelligence does not replace human judgment; it enhances it.

By providing clearer insights, it allows teams to focus on strategy, storytelling, and innovation rather than spending time on repetitive analysis. Teams still define the narrative and direction, but they do so with greater confidence and clarity.

This combination of human creativity and structured insight leads to more effective outcomes.

The Real Shift in Marketing Analytics

Analytics has already evolved significantly over the years. It has moved from enabling basic measurement to providing deeper visibility into performance.

Now, it is entering a new phase - one that focuses on understanding.

Instead of simply showing what happened, analytics is beginning to explain why it happened. When this capability extends to creative performance, it unlocks a new level of optimization.

Performance is no longer reactive. It becomes repeatable.

Closing Thought

If your team is still scaling “winning creatives” without understanding why they worked, the problem isn’t execution - it’s insight.

Repeating outcomes without understanding their drivers leads to inconsistent performance and missed opportunities. Over time, this creates inefficiencies that are difficult to measure but expensive to sustain.

The real advantage today lies in understanding what drives engagement and conversion at a deeper level. When that understanding becomes part of your workflow, you move from guessing what might work to confidently applying what already does.

That is the difference between testing for results and building for repeatable growth.

Landing Page Optimization in 2026 Has Two Audiences. Most Brands Are Only Optimizing for One.

Right now, a shopper is asking ChatGPT to find the best running shoes under $120. Another is asking Perplexity to compare skincare serums for sensitive skin. A third is asking Google’s AI Mode to build a sustainable gift set under $80.

Your brand either shows up in those answers or it doesn’t.

This is the new reality of landing page optimization. And most e-commerce teams are only solving half the problem. They’re building pages for humans who arrive. They’re not building pages for the AI systems that decide whether to send those humans in the first place.

That gap is where revenue is being lost right now.

The Funnel Has a New Front Door

For two decades, e-commerce started with Google. You optimized keywords, earned backlinks, bought ads, and drove traffic to your pages. The playbook was consistent, well-understood, and it worked.

That formula is breaking down faster than most teams realize.

McKinsey‘s AI Discovery Survey found that 50% of consumers now use AI when searching online. Among those who’ve tried it:

  • 44% say AI has become their primary way to search
  • Only 31% still prefer traditional search

This isn’t a slow, gradual shift. It’s already the majority behavior among high-intent, high-spending shoppers, exactly the audience ecommerce brands work hardest to reach. These are people with purchase intent who are actively looking for product recommendations, comparisons, and trusted sources.

Gartner‘s forecast: Traditional search engine volume will drop 25% by 2026 as AI chatbots take over queries that once ran through Google and Bing. Their analyst put it plainly: companies will need to rethink their entire marketing channel strategy as generative AI becomes embedded across every aspect of commerce.

Organic Traffic Is Already Sliding

BCG‘s research adds an uncomfortable reality check for brands still focused entirely on traditional SEO:

  • Nearly 10% of businesses are already seeing year-over-year organic traffic decline
  • Traditional organic search traffic in the US is falling at roughly 10% annually
  • Traffic to retail sites from generative AI sources grew 4,700% year over year in July 2025 alone

That last number isn’t a trend to watch. It’s a signal that landing page optimization now means something fundamentally different than it did 12 months ago. The channel driving the fastest growth in qualified e-commerce traffic is AI.

Brands still treating landing page optimization as a purely human-facing discipline are optimizing for a shrinking pool of traffic while the fastest-growing pool passes them by.

Your Landing Page Now Serves Two Audiences

Here’s what most ecommerce teams haven’t fully processed yet.

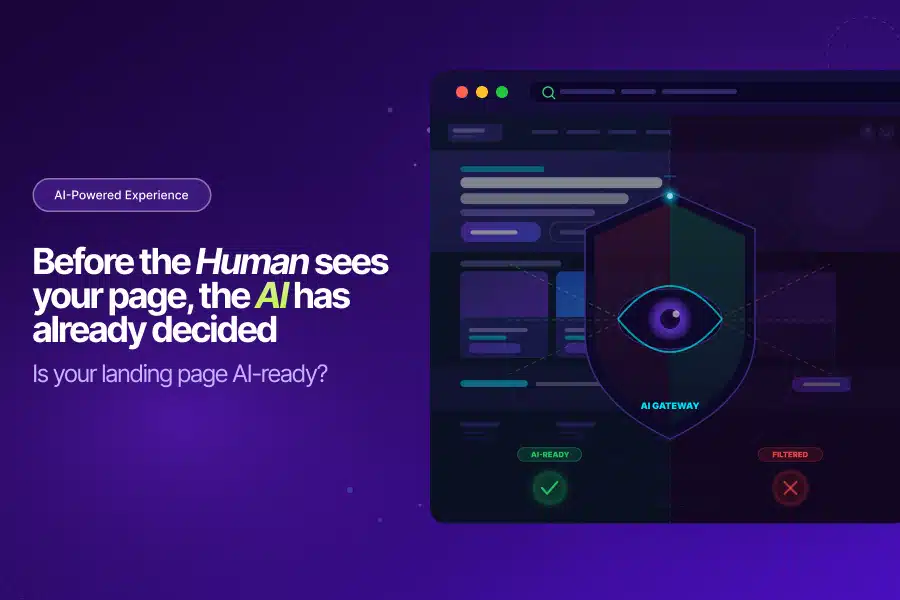
When a consumer asks an AI assistant to recommend a product, the AI doesn’t just Google it. It pulls together information from your product pages, your reviews, your structured data, third-party citations, forums, and comparison sites. It evaluates credibility, consistency, and clarity.

Then it decides whether your brand belongs in the answer.

That decision happens before any human ever lands on your page.

As McKinsey puts it: “In an agentic world, your customer may no longer be a human with a browser; it is just as likely to be an autonomous agent, acting on that customer’s behalf.”

This means landing page optimization in 2026 has two distinct jobs:

Job What It Means
Job 1 Convert the human who arrives
Job 2 Be clear, trustworthy, and recommendable to the AI that decides to send them

Most brands are doing Job 1 reasonably well. Job 2 is almost entirely ignored, which means the AI gatekeeping the recommendation never sends the human in the first place.

What the Second Job Actually Requires

Deloitte’s 2025 Digital Media Trends puts it plainly:

“We are moving away from optimising for clicks and toward optimising for understanding. When an AI system generates a response, it draws on content it can interpret and trust.”

Effective landing page optimization for AI audiences requires a specific set of structural changes most brands haven’t made yet:

  • Rich product schema and clean metadata
  • Descriptive content that language models can actually parse
  • Consistent, current information across all channels
  • FAQ content that answers real shopper questions
  • Pricing, delivery windows, and return policies in machine-readable formats
  • Third-party citations and review signals that establish credibility

Deloitte is specific about why this matters: metadata, taxonomy, and signals of expertise now play a significant role in whether a brand’s content gets surfaced accurately by AI systems. This isn’t optional polish; it’s the foundation of landing page optimization for the current environment.

Brands that skip this work don’t just miss an optimization opportunity. They become invisible to the fastest-growing discovery channel in ecommerce history.

What AI Agents Look for When Comparing Products

When AI agents compare products on a shopper’s behalf, BCG’s research shows they rely on a narrow and specific set of signals:

  1. Price - Is it clearly visible and machine-readable?
  2. Reviews - Are aggregated scores structured and prominently surfaced?
  3. Delivery speed - Is the fulfilment window stated explicitly?
  4. Return policy - Is it clear, accessible, and easy to parse?

Brands whose landing page optimization surfaces all four signals in structured, machine-readable formats have a clear structural advantage over brands presenting the same information in ways only humans can interpret.

This is not a one-time technical fix. It’s an ongoing discipline. Every product page, FAQ section, and comparison document needs to be structured for AI comprehension, not just human readability. As your inventory, pricing, and policies change, those updates need to flow consistently across every channel where AI systems might pull your information.

Why This Matters for Your Revenue

The commercial case for better landing page optimization is now impossible to ignore.

Adobe Analytics studied over a trillion visits to US retail sites during the 2025 holiday season. Shoppers arriving from generative AI assistants significantly outperformed every other traffic source:

Metric AI-Referred Shoppers
Conversion rate +31% vs all other traffic
Thanksgiving conversion +54%
Black Friday conversion +38%
Bounce rate 33% lower
Time on site 45% more
Pages viewed per visit +13%

Revenue per visit from AI-referred shoppers increased 254% year over year during the 2025 holiday season. That’s not a rounding error. That’s a different category of visitor entirely, one that only arrives if your landing page optimization has done the work of earning the AI recommendation upstream.

The Highest-Intent Traffic on the Internet

Salesforce data reinforces the same story from a different angle.

In the first six months of 2025, conversion rates from AI channels were 700% higher than traffic referred from social media. That puts AI-referred traffic in its own category, more intent-loaded than paid search, more purchase-ready than any other digital acquisition channel currently available.

These visitors didn’t stumble onto your site. They arrived because an AI system evaluated your brand, found it credible and relevant, and recommended it by name. They came pre-qualified.

Proper landing page optimization is what earns that recommendation in the first place. Without it, the pre-qualification never happens, and the high-intent visitor never arrives.

The Stakes Are $5 Trillion

McKinsey’s agentic commerce report, published in October 2025, laid out what’s commercially at stake globally:

  • AI agents could mediate $3-5 trillion in global consumer commerce by 2030
  • US B2C retail alone could see up to $1 trillion in AI-orchestrated revenue

Their framing was deliberate: “This is not just an evolution of e-commerce. It’s a rethinking of shopping itself.” They compare this transition to the web and mobile revolutions and project that it will move faster than either one did.

How Much Time Do You Actually Have?

Deloitte’s Agentic Commerce research puts a concrete deadline on the urgency:

  • 63% of global retailers believe companies without an AI strategy will fall behind within two years
  • By 2030, 55% of digital consumers will start product research on LLM platforms
  • 25% of global e-commerce sales will be enabled by AI agents by 2030

Brands investing in landing page optimization for AI audiences now are locking in positions in the recommendation layer that will be hard for slower competitors to displace.

BCG’s research makes the compounding effect explicit: once a brand becomes an established, authoritative source that AI systems trust and cite, it tends to get cited more often, creating a visibility advantage that grows over time. Brands waiting for this to be “fully proven” before acting will find those positions already taken.

One Page. Two Audiences. One Strategy.

Here’s the good news: optimizing for AI agents and optimizing for human visitors are not competing priorities. They reinforce each other.

The same qualities that make a page convert real people are the qualities that earn AI recommendations:

  • Clear, well-structured product information
  • Honest reviews surfaced prominently
  • Transparent delivery and return policies
  • FAQ content that answers real questions shoppers actually ask

Effective landing page optimization in 2026 doesn’t mean choosing between SEO and AIO. It means treating both as one coherent strategy: get found before the visit, convert after it.

Your Quick Action Checklist

Before your next product launch, run your landing page against these questions:

[ ] Is pricing visible in a machine-readable format?

[ ] Does the page include FAQ schema for common shopper questions?

[ ] Is the delivery window and return policy explicitly stated?

[ ] Is product metadata consistent across all channels?

[ ] Are credible third-party sources citing or reviewing this page?

If you answered no to two or more, your landing page optimization is only serving one of your two audiences and leaving the highest-converting traffic source on the table.

Ready to Close the Gap?

The brands winning in 2026 aren’t choosing between old and new. They’re doing both with infrastructure built for both audiences from the ground up.

Tatvic works with e-commerce brands to close the gap between traffic and revenue through agentic AI-powered landing page optimization and customer experience strategy.

Curious what your current pages are leaving on the table? Let’s find out.

AI Analytics: Why Most Teams Discover Problems Too Late

Marketing analytics has evolved significantly over the past decade. Today, teams have access to detailed dashboards, multi-channel attribution models, and near real-time reporting capabilities. Campaign performance, user journeys, and conversion metrics are no longer hidden behind fragmented systems-they are visible, measurable, and accessible at scale.

Yet despite this progress, one persistent problem continues to impact marketing performance.

Teams can see what is happening.
But they often realize what changed far too late to act effectively.

This gap between data visibility and timely awareness is where most inefficiencies in modern analytics systems originate. And in performance-driven environments, this delay does not just affect reporting-it directly affects revenue outcomes.

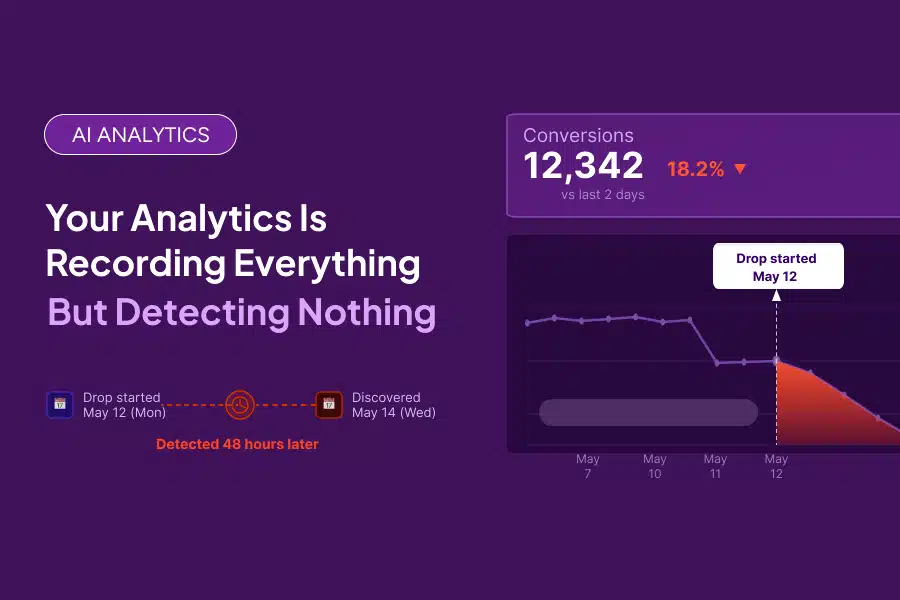
This is precisely where AI analytics is beginning to redefine how analytics systems operate. Instead of simply enabling access to data, AI analytics focuses on detecting meaningful changes as they happen and enabling faster decision-making.

Analytics Today Is Built for Investigation, Not Detection

Most analytics platforms in use today-whether it is Google Analytics 4, Adobe Analytics, or similar tools-are fundamentally designed for exploration. They are highly effective at organizing data, enabling segmentation, and allowing teams to analyze performance across multiple dimensions.

However, they are not designed to proactively identify what matters most.

In practice, this means that analytics systems function more like repositories of information rather than active intelligence layers. They store and present data, but they do not interpret it in a way that prioritizes immediate action.

As a result, teams rely heavily on manual workflows.

A marketer logs into a dashboard, reviews key metrics, compares trends, and tries to identify whether something has changed. This process is repeated daily or weekly, depending on the team’s operating rhythm.

The limitation here is subtle but critical.

Performance changes do not occur when dashboards are checked.
They occur continuously.

And this disconnect creates a delay between when an issue arises and when it is discovered.

This limitation is explored further in: What if you didn’t have to explore the data?

The Real Problem: Detection Lag

To understand the impact of this gap, it is important to look at how detection typically happens in real-world workflows.

Consider a common scenario. A campaign begins to underperform due to a change in bidding strategy, audience targeting, or external market conditions. The decline is not immediately obvious-it happens gradually over a few hours or a day.

Since no alert is triggered, the issue remains unnoticed.

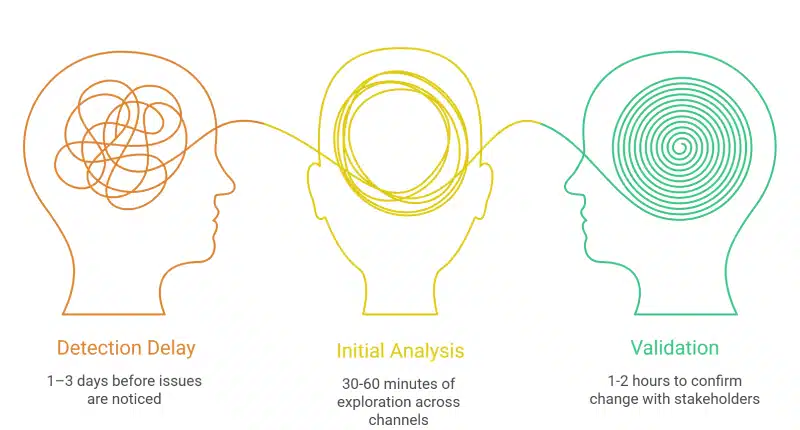
It is only during a routine dashboard check-often one or two days later-that someone notices a dip in performance. At this point, the team begins investigating the issue, analyzing trends, and validating whether the change is significant.

By the time corrective action is taken, the impact has already occurred.

Budget has been spent inefficiently.
Conversions have declined.
Opportunities for early optimization have been missed.

This is what is referred to as detection lag.

And it is one of the most overlooked sources of inefficiency in marketing analytics.

Detection lag is not just a delay in awareness. It is a delay in action-and that delay has compounding consequences.

This is the core problem that AI analytics is designed to address.

Why Traditional Analytics Workflows Break at Scale

As marketing systems grow more complex, the limitations of manual analytics workflows become more pronounced.

Modern marketing environments involve multiple channels, campaigns, audience segments, and data streams. Each of these variables introduces additional layers of complexity, making it increasingly difficult to identify meaningful changes quickly.

In such environments, manual analysis does not scale effectively.

Teams are required to:

  • review multiple dashboards
  • segment data across dimensions
  • identify patterns manually
  • validate findings across tools

This process is not only time-consuming but also prone to inconsistency. Different team members may interpret the same data differently, leading to delays in decision-making.

More data does not simplify decision-making. Without the right systems, it increases the effort required to reach clarity.

This is where the role of AI analytics becomes critical.

The Hidden Metric Most Teams Ignore: Time-to-Detection

While marketing teams are highly focused on performance metrics such as conversion rate, return on ad spend (ROAS), and customer acquisition cost (CAC), very few track a metric that directly influences all of them.

That metric is time-to-detection.

Time-to-detection refers to the duration between when a performance change occurs and when it is identified.

This metric is critical because it determines how quickly corrective action can begin.

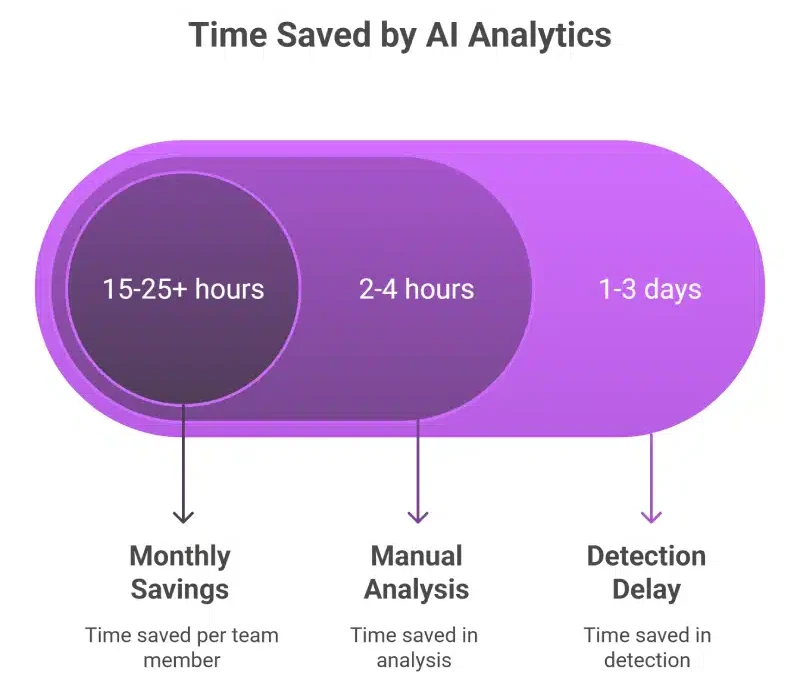
A delay of even 24-48 hours can significantly impact performance, especially in high-spend environments. During this time, underperforming campaigns continue to consume budget, and high-performing opportunities remain under-optimized.

According to Gartner, organizations often fail to fully leverage their analytics investments due to delays in insight generation and inefficient data utilization.

This highlights an important reality.

The challenge is not a lack of data.
It is the inability to act on data at the right time.

AI Analytics: Shifting from Passive Data to Active Intelligence

AI analytics introduces a fundamental shift in how analytics systems operate.

Instead of relying on users to explore data and identify issues, AI analytics continuously monitors performance metrics and detects anomalies automatically. It evaluates data in real time, compares it against historical patterns, and identifies deviations that require attention.

This transforms analytics from a passive system into an active intelligence layer.

With AI analytics, teams are no longer dependent on manual checks. Instead, they receive timely insights that highlight what has changed, where the change has occurred, and why it matters.

This shift significantly reduces the time required to move from data observation to decision-making.

What AI-Powered Analytics Looks Like in Practice

To understand the practical impact of AI analytics, it is helpful to compare how workflows operate with and without it.

Without AI Analytics

A retail brand running multiple campaigns experiences a gradual decline in conversions due to a change in bidding strategy. The decline begins on a Monday but goes unnoticed because there are no alerts.

By Wednesday, the team notices a drop during a routine dashboard review.

They begin analyzing:

  • campaign performance
  • channel-level data
  • device segmentation
  • geographic trends

After spending considerable time exploring the data, they identify the root cause and take corrective action.

By this time, two to three days of inefficient spend have already occurred.

With AI Analytics

In the same scenario, AI analytics detects the anomaly on Monday itself.

The system identifies that the performance deviation is outside expected patterns and surfaces an insight such as:

“Conversions have dropped by 15%, primarily driven by Paid Search. The decline is linked to recent changes in bidding strategy and exceeds expected variance.”

The team receives this insight immediately and can act within hours.

The difference is not just operational efficiency-it is financial impact.

Pain Points vs Outcomes: A Clear Contrast

Without AI analytics, teams experience:

  • delayed awareness of performance issues
  • significant time spent on manual analysis
  • reactive decision-making
  • increased risk of wasted budget

With AI analytics, teams benefit from:

  • near real-time detection of anomalies
  • reduced dependency on manual workflows
  • faster and more confident decision-making
  • improved campaign stability and efficiency

This contrast highlights why AI analytics is not just an enhancement but a necessity for modern marketing systems.

The Measurable Business Impact of AI Analytics

The impact of AI analytics can be quantified across multiple dimensions.

Research from McKinsey & Company indicates that organizations using AI in marketing can achieve improvements of up to 20-30% in ROI.

Similarly, Deloitte highlights that AI-driven organizations are able to respond more quickly to market changes and operate with greater efficiency.

These improvements are driven by:

  • reduced detection delays
  • faster decision-making cycles
  • more efficient allocation of resources

Over time, these benefits compound, leading to sustained improvements in marketing performance.

Why This Gap Is Becoming More Expensive

As marketing systems become more dynamic, the cost of delayed detection continues to increase.

Automation, real-time bidding, and multi-channel strategies amplify the impact of even small inefficiencies. If a system reacts late, it continues to execute outdated strategies, leading to further performance decline.

This makes AI analytics a foundational capability rather than an optional enhancement.

Organizations that adopt it early gain a significant advantage in terms of speed, efficiency, and performance consistency.

AI Analytics and the Evolution Toward Agentic AI

AI analytics plays a critical role in enabling more advanced systems such as Agentic AI.

While AI analytics focuses on detecting and interpreting changes, Agentic AI extends this capability by enabling automated actions based on those insights.

Together, they create a continuous loop:

  • detection
  • interpretation
  • execution

This evolution is explored further in: Marketing decision speed with AI Analytics

The Cost of Waiting

One of the most overlooked aspects of analytics transformation is the cost of inaction.

Organizations often delay adopting new approaches because existing systems appear to function adequately. However, this delay results in repeated inefficiencies over time.

Each campaign cycle without AI analytics introduces:

  • avoidable performance losses
  • repeated manual effort
  • missed optimization opportunities

These costs are not always visible in a single report, but they accumulate over time.

The real cost is not the problem itself. It is how long it continues before being addressed.

Moving from Insight to Action

Recognizing the gap is only the first step.

The next step is quantifying its impact and identifying where improvements can be made.

Tools such as:

can help organizations evaluate the potential benefits of adopting AI analytics and determine their readiness for implementation.

This shifts the conversation from theoretical value to measurable impact.

Conclusion

The evolution of analytics is no longer about improving visibility.

It is about improving responsiveness.

The ability to detect and act on changes quickly is becoming a key differentiator in marketing performance.

AI analytics enables this shift by transforming analytics systems from passive reporting tools into active intelligence layers.

And as marketing environments continue to evolve, this capability will become essential for organizations looking to maintain a competitive edge.

Landing Page Personalization: Stop Paying for Traffic That Bounces

Your Landing Page Is the Hole in the Ecommerce Bucket; And You Keep Filling From the Top

Let’s skip the part where I tell you ecommerce is growing fast and the market is huge.

You know that. You’re in it.

What you might not have stared at long enough is this: Baymard Institute pulled together 48 independent studies on shopping behavior and found that the average cart abandonment rate in 2025 sits at 70.19%. Seven out of ten people who got close enough to buy, close enough to add something to a cart, didn’t. And Baymard’s own modelling says that better page and checkout design could recover $260 billion in lost orders every year across US and EU ecommerce.

Not new customers. Not bigger ad budgets. Better pages.

That’s the part most brands don’t want to look at, because it means the problem isn’t outside, it’s inside. The traffic isn’t failing you. Your landing page is.

Nobody Wants to Feel Like They Landed on the Wrong Page

Here’s what actually happens when someone clicks your ad.

They arrive with a specific thought in their head. Maybe they were looking for a particular product. Maybe they’re a return visitor who already knows your brand and just needs one more nudge. Maybe they’re completely new, skeptical, and need a reason to trust you in about four seconds. Whatever the case, they arrive as a specific person, with a specific context and a specific need.

And most of the time, your landing page ignores all of that.

Same headline for everyone. Same hero image. Same generic “Shop Now” button. It’s a page built for the average visitor, which, in practice, means it’s built for nobody, because nobody thinks of themselves as average.

McKinsey put some real numbers on what this costs. Their Next in Personalization research found that 71% of consumers expect personalized interactions from the brands they buy from. And 76% get frustrated when that doesn’t happen. They don’t write angry emails. They just leave. And they don’t come back.

What’s quietly devastating about that statistic is the other side of it. The same McKinsey research found that 76% of consumers said personalized communications were a key factor in whether they even considered a brand. Not whether they liked the brand. Whether they considered it in the first place. And 78% said personalized content made them more likely to repurchase.

So personalization isn’t just about squeezing a few extra points of conversion rate. It’s about whether you’re in the consideration set at all - and whether the people who do buy come back.

The Gap Between What Brands Think They’re Doing and What Customers Actually Experience

There’s a Salesforce stat that I find weirdly uncomfortable every time I read it.

Their State of the Connected Customer report found that 66% of customers expect brands to understand their needs and preferences. Fine. Brands know this. They talk about it in every strategy deck. But here’s the part that stings: only 34% of those customers believe brands actually deliver on it.

Two-thirds of your shoppers arrive expecting to feel understood. Fewer than half of them do.

And this isn’t just a feelings problem - it’s a revenue problem. Gartner’s 2024 CMO Spend Survey found that 22% of marketing organizations reported gaps in their digital commerce capabilities that were actively preventing them from hitting business goals. That number was 14% the year before. The gap isn’t closing. It’s widening - even as brands pour more money into driving traffic to those same underperforming pages.

More traffic into a leaking funnel doesn’t fix the leak. It just makes it more expensive.

What Actually Happens When You Fix It

Okay, so personalization matters. That’s not a controversial take anymore. The more useful question is: how much does it actually move the needle, in terms brands can take to a CFO?

McKinsey’s data on this is pretty consistent. Personalization, when it’s executed well, not just “we put your first name in the email” but genuinely tailored experience, drives 10-15% revenue lift on average, with some companies seeing up to 25%. It can cut customer acquisition costs by up to 50%. It increases marketing ROI by 10-30%.

BCG went bigger in their 2024 research. They found that brands leading on personalization are growing revenue roughly 10 percentage points faster than their peers, and they’re positioned to capture $570 billion in incremental retail growth by the end of the decade. Not a slice of existing revenue. New revenue that will go to whoever earns it.

There’s also the retention angle, which tends to get underweighted in conversion-focused discussions. Bain & Company’s research, the work that essentially defined how the industry thinks about customer loyalty, established that a 5% improvement in customer retention can lift profits by 25-95%. That’s not a typo. The range is wide because it depends on sector, but the direction is always the same: keeping customers is dramatically more profitable than finding new ones.

And the bridge between acquisition and retention runs directly through the landing page experience. If someone’s first visit feels generic, there may not be a second one.

So Why Isn’t Everyone Already Doing This?

Honestly? Because personalization at scale is hard, or at least it was, until recently.

You can manually build five landing page variants. You can test two headlines against each other. But you can’t manually create a tailored experience for every meaningful combination of traffic source, device type, behavioral history, geographic context, and purchase intent signal. There are too many variables and not enough hours in any team’s day.

This is the gap that agentic AI is specifically designed to close.

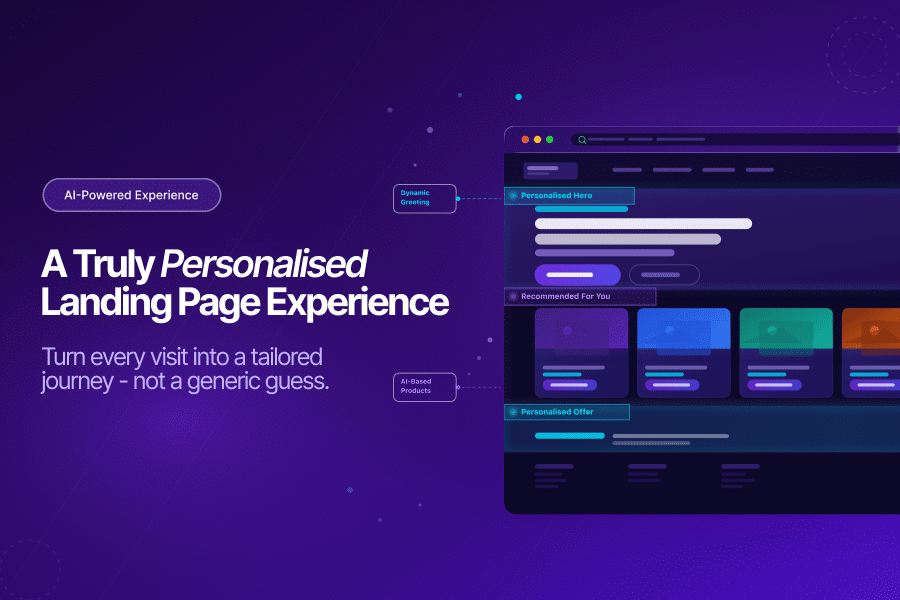
Agentic AI doesn’t just analyze data and produce a recommendation for a human to act on. It reads signals in real time and acts, adjusting what a visitor sees based on who they are, where they came from, what they’ve done before, and what they’re most likely to respond to. It’s the difference between a one-size-fits-all storefront and a page that actually meets each visitor where they are.

Deloitte’s research on this is fairly direct. 63% of global retailers now believe that companies without AI agents will fall behind competitors within two years. Not eventually. Two years. McKinsey frames the commercial upside just as plainly: agentic AI could generate up to $1 trillion in US B2C ecommerce revenue by 2030, with global projections of $3-5 trillion.

These numbers are big enough to feel hypothetical. Here’s something more concrete. During the 2025 holiday season, Salesforce and Adobe tracked AI-influenced shopping driving 20% of all retail sales globally, generating $262 billion in revenue through personalized recommendations and engagement. That wasn’t a forecast. That was last November and December.

What This Looks Like in Practice

It might help to talk about what actually changes when a brand takes landing page personalization seriously.

ASOS applied machine learning to customize product listings and landing pages for individual visitors, specifically for return customers who already had behavioral history. The result was a 13% lift in conversion rate. Not from more traffic. Not from a redesign. From showing the right visitor the right page.

Bain & Company cites Sephora as the clearest benchmark for what loyalty-driven personalization looks like at scale. Sephora combines purchase history, real-time browsing behavior, and individual preference data to personalize homepage content and product recommendations for every loyalty member, online and in-store. It works because the experience feels continuous. It remembers you. It knows what you like. It doesn’t show you things that have nothing to do with you.

That’s the standard shoppers are starting to hold all brands to. Not just luxury or beauty. All brands.

The Real Cost Is Waiting

Here’s a question worth sitting with.

If 70% of the shoppers hitting your landing pages right now are leaving without converting - and McKinsey says personalization drives 10-15% revenue lift while cutting acquisition costs in half, what does another quarter of inaction actually cost you?

Run the math on your own numbers. Take your monthly traffic. Apply a 70% abandonment rate. Then apply a 10-15% lift from better personalization. The number you get is the revenue you’re currently not capturing from traffic you’re already paying for.

The personalization gap is real, it’s measurable, and it’s solvable. Agentic AI means it’s no longer a question of whether brands can deliver personalized landing experiences at scale; it’s a question of whether they choose to.

The ones choosing to are building a compounding advantage. The ones waiting are paying for traffic that keeps bouncing.

Tatvic works with brands to close the gap between traffic and revenue through agentic AI-powered landing page personalization and customer experience optimization. If you want to talk about what your current pages are leaving on the table, we’re happy to dig in.

AI Analytics in Marketing: What If You Didn’t Have to Explore Data to Understand It?

AI Analytics in Marketing: The Missing Layer Between Data and Action

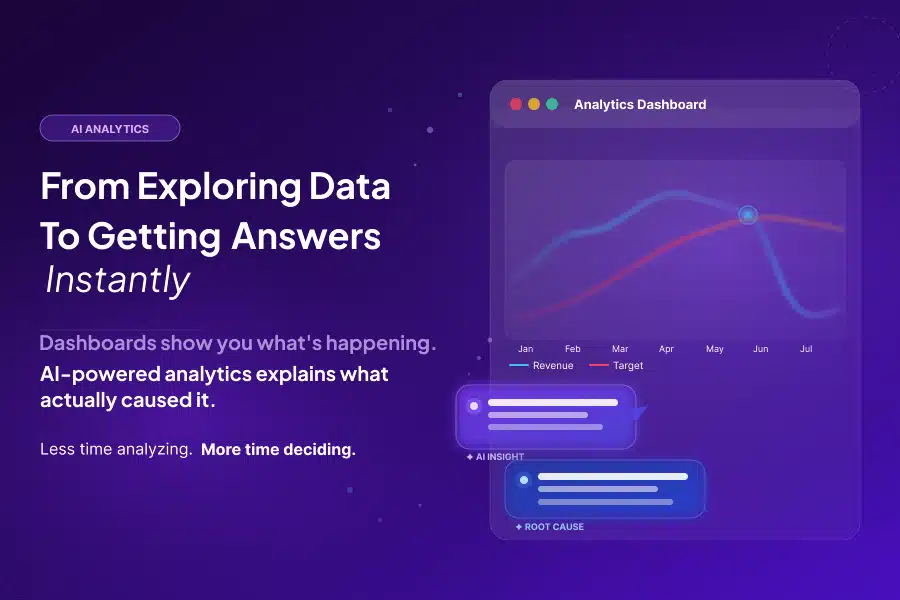
AI analytics in marketing is no longer just about reporting performance - it’s about reducing the time it takes to understand and act on it.

Over the past decade, marketing analytics has evolved significantly. Tools like Google Analytics 4 have made data more accessible, structured, and reliable. Most organizations today have invested heavily in dashboards, tracking, and reporting layers to strengthen their analytics setup.

But even with this progress, something still feels slower than it should.

Teams can see what’s happening almost instantly. Yet understanding what the data actually means - and deciding what to do next - still takes time.

This shift from data access to data interpretation is something we explored in detail in our earlier piece on how AI Analytics: Marketing Decision-Making Speed blog impacts decision speed.

This is exactly where AI analytics is beginning to redefine how modern marketing teams operate.

What is AI Analytics in Marketing?

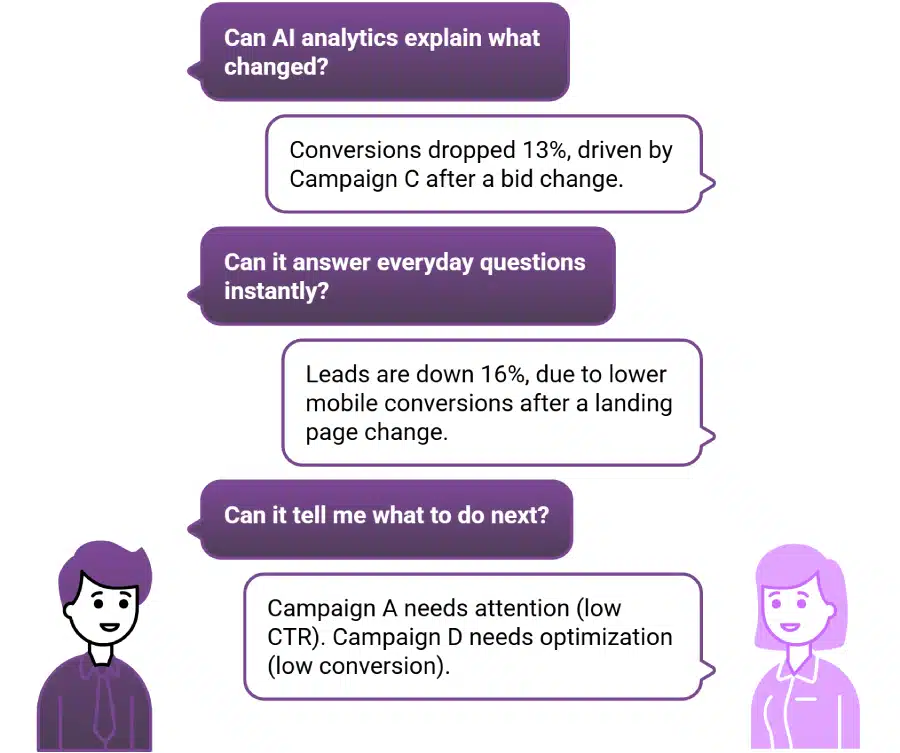
AI analytics refers to the use of artificial intelligence to analyze marketing data, identify patterns, and generate actionable insights that improve marketing decision making.

Unlike traditional marketing analytics, AI analytics helps teams move beyond reporting by answering:

  • Why performance changes are happening
  • What factors are driving those changes
  • What actions should be taken next

This shift is what makes AI powered analytics a critical layer in modern analytics workflows.

The Evolution of Marketing Analytics: What Changed, and What Didn’t

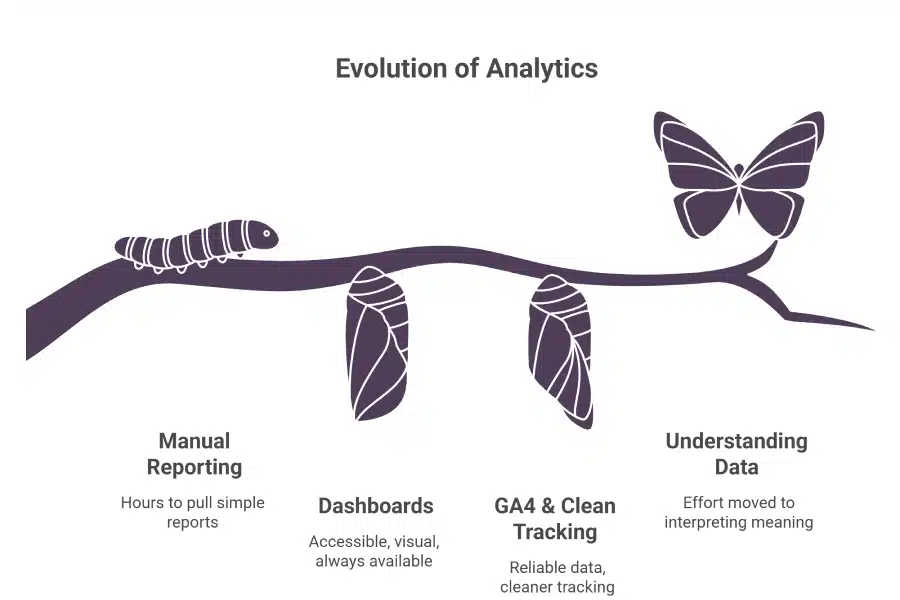
To understand why this problem exists, it helps to look at how marketing analytics has evolved.

Earlier, analytics was heavily manual. Teams depended on multiple tools, spreadsheets, and delayed reporting cycles. Pulling even a basic campaign report required time, coordination, and validation. Data existed - but accessing it was difficult.

Then came structured platforms like Google Analytics 4, which transformed how teams interacted with data.

These platforms made analytics:

  • Centralized across channels
  • Available in near real time
  • Easier to visualize through dashboards

This was a major leap forward for marketing analytics. However, while access improved, interpretation did not evolve at the same pace.

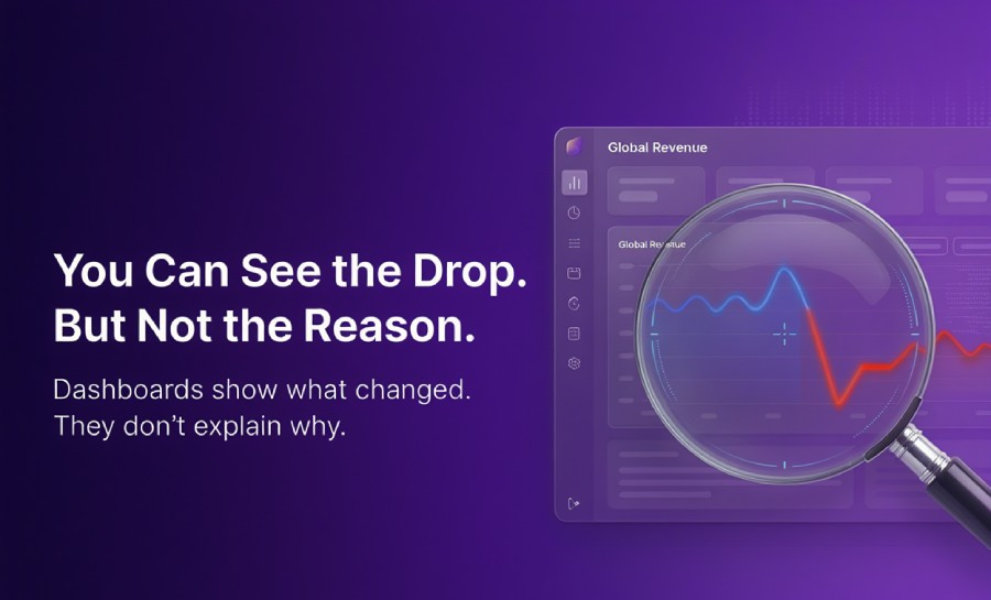
Even today, most analytics systems are designed to show data - not explain it. Teams still rely on manual workflows to understand why something happened and what actions should follow. This is where AI analytics begins to play a critical role.

The Real Bottleneck in Marketing Analytics

Most organizations today have a mature marketing analytics setup. They have:

  • Clean event tracking
  • Structured dashboards
  • Defined KPIs
  • Cross-channel visibility

On the surface, this looks like a fully optimized analytics system. But when performance changes occur, decision-making still slows down.

The issue is no longer data quality or reporting accuracy.
The issue is how long it takes to interpret the data.

Without AI analytics, teams still rely on manual workflows to connect data points, validate assumptions, and derive insights. This is where time gets consumed, and where decision speed breaks down.

What Happens After a Performance Drop (In Reality)

Consider a typical scenario.

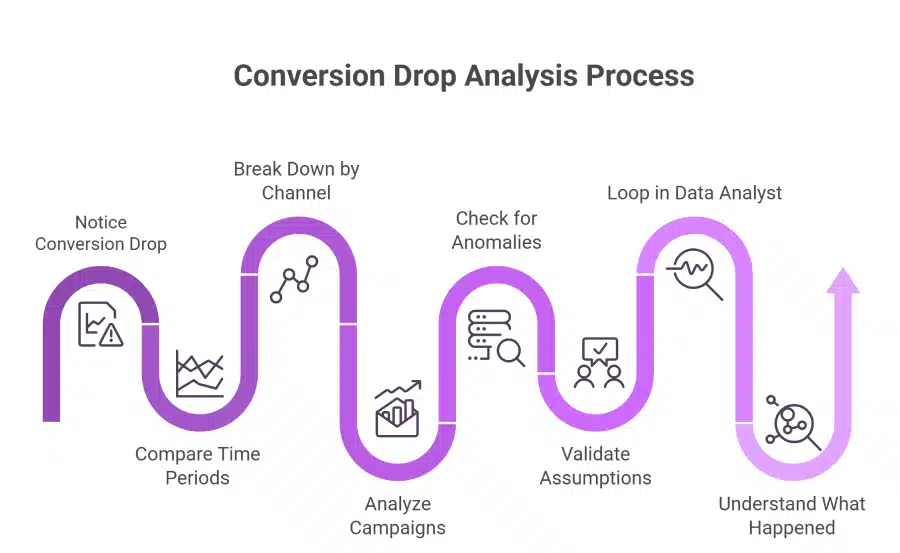
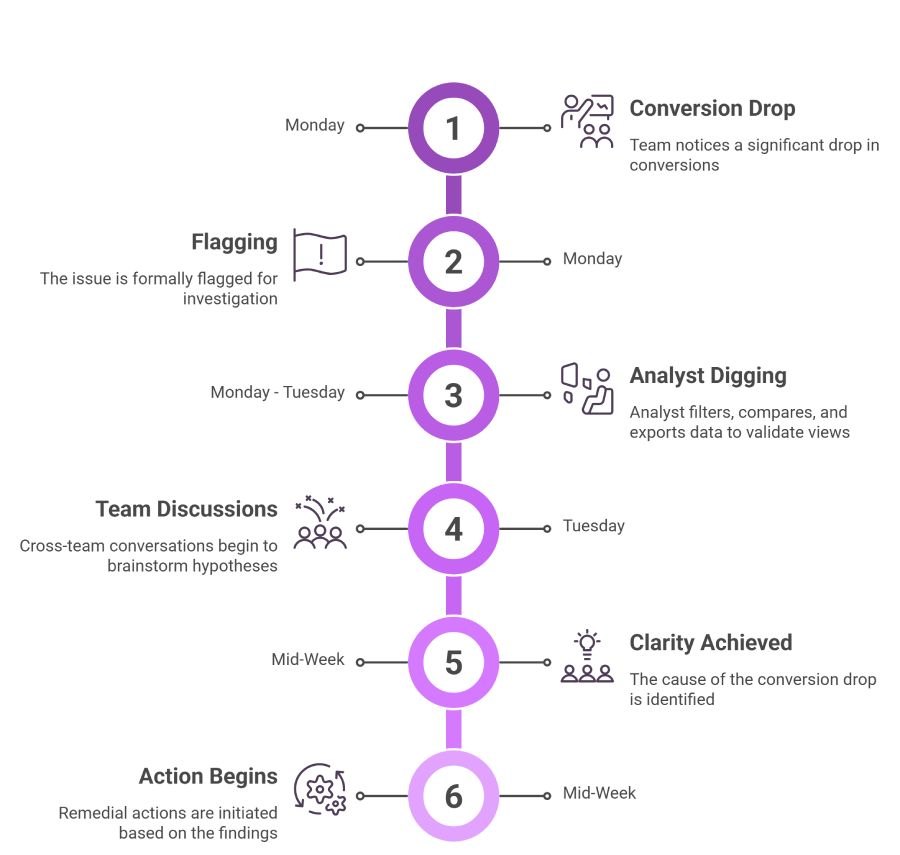
A drop in conversions is detected in your dashboard. The signal is clear, and the data is reliable. But that’s only the starting point.

From there, the team begins a structured investigation process:

  • Comparing performance across time periods
  • Breaking down results by channel
  • Analyzing campaign-level changes
  • Segmenting by audience, device, or geography
  • Validating whether the trend is real or an anomaly

In many cases, a data analyst is involved to conduct deeper analysis.

At this stage, the team is not making decisions yet.
It is still trying to answer a basic question:

“What exactly is happening here?”

This is where time gets consumed. And without AI analytics, this process repeats every time a new question arisesTraditional analytics process that slows marketing decision making speed.

Why This Process Persists Across Teams

The reason this workflow continues is not because teams are inefficient. It’s because traditional analytics tools are designed for exploration.

They are built to answer descriptive questions such as:

  • What changed?
  • Where did it change?
  • How significant is the change?

But they do not directly answer:

  • Why did it change?
  • What caused it?
  • What should we do next?

That gap creates a dependency on manual interpretation.

Even in sophisticated google data analytics setups, teams rely on human judgment to connect data points, validate hypotheses, and derive insights. This makes marketing decision making slower than it should be.

The Hidden Cost of Manual Interpretation

This interpretation gap has a measurable impact on performance. Without AI analytics, teams continue to rely on repetitive manual analysis to bridge this gap.

A significant portion of marketing analytics effort is spent on:

  • Repeating similar analyses for recurring questions
  • Validating insights across multiple stakeholders
  • Explaining findings in different contexts

Over time, this leads to:

  • Delayed decisions
  • Slower optimization cycles
  • Missed opportunities

These are not visible issues in dashboards, but they directly affect outcomes. If you want to quantify what this delay is costing your team, you can estimate the impact using the AI ROI Forecaster.

This is precisely where AI analytics creates value - not by improving visibility, but by improving understanding.

The Shift Toward AI Analytics

The shift toward AI analytics is not just conceptual - it is already delivering measurable impact.

According to research by McKinsey & Company, organizations adopting AI in marketing and sales are seeing significant improvements in performance, efficiency, and ROI.

AI analytics introduces a new way of interacting with data. Instead of starting with dashboards and exploring multiple dimensions manually, teams can start with insights that are already contextualized. This reduces the effort required to interpret data and accelerates decision-making.

At a practical level, AI analytics enables:

  • Automatic detection of anomalies
  • Pattern recognition across large datasets
  • Identification of likely causes
  • Generation of actionable insights

This is what differentiates AI analytics from traditional marketing analytics.

It is not about replacing existing tools.
It is about enhancing them with an interpretation layer.

What AI Powered Analytics Looks Like in Practice

With AI powered analytics, workflows change in a meaningful way.

Instead of manually investigating a drop in performance, teams receive insights such as:

  • “Conversions declined by 14% due to reduced engagement in mobile traffic from Campaign A.”
  • “Lead volume dropped due to lower conversion rates on landing page X after a recent update.”

These insights provide immediate context.

The team no longer needs to start from scratch. Instead, it can:

  • Validate the insight
  • Assess business impact
  • Decide on the next step

This shift reduces the time between data and action. That is the real promise of AI analytics.

In fact, we recently broke down a few real-world scenarios - from “simple questions” that take hours to answer, to situations where teams struggle to decide what to do next - in a more conversational format.

The Role of Agentic AI in Analytics

As AI analytics continues to evolve, agentic AI is emerging as a key enabler of continuous intelligence.

Unlike traditional automation, which executes predefined tasks, agentic AI systems can operate more independently. They continuously monitor data, identify changes, and surface insights without requiring manual input.

In the context of marketing analytics, this means:

  • Insights are generated proactively
  • Patterns are identified continuously
  • Teams are alerted to meaningful changes in real time

This transforms analytics from a passive system into an active decision-support layer. Explore how Agentic AI Services for Marketing Transformation can introduce a continuous intelligence layer into your analytics workflows

This is also where modern ai solutions are heading - toward systems that assist not just in reporting, but in understanding and action.

How AI Analytics Improves Marketing Decision Making

The impact of AI analytics on marketing decision making is significant.

Faster Time to Insight

Teams no longer spend hours or days interpreting data. Insights are available much earlier in the process.

Reduced Dependency on Manual Workflows

Routine questions can be answered without repeated analysis, reducing the burden on analysts.

More Consistent Interpretation

Standardized insights reduce variability in how different stakeholders interpret data.

Better Resource Allocation

Teams spend less time analyzing and more time optimizing and experimenting.

Together, these improvements lead to more efficient and effective marketing operations.

AI Analytics Use Cases in Marketing

To understand how this works in practice, AI analytics use cases in marketing highlight where teams gain the most value. Some common AI analytics use cases include:

  1. Campaign Performance Monitoring
    AI analytics identifies underperforming campaigns and highlights the root cause before significant budget is wasted.
  2. Conversion Drop Analysis
    Instead of manual investigation, AI analytics pinpoints the exact drivers behind performance changes.
  3. Cross-Channel Insights
    AI analytics connects performance trends across platforms, providing a unified view of what’s happening.
  4. Opportunity Identification
    AI analytics highlights areas that require attention, enabling teams to act faster.

These use cases demonstrate how AI analytics moves beyond reporting into actionable intelligence.

Evaluating Your Current Analytics Setup

Most organizations evaluate their analytics maturity based on:

  • Data quality
  • Tracking accuracy
  • Reporting capabilities

While these are important, they do not fully capture effectiveness.

A more relevant question is: How much effort does it take to get an answer?

If answering a simple question requires multiple steps, coordination, or extended analysis, it indicates that the analytics setup is incomplete. This is where AI analytics can create the most impact.

From Dashboards to an Analytics Intelligence Layer

Modern marketing analytics is evolving into a layered system.

Foundation Layer:

  • Data collection
  • Tracking (Google Analytics 4)
  • Reporting dashboards

Intelligence Layer:

  • AI analytics
  • AI powered analytics
  • Agentic AI

The intelligence layer focuses on interpretation.

It continuously analyzes data, connects signals to causes, and surfaces insights without requiring repeated manual effort. This is what defines an analytics intelligence layer.

The Strategic Advantage of AI Analytics

The real value of AI analytics lies in speed.

In competitive environments, the ability to understand data quickly leads to faster decisions. Faster decisions lead to better outcomes.

Organizations that adopt AI analytics gain:

  • Faster optimization cycles
  • Reduced wasted spend
  • Improved campaign performance

This is not just an operational improvement.
It is a competitive advantage.

Where Most Organizations Get It Wrong

Many organizations assume that improving dashboards will solve their analytics challenges.

In reality:

  • More dashboards increase complexity
  • More data does not equal better decisions

Another common mistake is treating AI analytics as a standalone tool.

It is not just a tool.
It is a shift in how analytics workflows operate.

Without aligning workflows, even the best AI analytics solutions will not deliver full value.

Closing Perspective

Analytics has always evolved to reduce effort.

First, it reduced the effort of collecting data.
Then, it reduced the effort of accessing it.

Now, it is reducing the effort of understanding it. This is where AI analytics is making the biggest impact.

By transforming how insights are generated and consumed, AI analytics enables teams to move faster from data to decision. It reduces manual effort, improves clarity, and supports better marketing decision making.

The advantage today is no longer about having more data. It is about understanding it faster - and acting on it sooner.

→ Explore how Agentic AI Services for Marketing Transformation can introduce a continuous intelligence layer into your analytics workflows

Tatvic | Automate your marketing with Agentic AI

AI Powered Analytics | Why Marketing Decision-Making Is Still Slow - and How to Fix It

AI Analytics: From Dashboards to Decisions

Where Marketing Decision-Making Slows Down

For years, marketing teams were solving for one core problem: They couldn’t trust their analytics.

Different dashboards showed different numbers.
Attribution didn’t add up.
Teams spent more time validating marketing analytics than using it.

So naturally, the focus shifted:

  • Better tracking
  • Cleaner Google Analytics 4 implementations
  • Standardized dashboards
  • Stronger reporting layers

And to be fair - this worked.

Today, many organizations finally have reliable analytics. They trust their data. But something unexpected happened next: Decision-making didn’t speed up. This is exactly where AI analytics is changing how modern marketing teams operate.

What Is AI Analytics in Marketing?

AI analytics in marketing refers to the use of artificial intelligence to analyze data, identify patterns, and generate actionable insights that improve marketing decision making.

Unlike traditional marketing analytics, which focuses on dashboards and reporting, AI analytics goes a step further. It helps teams understand:

  • Why performance changes are happening
  • What factors are driving those changes
  • What actions should be taken next

This is what makes AI powered analytics fundamentally different. Instead of relying entirely on a data analyst, teams can use intelligent systems to:

  • Detect anomalies in real time
  • Analyze cross-channel performance
  • Surface insights proactively
  • Recommend next best actions

In practice, this means your analytics evolves from:
Reporting what happenedto ‘Explaining what’s happening - and guiding what to do next

This shift is central to modern ai solutions and is increasingly powered by advancements like agentic AI, which enables continuous monitoring and decision support. This is why AI analytics is becoming a critical layer in modern marketing systems.

If Data Isn’t the Problem, What Is?

Most teams assume that once data is fixed, decisions should become faster. But in reality, the bottleneck hasn’t disappeared. It has moved.

From: “Can we trust this data?”

To: “What does this data actually mean - and what should we do next?”

And that second question is where things slow down again. Because while data collection and reporting have matured, data interpretation is still manual. This is where modern AI analytics enters the conversation.

The Hidden Bottleneck in Marketing Analytics

Let’s look at how this plays out in a typical marketing analytics workflow.

A team today has:

  • Clean analytics implementation
  • Accurate tracking
  • Structured dashboards
  • Cross-channel visibility

Everything looks right. But when performance drops:

What looks like a simple performance drop turns into a multi-day process - not because the data is wrong, but because understanding it takes time. This is where marketing decision-making speed breaks down. Every delay between signal and clarity slows action, extends impact, and reduces the ability to respond in real time. Without AI analytics, this interpretation gap continues to slow down decision-making.

Nothing Is Broken. But It’s Still Slow.

This is the reality of modern analytics. The issue is no longer:

  • Data quality
  • Reporting accuracy

The issue is: Time taken to interpret data

And that’s exactly the gap AI powered analytics is designed to solve. If you want to understand the real impact on your business, you can evaluate the potential ROI of faster decisions with the AI ROI Forecaster

The Core Limitation of Dashboards

Most marketing dashboards are designed to answer one question:

“What changed?”

They can show:

  • Drop in conversions
  • Channel-level performance
  • Campaign-level trends

But they don’t explain:

  • Why the change happened
  • Whether it’s temporary or systemic
  • What action should be taken

The biggest limitation impacting marketing decision-making speed is lack of automated interpretation. This creates a gap. And that gap is filled manually - every single time.

Why AI Analytics Is Becoming Essential

The shift toward AI analytics isn’t theoretical - it’s already delivering measurable impact.

Research compiled from firms including McKinsey Digital (2026) shows that AI in marketing can drive an average ROI improvement of around 35%.

At the same time, broader studies indicate that organizations using AI in marketing and sales are already seeing tangible gains in performance and efficiency.

This reinforces a clear shift: The competitive advantage is moving from access to data → speed of understanding.

Instead of just showing data, it helps teams:

  • Detect anomalies automatically
  • Analyze patterns across dimensions
  • Identify likely causes
  • Recommend next steps

This is where AI powered analytics transforms marketing decision making.

Why Marketing Analytics Still Feels Slow

Even with AI analytics capabilities emerging, most teams are still operating with manual interpretation layers where teams face the following challenges: 

1. Analysis Is Reactive

Teams analyze data after something goes wrong.

This means:

  • Insights come late
  • Impact has already occurred
  • Opportunities are missed

2. Analysts Become a Bottleneck

As data complexity increases, so does reliance on analysts.

They handle:

  • Ad-hoc queries
  • Deep dives
  • Reporting requests
  • Data validation

When multiple stakeholders ask questions, everything slows down.

3. Interpretation Isn’t Standardized

Two people can look at the same dashboard and reach different conclusions.

Why?

Because interpretation depends on:

  • Context
  • Experience
  • Assumptions

This leads to:

  • More discussions
  • Delayed decisions
  • Lack of consistency

4. Decision Latency Impacts Performance

This is the hidden cost.

In marketing:

Timing matters as much as the decision itself.

If understanding is delayed:

  • Budgets are wasted before correction
  • Underperformance continues longer
  • Winning strategies are identified late

Decision latency directly reduces marketing decision-making speed across teams.

The Real Shift: From Data Accuracy to Decision Speed

Over the last few years, organizations have optimized for: Data accuracy, tracking reliability, and reporting consistency but the next evolution isn’t better dashboards. It’s analytics intelligence powered by ai solutions.

It’s about: How fast your team can move from data → insight → action

This is where most organizations still struggle.

Introducing Analytics Intelligence

This is where AI analytics evolves into a true intelligence layer.

An Analytics Intelligence Layer

This sits on top of your existing analytics setup and focuses on:

  • Continuous performance monitoring
  • Automated analysis of changes
  • Contextual explanation of trends
  • Identification of likely causes

Instead of starting with raw data,
teams start with interpreted insights.

Is Your Current Process Ready for This Shift?

Not every analytics workflow is ready for an intelligence layer. The key question is: Where is your team still dependent on manual analysis? This is where evaluating your internal workflows becomes critical.

→ Use the AI Process Eligibility Calculator to identify where AI analytics can create the most impact

From Manual Analysis to AI-Powered Clarity

Let’s revisit the earlier scenario. Instead of spending 2-5 days analyzing data, the team receives:

“Conversions dropped 18% yesterday, primarily from paid search.
The decline is concentrated in Campaign X after a recent bid adjustment.”

Now the conversation changes.

From: “What happened?”

To: “What should we do next?”

This shift reduces:

  • Time spent analyzing
  • Back-and-forth discussions
  • Dependency on manual workflows

And compresses decision cycles from days to hours. With AI analytics, teams no longer start from raw data - they start from insight.

Does This Replace Analysts or Teams?

No, and it shouldn’t.

The role of AI Analytics Intelligence is not to replace human expertise. It’s to enhance it.

Teams still:

  • Validate insights
  • Apply business context
  • Make final decisions

But they start from a position of clarity, not confusion.

Why This Matters More Than Ever

Marketing environments today are more complex than ever.

  • More channels
  • More campaigns
  • More segmentation
  • More data

At the same time:

  • Decision cycles are shorter
  • Expectations are higher
  • Teams are leaner

In this environment: AI use cases in analytics are no longer optional - they’re a competitive advantage.

How to Identify If You Have a Decision Speed Problem

Ask yourself:

  • How long does it take to understand a performance drop?
  • How many people are involved in analysis?
  • How often do decisions get delayed due to unclear insights?
  • How quickly can your team act on new opportunities?

If the answer is measured in days,
there’s a clear opportunity to improve.

From Reporting to Decision Intelligence

Most organizations have already invested in: Marketing analytics tools, data pipelines, reporting dashboards

But reporting only answers: “What happened?”

To improve performance, you need systems that answer: “Why did it happen - and what should we do next?”

That’s the shift from:     Reporting     to    Decision Intelligence

The Role of Agentic AI in Analytics

Agentic AI takes this further. Instead of just analyzing data, it can:

  • Continuously monitor performance
  • Trigger insights automatically
  • Assist in decision workflows

This creates a system where analytics is no longer passive - it becomes active.  Not just to inform decisions. But to support how marketing actually operates at scale.

Closing Thought

Fixing your data was a critical step. But it was never the final one. Because clean data doesn’t create clarity on its own. And in today’s environment:

The advantage doesn’t come from having more data.
It comes from understanding it faster - and acting on it sooner.

Improving marketing decision-making speed is no longer about fixing data. It is about reducing the time between insight and action. The faster teams interpret what is happening, the faster they can respond - and that is where competitive advantage now lies. This is the real promise of AI analytics - faster understanding, faster action, and better outcomes.

Explore what faster, more consistent decision-making could look like:

If your team is still spending days moving from data to action, it may be time to rethink how your AI analytics layer operates.

Start your Analytics Intelligence discussion
Evaluate your AI readiness

What is Google Maps API? Benefits, Use Cases, and Implementation

TL;DR

Google Maps API is more than just an interactive map for websites, it’s a powerful location intelligence tool that enables businesses to embed maps, calculate routes, display points of interest, and integrate geolocation features into web and mobile apps. By leveraging Google Maps API, businesses can optimize the customer experience through store locators, delivery tracking, and seamless navigation. It also enhances marketing campaigns with location-based targeting, improves logistics and operations via real-time routing and fleet management, and enables AI-driven insights by integrating maps data with analytics platforms such as GA4 and DV360. With its flexibility, scalability, and real-time data capabilities, Google Maps API has become an essential tool for both enterprises and SMBs, powering applications that range from eCommerce platforms to smart city initiatives.

Introduction: Why Google Maps API Matters

In today’s digital-first world, location is more than just a point on a map; it’s a critical driver of customer experience, operational efficiency, and business intelligence. Consumers expect instant, accurate, and seamless access to physical locations, whether they are finding the nearest store, booking a ride, or tracking a delivery. Businesses that fail to deliver precise location experiences risk losing customers and revenue.

The Google Maps API is a comprehensive suite of developer tools that allows businesses to embed interactive maps, retrieve geospatial data, calculate optimized routes, and display points of interest across web and mobile applications. It transforms location data into actionable intelligence, helping enterprises deliver faster, smarter, and more personalized experiences.

By integrating Google Maps API, businesses can:

  • Turn raw location data into actionable insights that drive operational and marketing decisions.

  • Enhance user experience with intuitive navigation, predictive search, and dynamic location displays.

  • Power marketing campaigns, analytics, and AI-driven personalization, from geo-targeted ads to route optimization.

Whether you run a retail chain, logistics company, travel platform, or healthcare network, Google Maps API bridges the gap between the physical world and digital experiences, enabling seamless location-based interactions that drive engagement and conversions.

What is Google Maps API?

At its core, the Google Maps API is a set of programmable interfaces that allows your website, mobile app, or enterprise system to interact directly with Google Maps’ comprehensive geospatial database. It’s more than just a map, it’s a location intelligence engine.

Google Maps API enables businesses to:

  • Embed interactive maps anywhere online or within applications, providing users with familiar and responsive map interfaces.

  • Retrieve geospatial information, including coordinates, addresses, postal codes, time zones, and administrative boundaries.

  • Calculate optimized routes, distances, and travel times, factoring in traffic conditions, road restrictions, and preferred transit modes.

  • Display points of interest, from stores and restaurants to landmarks and service centers, dynamically based on user location or query.

  • Integrate with other APIs and platforms, enabling location-based analytics, personalized recommendations, and AI-driven services.

The Google Maps API is part of the Google Maps Platform, which encompasses specialized APIs like Maps, Routes, and Places, all managed through a unified platform with centralized billing, monitoring, and usage controls.

google maps api best practices

Key Components of Google Maps API

Understanding the core components of Google Maps API helps businesses choose the right tools to integrate location intelligence into their applications. Each API serves a distinct purpose, enabling businesses to deliver highly interactive, data-driven, and personalized experiences.

1. Maps API

The Maps API allows businesses to embed fully interactive maps directly into websites and mobile apps. It supports advanced customization, including map styles, overlays, markers, and pop-ups, ensuring the map aligns seamlessly with your brand identity. Whether it’s a store locator for retail chains or an event map for conferences, this API provides a flexible foundation for geospatial visualization.

2. Routes API

The Routes API provides precise, real-time navigation for driving, walking, or public transit. It factors in current traffic conditions, road closures, and preferred travel modes, helping users reach their destinations efficiently. Businesses can leverage this for delivery optimization, field service management, ride-hailing apps, or last-mile logistics, enhancing both operational efficiency and customer satisfaction.

3. Places API

With the Places API, businesses can integrate location-based search and discovery into their applications. Key features include autocomplete search for location input fields, access to detailed information about businesses (reviews, photos, opening hours), and identification of points of interest. Retailers, travel platforms, and hospitality apps can deliver intuitive search experiences that guide users to the right locations effortlessly.

4. Geocoding & Geolocation APIs

The Geocoding API converts human-readable addresses into geographic coordinates, while the Reverse Geocoding API converts coordinates back into readable addresses. Combined with the Geolocation API, which tracks device locations in real time, these tools enable location-based personalization, delivery tracking, asset monitoring, and emergency response applications.

5. Distance Matrix API

The Distance Matrix API calculates travel times and distances between multiple origins and destinations. Businesses can use it to optimize delivery routes, estimate arrival times for services, or analyze network efficiency for logistics and transportation. This API is crucial for improving operational planning and reducing costs in complex route networks.

6. Street View API

The Street View API provides immersive 360° panoramic imagery, allowing users to virtually explore streets, buildings, and landmarks. This is particularly valuable for real estate platforms, tourism apps, and retail locations, offering an interactive experience that drives engagement and helps users make informed decisions.

7. Time Zone & Elevation APIs

The Time Zone API provides accurate global time zone conversions, while the Elevation API delivers precise elevation data for any location. These APIs support logistics planning, outdoor adventure apps, travel itineraries, and any application requiring geospatial intelligence beyond basic maps.

With the right mix of Google Maps APIs, businesses can transform simple maps into intelligent location-based solutions that drive both user satisfaction and operational excellence.

Why Businesses Use Google Maps API

Google Maps API has evolved from a simple mapping tool into a mission-critical business asset, helping enterprises and SMBs leverage location intelligence to improve operations, user experience, and marketing effectiveness. Its applications span across industries:

  • Retail & eCommerce:

    Enable customers to find nearby stores, check product availability in real time, and access click-and-collect or curbside pickup options. Interactive maps enhance shopping journeys and reduce friction in the buying process.

  • Logistics & Transportation:

    Optimize fleet management, calculate the fastest routes, predict delivery times, and minimize fuel costs. Real-time traffic updates help logistics companies improve operational efficiency and customer satisfaction.

  • Travel & Hospitality:

    Offer immersive trip planning experiences, highlight nearby attractions, and provide hotel or restaurant proximity insights. Maps and Street View integration help travelers make informed decisions instantly.

  • Healthcare:

    Allow patients to locate clinics, hospitals, or pharmacies efficiently. Geolocation services ensure timely access to medical facilities and improve patient engagement.

  • Marketing & Advertising:

    Drive location-based campaigns, geofencing strategies, and footfall analysis. Businesses can deliver hyper-targeted promotions and track campaign effectiveness using location data.

  • Real Estate:

    Showcase property locations with interactive maps and Street View integration, providing potential buyers and renters with an immersive virtual tour experience before visiting.

By incorporating Google Maps API, businesses transform raw location data into actionable intelligence, enabling smarter operational decisions, enhanced customer satisfaction, and measurable ROI.

You May Also Like to Read 👉 Which Mapping Platform Is Best in 2025?

Benefits of Google Maps API

Leveraging Google Maps API provides businesses with a suite of tangible advantages that go beyond simple navigation:

  • Accuracy & Reliability:

    Real-time updates ensure that maps, routes, and points of interest are always current, reducing errors and enhancing trust.

  • Scalability:

    Handle millions of API calls seamlessly without performance degradation, making it suitable for global enterprises and high-traffic applications.

  • Enhanced User Experience:

    A familiar Google Maps interface builds trust, encourages engagement, and simplifies navigation for end-users.

  • Customization:

    Businesses can tailor map styles, markers, overlays, and info windows to match brand identity, creating a cohesive and professional experience.

  • Data-Driven Insights:

    Integration with platforms like GA4 and DV360 allows businesses to analyze geospatial data for marketing, operational planning, and AI-driven personalization.

  • Cross-Platform Integration:

    Google Maps API works consistently across web applications, Android, iOS, and enterprise software, ensuring seamless multi-device experiences.

  • Operational Efficiency:

    By optimizing routes, managing assets, and predicting demand, companies can save time and resources while delivering better customer outcomes.

In essence, Google Maps API empowers businesses to connect the digital and physical worlds, creating smarter, faster, and more engaging experiences for customers while driving measurable business growth.

Google Maps API Pricing

Google Maps Platform operates on a flexible pay-as-you-go model, making it accessible for startups, SMBs, and large enterprises alike.

  • Free Tier:

    Every account receives a $200 monthly credit, ideal for small-scale apps, testing environments, or initial proof-of-concept projects. This allows businesses to explore Maps, Routes, and Places APIs without upfront costs.

  • Paid Plans:

    Charges are usage-based and vary according to API consumption, including Maps, Routes, Places, Distance Matrix, and other specialized APIs. This ensures scalability-your costs grow only as your usage grows.

  • Budget Control:

    Google Cloud provides configurable usage limits, alerts, and billing dashboards to prevent unexpected overages. Businesses can monitor API consumption in real-time and optimize workflows to stay within budget.

Pro Tip: Use Google’s Pricing Calculator to estimate monthly API costs accurately. Planning ahead allows you to forecast budgets, evaluate ROI, and prioritize high-impact applications.

How to Implement Google Maps API

Integrating Google Maps API into web or mobile applications is straightforward if approached systematically:

  1. Create a Google Cloud Project:

    Start by setting up a project in the Google Cloud Console and enable billing.

  2. Enable Required APIs:

    Depending on your needs, enable APIs such as Maps, Routes, Places, Geocoding, Distance Matrix, and Street View.

  3. Generate an API Key:

    Configure your API key with proper usage restrictions (HTTP referrers, IP addresses, or app restrictions) to enhance security.

  4. Add SDKs or Libraries:

    Incorporate the Google Maps SDK for Web, Android, or iOS platforms based on your application environment.

  5. Test and Monitor:

    Verify your implementation using the Google Cloud Console, Debugger tools, and real-world tests.

  6. Advanced Integration:

    For businesses seeking deeper insights, APIs can be integrated with analytics platforms like GA4 or DV360, combining geospatial data with behavioral analytics for AI-driven personalization, marketing optimization, and operational efficiency.

How to Pull Data with Google Maps API

One of the most powerful features of the Google Maps API is the ability to extract and use location-based data within your applications. By leveraging the Maps Platform, developers can retrieve detailed information about specific locations, including full addresses, latitude and longitude coordinates, nearby points of interest (POIs), business details, and even real-time traffic data. This capability forms the backbone of location intelligence applications, enabling everything from mapping services and geolocation apps to logistics management and location-driven marketing campaigns.

For instance, a retail app can dynamically display store locations near a user, a travel app can provide nearby attractions, and a delivery platform can optimize routes in real time all by pulling and processing data from the Google Maps API.

However, accessing this data requires a valid Google Maps API key, which ensures secure and authorized usage. Developers must also be mindful of usage limits and billing policies, as exceeding free-tier allocations can result in additional charges. The Google Maps API documentation provides comprehensive guidelines for quotas, pricing, and best practices for managing requests efficiently.

To pull data effectively, developers can use APIs such as Places API (for POIs and business details), Geocoding API (for converting addresses into coordinates and vice versa), and Distance Matrix API (for calculating travel distances and times). Combining these APIs allows businesses to create highly customized, data-driven experiences that leverage real-time location intelligence.

Practical Use Cases Across Industries

Google Maps API is versatile, powering location intelligence and enhancing user experience across multiple sectors:

  • Retail:

    Implement store locators, show inventory by nearest location, and offer click-and-collect or curbside pickup points, improving customer convenience and conversion rates.

  • Logistics:

    Optimize fleet operations with real-time tracking, dynamic route planning, and delivery ETA updates, reducing costs and increasing operational efficiency.

  • Healthcare:

    Help users locate the nearest hospitals, clinics, or pharmacies and provide emergency routing, enhancing patient safety and accessibility.

  • Travel & Tourism:

    Deliver interactive trip planners, local guides, and immersive Street View experiences for travelers seeking detailed, real-world context.

  • Marketing:

    Enable hyper-local campaigns, geofencing promotions, footfall tracking, and location-based targeting for better ROI on digital marketing investments.

  • Real Estate:

    Visualize property locations, conduct proximity analysis, and create virtual tours with Street View integration, helping buyers make informed decisions.

By leveraging Google Maps API across these industries, businesses can transform location data into actionable intelligence, streamline operations, enhance customer experience, and unlock new revenue streams.

Common Pitfalls to Avoid When Using Google Maps API

Even with a powerful tool like Google Maps API, improper implementation can lead to security risks, inefficiencies, and missed opportunities. Avoid these common mistakes:

  • Not Securing API Keys: Leaving API keys unrestricted exposes your account to misuse, resulting in unexpected charges or malicious activity. Always set HTTP referrer, IP, or app restrictions.

  • Ignoring Usage Quotas: Google Maps APIs have usage limits, and exceeding them without monitoring can lead to overage fees. Set alerts and monitor usage in the Google Cloud Console.

  • Over-Reliance on Default Map UI: Using un-customized maps may lead to a generic or confusing user experience. Customize map styles, controls, and markers to match your brand and improve engagement.

  • Lack of Integration with Analytics: Without connecting Maps API to platforms like GA4 or DV360, you miss valuable insights on user behavior, engagement, and campaign performance.

By proactively addressing these pitfalls, businesses can protect their investment, improve UX, and maximize ROI from location-based applications.

Advanced & Future Considerations

Google Maps API is evolving beyond simple maps into a full-fledged location intelligence platform. Forward-thinking businesses can leverage these innovations to stay ahead:

  • AI-Powered Maps: Predictive routing, dynamic traffic analysis, and crowd density forecasting help enterprises optimize logistics, improve delivery times, and enhance customer experience.

  • Augmented Reality (AR) Integration: Overlay directions, promotions, or product information in retail, navigation, and tourism apps, offering immersive user experiences.

  • Electric Vehicle (EV) Navigation: Real-time charging station locations, availability updates, and route optimization for EV fleets are becoming essential for sustainable logistics and urban mobility.

  • Privacy-First Maps: Compliance with regulations such as GDPR, CCPA, and DPDP ensures that location data is collected and processed securely, building user trust.

  • Conversational Interfaces: Integration with AI assistants like ChatGPT, Gemini, and Claude enables voice-based directions, predictive suggestions, and context-aware search, making maps more interactive and accessible.

In today’s digital landscape, Google Maps API is no longer just a mapping tool-it’s a strategic platform for business intelligence, operational efficiency, and customer engagement. Enterprises that adopt these advanced capabilities can transform raw geospatial data into actionable insights that drive revenue, optimize operations, and elevate the overall user experience.

Google Maps API vs Competitors

While several mapping solutions exist, Google Maps API consistently stands out due to its accuracy, scalability, and extensive ecosystem. Here’s how it compares:

  • Mapbox: Known for high customization and developer flexibility, but its points-of-interest (POI) database is smaller, which may limit real-world applications.

  • OpenStreetMap (OSM): Free and open-source, making it ideal for cost-conscious projects, but real-time traffic and route optimization are less reliable compared to Google.

  • MapMyIndia: Excellent for India-specific mapping and geospatial data, offering precise regional insights. However, it lacks the global coverage and integration ecosystem that Google Maps API provides.

Despite these alternatives, Google Maps API remains the most comprehensive, reliable, and widely adopted platform for enterprises seeking robust location intelligence, real-time routing, and AI-enabled geospatial analytics.

Conclusion: Why Google Maps API is a Strategic Growth Engine

Google Maps API is no longer just a tool for embedding maps-it has become a core driver of business growth and operational efficiency. Businesses that harness its capabilities can:

  • Enhance User Experience: Deliver intuitive navigation, predictive search, and location-based recommendations.

  • Optimize Logistics & Operations: Streamline fleet management, route optimization, and real-time delivery tracking.

  • Drive Data-Driven Marketing: Use geospatial insights to power hyper-local campaigns, audience segmentation, and footfall analysis.

  • Enable AI & Personalization: Combine Maps API data with analytics platforms like GA4 and DV360 to fuel AI-powered personalization engines, predictive services, and smart automation.

With advanced analytics and GA4 implementation in place, Tatvic’s experts specialize in setting up, validating, and scaling Google Maps API for enterprises. From reducing friction in customer journeys to transforming raw geospatial data into actionable insights, we ensure your Maps API implementation drives measurable growth and strategic advantage.

Whether you’re in retail, logistics, healthcare, travel, or real estate, Google Maps API empowers your business to connect the physical world with digital experiences, making every interaction smarter, faster, and more meaningful.


Bot Icon
Bot Icon

Tatvic Bot

Explore About Tatvic and Services