Hello There!

Lorem ipsum dolor sit amet, consectetur adipiscing elit,

 About Ravi Pathak

Ravi is the co-founder of Tatvic and expert at managing different web analytics tools. Ravi actively works on conversion optimization projects to improve conversion rate and test newer hypothesis with e-commerce companies.

Video Engagement Tracking Analytics: Know the User Engagement rate of Your Video Channel

Video analytics


Video analytics

Videos have always been more effective medium of communication. Studies shows that retention rate of information is 80% for what you see and hear. For hearing it is 10 % and 20% for seeing. Better internet infrastructure has allowed online businesses to use videos as part of the content strategy. According to KPCB1 study, online video will account for 74% of online traffic by end of 2017.

Around 50% of internet users look for product related videos before visiting store2. In education content distribution industry, companies like coursera, udacity have been successful in terms of creating, publishing and tracking such videos for engaging their viewers.

Is Your Video Tracking Exhaustive?

Videos are helpful in increasing user engagement and retention. We should have efficient event tracking in place to measure video consumption metrics. For text or image content, marketers have been measuring user interactions like pageviews, clicks or hover events. For videos, it is not enough to track how many times video was being played. For getting true engagement insights, interactions like play, pause, seek should be tracked. Some of the important metrics for tracking videos on websites are video watch time, total play count, etc.

Use custom dimensions to track Video category, language, genre, total video duration, release date, etc.

user engagement with video

Having category, language, total duration as custom dimensions helps in creating custom reports. Comparing user engagement on webpages with and without videos gives useful insights. It helps in deciding video positions on the webpage.

Drawing Actionable Insights

Tracking events on 25%, 50%, 75%, 100% of video help us understand consumption and drop-off rates. We can then decide Ads placement or Click To Action buttons placement accordingly. For example, let’s say we find out that, people leave the website or play another video on 95% completion of movie. This is likely to happen as last 5% content may show movie credits. Then it makes sense to show ads or ‘Click-to-Action’ links much earlier.

There are many analytics tools which help businesses measure user interactions for videos. With over a billion users, YouTube Analytics solution is most popular in the industry. It allows us to track user interactions like total video play, pause,etc. events.

Track Much More Than Basic Events

Most of the analytics tools in the industry track video events like play, pause, seek, clicks on ads, etc. This is where effective measurement plan comes into picture. Considering the business requirements, Tatvic team has developed a solution for video tracking.

Features of Video Analytics Tool by Tatvic
  • Actual video watch time:

    When user is watching a video, user may pause a video for some time or does some other work and then again resumes play. Or, video is being played on the webpage but user is browsing some other websites in another tab. In such scenarios, metrics like video play count, watch duration will give misleading picture. Tatvic team identified this possible problem. We developed a solution for calculating actual watch duration. It considers special cases like tab switch, pause, screen size.

  • PWA Implementation:

    Progressive Web Apps are gaining popularity with better performance. Online traffic consumption across mobile has grown significantly over last few years. Tatvic team has implemented Video tracking solution for PWA websites as well.

  • Personalized Recommendations of video content:

    ‘Recommended videos’ feature played a major role in success of YouTube.  Similar is the case with Facebook videos. 500 million people are watching videos on Facebook every day3. Tatvic Data Science team has developed a Recommendation Engine. It uses machine learning algorithms to suggest recommended videos.

  • Video Players covered:

    YouTube, HTML5, Kaltura, JW Player etc.

What’s Next:

Since survey reports4 show that 11% of the global internet population is blocking ads on the web, if you are showing ads in videos then tracking the number of users with AdBlocker tools is imperative. Tatvic has also developed a solution for detecting Ad Blocker scripts which is a universe in itself and we shall be covering it in a separate blog post.

“If You Can’t Measure It, You Can’t Improve It”

We hope the blog proved to be insightful to you and helped you in understanding the value of having video tracking for your website/app in place. If you have any doubts or are looking for clarifications, please drop in comments and we shall be sure to get back to you.

Edit Button for Google Analytics Custom Reports with Chrome Extension by Tatvic

chrome extension for google analytics

.cta{ background: #cd4746!important;color: #fff!important;font-family: ‘Oxygen’, sans-serif;font-weight: 700;}<br

chrome extension for google analytics

Google is constantly making efforts to make the world a better place with its products and services. Recently, Google Analytics was reborn with new features and a revamped desktop UI. These changes are rolling out globally on a gradual basis. We, as a reseller of Google Analytics, love the new features being rolled out. We are especially glad to have an insightful Homepage.

As the product is upgrading, we were exploring with the aim to get to know these changes in detail. One typical pain point is not having the “Edit” button on Google Analytics’ Custom Report. For us, it is a basic task to create a custom report and edit it on the fly while analyzing the data collected in Google Analytics.

Everyone on the floor was asking each other, “When will Google add this Edit custom report button?”. And the other person replies, “Don’t know about that but anyway you can go to the Custom Reports Overview page and select Edit from the Actions drop-down”.

edit button chrome extension

This dialogue exchange inspired an internal discussion, we arrived at a fruitful decision to work on creating and launching a Chrome Plugin that will provide an Edit button on a temporary basis. Having an Edit button on the Custom Report itself will ease the process of editing the report and checking the data repeatedly.

chrmose extension for editing custom reports in google analytics

Initially, we had released this extension only internally. But after receiving positive feedback from all the users, we decided to roll out this extension globally as it was actually serving a purpose.

How to get it?

You can get this extension from the Chrome Web Store or simply click on the below button.

Click on Add to Chrome button and Voila! You’re good to go. Check our extension in the action.

edit custom reports

Download the extension, use it, and send us feedback as to how you liked it and if there are any issues that you might face.

How to implement Google Tag Manager for Android

featured_image

Editor’s Note: This blog has been updated on June 06, 2017 as per the latest version of GTM and Android

featured_image

At I/O 2013, Google added new features to the Google Tag Manager. They launched Google Tag Manager for Android and iOS devices. It is used in Mobile App along with Google Analytics to track various user behavior and help the marketers identify the trends, needs of users, app performance and other peculiar insights.

Google Tag Manager for mobile app developer devices also makes their development easy and dynamic. It enables the developers to change configuration values in their mobile applications using the tag manager interface, without having to rebuild and resubmit application binaries to the app marketplaces.

In order to walk through the implementation, you must be familiar with Android and iOS development to understand and implement tags for web analytics using Google Tag Manager.

Before starting implementing GTM, I recommend drafting a plan for tagging for google tag manager it will help to structure the core objective of data collection.

Steps to set up GTM in an Android Project (Click here or iOS)

  1. Create a Google Tag Manager Account
  2. Create a Mobile App container
  3. Note down the Container ID (It would be of the form of GTM-XXXXX)
  4. Add Google Play Services library to your project
    NOTE: Check for latest updated version of Google Play services library when adding it in project.Google tag manager
  5. Add the following permissions in your AndroidManifest.xmlGTM
  6. Also Add the Install Referrer Receiver in AndroidManifest.xml to track Campaign Data.Google Tag Manager for Android and iOS devices
  7. Now, Create a Trigger with the following configuration in Google Tag Manager Container.GTM for android
  8. Create a DataLayer Variable to fetch the value of screenName from the datalayer.GTM for iOS devices
  9. Create a Tag to fire the Screen View from the app.tag manager
  10. Add Google Tag Manager’s Default Container to your Project.
    • Within Google Tag Manager interface select VERSIONS -> ACTION -> DOWNLOAD this will download the container binary file.
      google analytics
    • Within your Android project, create a raw folder in project-root / res path.
    • Copy the downloaded binary file to the path project-root / res / raw with changing the filename to gtm_defaultcontainer_gtm_id.Google tag manager

Now, Let’s get started with initializing Tag Manager Instance and using DataLayer

  1. Create a ContainerHolderSingleton Class.
    ContainerHolderSingleton class is used to have access to a single instance of TagManager Object at a time.GTM
  2. Create a class ContainerLoadedCallback Class.
    ContainerLoadedCallback class is used to load the fresh GTM Container when it is availableGoogle Tag Manager for Android and iOS devices
  3. Initialize Tag Manager in Application Class of your app (Recommended) or First Screen of the App (i.e. Splash Screen or Main Screen)
  4. Load the latest container by specifying the CONTAINER_ID
  5. Use ResultCallback to return the ContainerHolder once it has finished loading or has timed out for fetching the latest container
    GTM for android
  6. After Initializing GTM well, it’s time to add the tracking code, which is implemented using the DataLayer Object.
    DataLayer provides a layer of persistence that you use to store data in key-value pairs form and then send it to Google Analytics.
    Create one method in general until class to push the openScreen event and start tracking the screen views from your app. You can call this method in onCreate()/onStart Method of your app activities with the screenName that you want to send.
    GTM for iOS devices

With the above steps performed we have successfully implemented the Google Tag Manager in Android. To know that your implementation is working well, verify your data in Google Analytics Report.

Also please note that to track any kind of action through GTM, an event must be pushed in dataLayer and for the very same event, a Tag must be configured in GTM Interface.

So, that’s it. This is how you can integrate Google Tag Manager version 4 container in your Android app. Recently, Google rolled out version 5 container for the app

Now, the question is which version should you use in your app. Stay tuned for the benefits of the version 5 container over the version 4 container and steps to integrate it.
Till then HAPPY TAGGING!

How Google Analytics with CRM Intergration helps in Digital Re-marketing?

Integrate Google Analytics with CRM for Digital Remarketing

Integrate Google Analytics with CRM for Digital Remarketing

Google Analytics is a tool that helps you measure the effectiveness of your marketing channels. It stores the online behavioral (web and/or app) data of your visitors. However, your CRM has additional data stored with your customer’s offline activity.

Using your CRM data, you can run different types of campaigns such as email, SMS & calling campaigns for your warm and hot leads. These traditional campaigning strategies are used by all and hence your product/service offering has to fight a tough battle against your competitors.

The case is slightly different in the case of online remarketing. Since online remarketing is carried out using first-party cookies, it means you can exclusively reach out to visitors of your website while they are surfing other websites on Ad Networks (like Google Display Network, DoubleClick, Amazon, etc.). Specifically, in the case of lead generation and eCommerce websites, if we combine the two data silos (GA and CRM), then we can create a platform for user segments and carry out online remarketing with smart and effective remarketing lists.

Let’s move to the next section to understand a few use cases and the steps to implement this.

First, we will discuss Lead Generation websites and then eCommerce websites.

Lead Generation Websites:

Typically, for lead generation websites, the flow is such that traffic lands on your website from different sources and shows interest. Hence, a lead is generated. Post lead generation, the sales activity starts and CRM tracks the sales funnel.

Online Lead Conversion Funnel:

online lead conversion funnel

Offline Sales Conversion Funnel:

offline sales conversion funnel

Following are some most common attributes that are available in Google Analytics as well as CRM for generating and evaluating a lead.

Google Analytics

  • The marketing channel that brought the user
  • Number of sessions
  • Average time on the website
  • Pages visited
  • Demographics
  • Geographical information
  • Device information
  • Last visited

 CRM

  • Current stage of sales process (e.g. Stage A -> Stage B -> Stage C -> Lead closed)
  • Type of lead (Cold/Warm/Hot)
  • Lead income
  • Gender
  • Occupation type
  • Age bracket

You can create smart remarketing lists for:

  • Users who have visited your website but have not yet submitted a lead. (Non-converters)
  • Users who have recently submitted leads and are yet on stage C  of the conversion funnel. (Recent lead but sales process not moving ahead may be because of temporary unavailability of the user)
  • Leads from organic channels but have not yet started sales funnel steps. (These users came organically by searching and so have a very strong intention to buy)
  • Users from organic medium and after submitting lead they have lead income as > XYZ
  • Users who came to the site from Facebook who is from the age bracket of 21-25 years & profession as working professionals & gender as male

Here are the different types of remarketing campaigns that can be run:

  • Ads created for brand awareness
  • Ads providing a limited offer
  • Ads providing discount coupons
  • Call campaigns having direct business phone numbers
  • Video campaign showing a demo of your product

eCommerce Websites:

In the general flow of eCommerce websites, users complete transactions on the website, and CRM records post-sales activities. Users might return the products they purchase call up at the call center for some assistance; & provide feedback through an email survey. Let us list down a few common attributes that are available for a user in Google Analytics as well as CRM.

Google Analytics

  • The marketing channel that brought the user
  • Number of sessions
  • Average time on the website
  • Products views
  • Demographics
  • Geographical information
  • Device information
  • Last transacted

CRM

  • User loyalty
  • Goods returned
  • Customer care rating
  • Email survey feedback

You can create smart remarketing lists for

  • Users with high user loyalty.
  • Users who have browsed products after refunding a transaction. (They had an issue with a specific product but do not mind purchasing a different product)
  • Users who have added products to their cart and are in general happy with customer care service. (Users are already happy with the service and just need to be slightly pushed)
  • Users from metro cities with decent email survey feedback. (Their feedback shows that they are happy and being from metro we can try doing an upsell)

Here are the different types of remarketing campaigns that you can run:

  • Ads creating brand awareness
  • Ads providing discount coupons
  • Ads showcasing 24×7 customer support
  • Video ads showing product features

Here we have understood the different scenarios under which a user can be retargeted.

However, the key here is an integration of GA and CRM. The steps mentioned below show how can you integrate and create a remarketing audience, though it might involve a bit of support from the technical team.

1. Preparation for Integration-

The primary requirement for GA and CRM integration is the availability of a common key between the two data sets. This can be done in either of two ways: -

a. Expose the CRM ID onto the website and pass it to GA as a custom dimension.
b. GA generates a unique Client ID for each unique visitor. Pass this Client ID to your CRM for every user.

The first approach requires a very small implementation update to expose an ID to the front end (as a hidden field). The second approach requires a change in the CRM API and adding a field in the CRM database to store an additional field. Thus, the first approach is comparatively easier than the second one. Alternatively, if CRM ID cannot be exposed to the front end, then a phone number or email address can be hashed to generate a unique ID that can be sent to GA.

2. Uploading CRM Data into GA-

Once a unique key has been set up in both systems, we then have to upload CRM data to GA. To do this, there are two methods, (1) the Data Import feature and (2) sending Measurement Protocol hits.  There are a few limitations also for each of these methods. These methods have been explained here.

Depending on the exact use case, the implementation team at Tatvic has designed a few workarounds and automated the implementation process.

3. Create GA segments for verification-

Once the data has been uploaded to GA, create segments in GA and verify if the number of users in the segment is equal to the expected number of users that need to be remarketed

4. Build an Audience list-

Once the above verification step is done, we can export the same segment to Adwords/DoubleClick as a remarketing list. Once the list gets synced and sufficient audience size is achieved, campaigns can be configured, and remarketing can be started.

Also, keep in mind:
1. For Google Analytics premium clients, BigQuery can also be used to identify user segments.
2. Remarketing list creations for Google Display Network(GDN), Doubleclick Bid Manager (DBM), and Search Ads (RLSA) have their own limitations in terms of the time period within which a user can be added to audience lists.

Data sent via the measurement protocol can be used to trigger RLSA list addition only if it is sent within 6 hours of those users’ most recent visit. In addition to a display remarketing list, the data must be sent via the measurement protocol within 10 days of those users’ visits.

To summarize, our experts at Tatvic have created online remarketing campaigns by combining GA and CRM data for our clients, which has helped them in generating new business and in turn increase revenue.

For more information, & assistance on integrating your CRM with GA, drop us your details in the comment section below. We will be glad to assist you!!

How to make tagging plan for Google Analytics|Google tag manager

tagging plan for ga/gtm

A Tagging plan is a running document that web analysts and implementation teams use to keep track of data collected from respective web analytics tools. When starting some engagement for Google Analytics, many times, I have seen enthusiastic developers firing GA events everywhere and the possible claim being we are tracking everything, but when asked why it is getting tracked, most of them lack proper reason. The standard Google Analytics tracking code works great for basic tracking. And most online businesses can benefit from careful planning and using advanced tags, such as Events or Custom Variables, Custom Dimensions, etc. Documentation in such cases is very very important to keep good control over your web analytics tool.

Why A Good Tagging Plan Is Important?

1. Data Quality & Testing

All your great data analysis & reporting is a function of good data. Good data will enable your team to take fruitful(in our case ROIData Quality generating) data-based decisions. As a web analyst, I see this as a huge win for carrying out other heavy-duty analyses.

In the absence of good documentation support, what tags are firing, and what data points are collected will not be coherent. Often as an analyst, you will not know/remember what tags are firing on what page and eventually, lose the track of data collected and its meaning.

Moreover, with a good tagging plan, you can use tools like Hubscan to make it easy for tools to carry out automated testing of data collection & improve the quality of data collected by Google Analytics/Adobe SiteCatalyst.

2. Smoother Entry To Your Analytics Team

A good tagging plan ensures that every analyst/developer within the organization will know which tag fires on what pages related conditions for it.

This ensures smoother entry for any new analyst. Quite often analyst would have backgrounds in statistics & data analysis theoretically but not how to practically carry out data analysis and what tools or techniques facilitates the same. This sort of plan helps them understand what data is available and how they can make use of this data for their analysis.

3. Agency CollaborationAgency Collaboration

When you have many agencies working for you on different campaigns, having different teams follow one standard practice of data collection is of huge advantage. With a good tagging plan & standard guide, you can just ship it over to the agency that is launching a new site so that the Agency IT team exactly knows what are they supposed to do for different tags.

What Is The Content Of a Good Tagging Plan?

1. Analysis And Regular Reporting

A tagging plan must have background information on what analysis & reporting is required. This way tagging plan can ensure that the required data is being collected in the desired format. A tagging plan must have report samples and current & future analysis planned so that data collection is smooth.

2. Coverage Of Domains, Pages

A good tagging plan must have coverage defined in the form of which all domains a given tagging plan covers & what are pages (URI)are covered for customization. This should be generally in the form of a spreadsheet that has at least the following details.

3. Naming Convention & Standards For Custom Implementation

A standard naming convention helps in ensuring that the data collected is consistent across multiple sites. For e.g. when we work with clients, we have following global rules that we follow:
a. Never use space in passing values
b. Always use lowercase values for variables
c. Always use names with less than 30 characters
d. Always use names rather than IDs (e.g. use product name vs. product id)

When such global rules are set as an analyst, it is easy for a new developer to develop new tags, or a new analyst to start a new analysis project.

4. Configuration Details

Often what & how your data is available in your web analytics tool is decided by some configuration parameters e.g. if you use filters & profiles in Google Analytics, you can see the entire URL of the page vs. the path that you normally see in content reports. Having a centralized repository for knowing the configurations, helps analysts to know in exact detail as to what data he/she is seeing. Generally, to start with Google Analytics it should contain the following:

List of goals & the URLs associated with it
List of profiles & associated filters with a purpose for each filter/profile
Settings summary (different settings for GA)

5. Campaign Tags

Most successful online businesses run a variety of campaigns e.g. AdWords campaigns, email campaigns, and publisher-driven campaigns. Very likely these campaigns would run via different agencies or different internal teams. But data collection happens at a central place i.e. your web analytics tool. To ensure that all the campaigns are tagged properly so that campaign ROI is successfully measured, it is imperative that your tagging plan includes the details as to how different campaigns should be tagged. If you are using Google Analytics, this boils down to how you use the UTM parameters to track different pieces of incoming traffic to your website. A generic policy that we use is as follows:

Medium: This should be the simplest way to describe the general channel being used to draw visitors.
CPC (as a proxy for “paid search”), display, content-text (for contextual text ads), social, email, affiliate, pse (product search engine), video, local
Source: This should be a clear indication of where the traffic originated from. Should not include www. or .com (for consistency)
Campaign: Should describe the common feature(s) of a marketing effort, such as the name of the media campaign, target audience or geography, or the desired outcome
Content: Should provide any additional valuable context that could be used for optimization: ad copy and format, time sent (for social media or email), etc.
Term: Should only be used for paid search, but could include category targeting for display

To automatically append bulk URLs with these parameters, you can use this tool.
How to Google Analytics Calendar Heatmaps?

visits

As a data analytics consulting firm, we think we are fortunate that we keep finding problems to find. Recently my teammate found a glaring problem of not having any connector for R with Google. With inspiration from Michael, and Ajay O, it soon becomes a worthwhile problem to solve.

With the RGoogleAnalytics package now, we have solved the problem of data extraction into R from Google Analytics a new breed of ideas started emerging primarily around visualization. I have been playing with GGplot2 has been a great package to convert data into visualization. Thanks, Dr. Hadley Wickham. Once you have followed this blog post, you are with the code there in a position to have the data required to get these calendar heatmaps done. Take up the below-given code and paste it into the R console and play around to see if you find it easy to work thru. If you have trouble, feel free to reach out to us.

Here is the code for extracting the Google Analytics data using the R-google Analytics package. Before running the following code, download the RGoogleAnalytics package and install it.

#Load RGoogleAnalytics library
library("RGoogleAnalytics")

# Create query builder object
query

For this example of a Calender heatmap, I am using data from an e-commerce store with data for more than 2 years in business. I will be plotting visits as well as transactions on the calendar so that I’d get perspective on how they interact viz-a-viz timeline.

Here is the code for plotting the heat map after you get data and have it stored in ‘data’. This frame is used to reference the source of data for the visualization below.

# Recommended R version - 2.15.1 or higher 
# install required  library by using the command install.packages(“libraryname”)
# For example install.packages(“ggplot2”)
# Required library
library(“quantmod”)
library(“ggplot2”)
library(“reshape2”)
library(“plyr”)
library(“scales”)

# Set extracted data  to this data frame
data

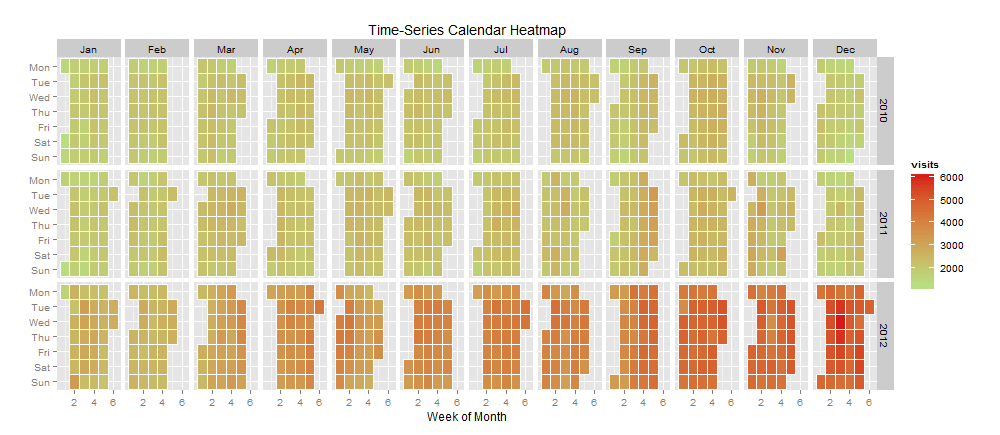
Once you run the code, you will be in a position to get the output like the below:

Now that we have a calendar heat map for visits, let me pull it off for transactions. In the above code for Google Analytics data extraction, you have to use transactions as well as visits as metrics. Since the data is already available in the ‘data’. we are ready by changing in code of visualization to choose the heat map for the transaction now.

It’s quite interesting now that you can make super nice inferences as I did below:

  • Tuesdays have high visits days but Wed has been the day when most transactions occur.
  • Visits increase towards the end of the year (shopping season) and then slow down towards the year’s start.

Visualization is an interactive process. Based on the feedback received from some of our readers, I tried plotting both KPIs on the same graph. With ggplot2, it was as simple as adding a line of code. Again some minor tweaks in the background colors and we are ready with another heat map.

ggplot(data, aes(monthweek, weekdayf, fill = visits)) +
 geom_tile(colour="white") +
 facet_grid(year~monthf) + 
 scale_fill_gradient(high="steelblue",low="white") +
 theme_bw() + 
 geom_point(aes(monthweek, weekdayf, size=transactions,alpha=transactions),color="firebrick") +
 theme(panel.grid.minor=element_blank(), panel.grid.major=element_blank()) +
 labs(title = "Time-Series Calendar Heatmap") +
 xlab("Week of Month") +
 ylab("")


Would you like to understand the value of predictive analysis when applied to web analytics data to help improve your understanding relationship between different variables? We think you may like to watch our Webinar - How to perform predictive analysis on your web analytics tool data. Watch the Replay now!


How to do Shopping Cart Analysis for E-commerce Websites?

item_revenue_in_rs

Of late we are working a lot on predictive modeling for e-commerce data and implementing interesting ideas using GA. Lot of our analysis leads to one conclusion that the lower end of the funnel is almost always presents lot of opportunities for improvement.

One of the other interesting problems that we encountered was to connect with the product manager who is interesting in optimizing the inventory and making sure that he learns usage patterns at a lower end of the funnel for different product. To tackle this interesting challenge, we had to get lot of data for products SKUs & have user action as metadata for these SKUs.

Data collection

We added following four interesting user actions on product page of an e-commerce stores, with the purpose to get a uniform metadata around product. The way we used the Event tracking here was

_trackevent(category, action, opt_label, opt_value,opt_nointeraction)
nomenclature : _trackevent(pp-product view, gender,product code+brand,price,true)

which can be converted into sample code that can potentially look like this ;

_gaq.push([‘_trackEvent’,’pp - product view’,’women’,’abc12332423’,’1999’,true])
  • Product view
  • Add to Cart
  • Feature selection
  • Wishlist addition

This can easily become a standard to use when user adds product to cart, or selects a color or adds a product to wishlist.

This way we extracted metadata of products along with additional metrics for the product to help product manager gauge what’s going on with the lower end of the funnel, which typically comprises of cart & check out pages.

If you have done several e-commerce implementations you can clearly realize that this method can provide very effective metadata for each product, in form of categorical variables like ,which gender it is aimed towards, brand & action occurring on this product (i.e. view, add to cart, feature selection, wishlist addition). The other additional ordinal variable data that is possible to beget is time spent on product , views, unique views, etc.

We also added similar type of event tracking implementation on cart page, which effectively also helped us provide product metadata

_trackevent(cp-product removed, gender, product code + size+brand,product proce,true)

That eventually translates into values like  below:

_gaq.push([‘_trackEvent’,’cp - product removed’,’men’,’xyz10234’,’1500’,true])

At the end of this implementation you would stand gaining such a beautiful set of data that you can do wonders with. Click on the image below to see the larger version of data yourself.

Product revenue table[click on image for full-size image]

Above data clearly will help to establish a relationship of each individual products revenue with its # of instances of cart addition, # of instances of removal, # of instances of view as well.

Using this dataset, we can create a visual representation of how the relationship between product views  & product revenue exists as below, thanks to ggplot2 & R

item_revenue_in_rs

All the products which falls in the area of above the curve, ie. High product views but low on revenue, needs work to be done. For such products a different strategy may be required, may be a specific campaign or a discount or something, but these are those products which are getting viewed but not bought.

Additional research can also be done to check what the relationship with product views is & cart add like below:


Cart add unique view

Dots in above chart represents # of people viewed the product vs. # of people added it to cart. Clearly, there are products which people are not adding to cart and require further research as to whether it is due to price, or shipping or competitive pressure that people are not considering to add this product to cart.

In the next post, I’d describe a linear relationship model that is able to predict the quantity of product sold based on factors such as views, alerts set, wishlists etc.

Shopping Cart Value Vs. Page Depth in Google Analytics

Page depth vs Cartvalue

I have been quite interested in machine learning and how the data visualization is expanding using different machine learning languages like R & Octave.

In a recent e-commerce project, one of the needs was to understand how people add & remove product to the cart. The more important question is how often & when the engagement with the site leads to the increase in the cart value.

To understand this we had added to the custom variable which contained cart value that gets fire on each page. That seems like below:

var _gaq = _gaq || [];
_gaq.push([‘_setCustomVar’,
2, // This custom var is set to slot #1. Required parameter.
‘cartvalue’, // The name of the custom variable. Required parameter.
‘0’, // Sets the value of ‘Cart’ depending on status. Required parameter.
2 // Sets the scope to page-level. Optional parameter.
]);

Above code ensure that a custom variable will fire a call on every page containing value of the shopping cart at a given page.

And we had page depth which is a pseudo indicator of how people progress towards the site.

To understand the relationship between cart value & the page depth, we extracted following data i.e. what is the value of page depth & cart value for different visits.

The data looked like below:


Relationship between cart value & the page depth

(note: we are using R & ggplot2 to analyse the data)

If we plot the chart with page depth as horizontal axis & cart value as verticle axis, It summarizes that after page depth is  20, cart value increases but after 30 till 40, the rate of increases is significantly faster. Also if you notice the brown colored cover around the line is an indicator of variability at that point in axis.

Page depth vs Cartvalue

Interestingly when you plot this chart along the actual revenue vs. page depth chart, you start seeing the difference.  Addition to the cart is a happening after 20 page depth but that doesn’t seem to be translating to the actual revenue.

Page depth vs Cartvalue 2

So is it to conclude that lot of products are getting added to cart after specific amount of pages being viewed but that doesn’t get translated into revenue?

I’d differ here as I unearthed more  relationship of pagedepth & visits as depicted below:


Page depth vs Cartvalue

The drop if you see from 5th Page depth to 20th is significant but that is not as fast a drop that you would see in revenue when you do this. This means that the visitors that are between 10-30th page depth are best of your visitors who are great at getting themselves converting from browser to buyer.

50 Custom Variable For Google Analytics Premium

Recently, Google released an upgraded version of Google Analytics as “Google Analytics Premium“. We had been following some conversations on Twitter about it and have been speaking to clients about important features of premium. One of the key features that users of Google Analytics Premium are going to enjoy is having the ability to use 50 custom variables.

This if implemented well, can save tons of hours in analysis, and reporting. IMHO, this is probably the most valuable feature of GA premium compared to other features more shiny features. (if you disagree, feel free to shout out) During several conversations, it struck me that a lot of analysts would have a hard time figuring out how they can use 50 custom variables and I thought it would be great if I just put down, how would I use it in standard ways for different categories of websites. i.e.  E-Commerce, Lead Gen & Content.

Therefore, I am starting a blog post series to explain how best to use 50 custom variables in Google Analytics for an e-commerce site, and in the following weeks, would talk about other types of websites.

As we are aware there are three different types of custom variables available:

Visitor Level: Used for tracking interactions of a visitor across multiple session

Session Level: Used for tracking within session activity of a user.

Page Level: Used for tracking page-level activities ie. Button clicks etc.

All custom variable keys & values are stored in cookies and they expire at different times. For e.g. Page level custom variable value gets expired when the user moves to the next page, visit level gets expired when the visit is ended.

Here is the starter list of custom variables for Page Level:

  1. Page type:
    Name the type of page. You can track different page types. One way to do it is to use the research that Gary Angel & team researched on functionalism.
  2. Search Results Rank:
    For all the e-commerce sites, this becomes vital to understand how the internal site search is performing. There are ways to do it, but knowing the search ranking of your internal site search would tell you if you need to tweak there or not. I also had an old blog post on the value of internal site search if you may want to review the importance of it.
  3. Wishlist ID:
    If you have a wish list, you should capture its id there to help measure which products are being added to the wish list. You can have the wishlist ID & the SKU as key-value pairs respectively.
  4. Product View - Product SKU:
    An extremely important data in e-commerce that gets frequently missed is product conversion rate. i.e. ratio of product purchase to product views. The key value pair here could be product view & SKU or product name.
  5. How much % of the total page, the window is viewing:
    A lot of time, you need to understand how much scroll users are doing as most of the time users would not be scrolling down and some of the important communications that are in the second fold of the page get ignored. The key & value pair could be oc-<url of the page> & % of page viewed. You can use some of the nice plugins like this(need to find the link) to achieve this or use analyticsengine.net to get it done. This should be page-level. Here is a good resource to get started
  6. Product Category:
    Product category should be tracked to understand the relative popularity of a given category and since this is tracked only on a category page, the key-value pair could be product-cat & category name/category id.
  7. Variation/Size of Product:
    Often lifestyle stores would have additional items that a visitor needs to select. For example, size in the case of clothes/shoes. This should be an onclick type of call that should fire setcustomvar function.
  8. Color of the product:
    Again this is more applicable for lifestyle e-tailers, but significantly important as different colors can fetch different pricing.
  9. Filter Type/Sort By:
    Often on a category page or similar page, your e-commerce stores may be displaying products in the default way, but you may have the functionality to display prices from low to high or something similar. You must track if there is a change in the filter. Key Value pair could be filter type-> values in dropdown.
  10. Internal Promotion ID:
    A lot of large websites have multiple sites, and multiple divisions owning different web properties. If there are internal promotions that are carried out, you need to track them specifically. The key value pair here could be IPID & nomenclature that is used for internal promotions.
  11. Cart Add -Product SKU:
    A brilliant understanding of shopping cart behavior could be possible when you understand how many & which products are added to a shopping cart by users. The key value pair would be cartadd & product sku/product id/product name.
  12. Cart Remove -  Product SKU:
    Similar to the above, it would be a great understanding to learn which products are being removed from the carts and what do people after removing the cart. A key-value pair for custom variables could be cartremove & product SKU/product id/product name
  13. Cart View - Product SKU:
    Another super duper dimension that you can generate with the Cart View is to understand how many times the cart is viewed without another product being added. A key value pair here could be cartview & product sku/product id/product name
  14. Add to Compare - Product SKU:
    If your website is having comparison ability, you have to understand which SKUs are getting compared the most & you need to track this information.
  15. No.of Search Results:
    Google Analytics has great tracking abilities for internal site search; however, one critical thing to understand is # of search results for a given search within the site. When you see 0 results or fewer results for any keywords, that will be a great pointer to understand. A key value pair could be SR count & integer displaying no.of search results.
  16. Product SKU- Product Ratings:
    If you are using services like Bazaarvoice or similar which provides product ratings, you should track it to understand if there is any correlation between higher product ratings & increase in the revenue of the product which I believe there is. A key value pair would be rating & SKU/product id/product name.
  17. URL - Action (Print, Share, Email, Favorite ):
    This is very subtle, but a lot of product pages have a few actions that some of the users do perform that are not social in nature, but important to know. They are generally, printed, shared, emailed, or mark it as Favorite. To track this the key-value pair could be the URL & action name.
  18. Discount % on the product page:
    If you are offering a discount you should track it to understand how different discount works. The key value pair here could be product SKU & % discount.
  19. Product Brand Name:
    It has been very interesting to know the X & Y dimension of any links that being clicked. You can always identify where on a page the link is placed has a higher likelihood of getting clicked. The key could be the Link location & value could be x & y coordinates. If you are selling products of different brands, and you would like to know which brand is more popular, you should have key-value paired with the brand & values of a brand name that exists on the product page
  20. Link Location on the page:
    Most of these are suggested as page-level variables but you can have at least some of them used as visit levels and have it expire on the transaction page as well if you want to. There are benefits to it and disadvantages as well, but I’d talk about them at some other time.

Visit level Custom Variables

  1. Coupon used:
    If you are a heavy player on coupons, you ought to understand how the coupons are used. Are users just redeeming or also purchasing after redeeming as well. The key-value pair could be coupon - coupon_name+discount.
  2. No.of browser Plugins:
    If your target market is technology-related website visitors, it would be interesting to understand their browser usage via how many plugins they have downloaded. With this script, it tells me that I have 18 plugins installed, and I am fairly technical so you classify, how many users with strong technical backgrounds visited your website. The key value pair could be no.of plugins & integer value coming out of that script.
  3. Local hour of the day:
    The hour of the day report in google analytics reports at what hour (“from the standpoint of your timezone”) how many visits have come or how many leads / Revenue has been generated on a specific day in an hour. However, what you need to know is the visitors’ local time. So if you are in New York, it’s 1 pm, whereas, at the same time you are in San Francisco, you would have 9 am coffee. You need to understand, what’s the local time when people buy your product, irrespective of what timezone they are in. This will provide a huge understanding to you about your user’s buying patterns in terms of when they buy. Key Value pair could be local_hour & integer representing the hour. Further, you can also have value as morning/afternoon/evening/night defined based on different values of the hour for further simple analysis.
  4. Currency
    Often if you have a store that sells to more than one country knowing which currency the user bought your product with is more important. You can set it as a visit-level custom variable to be expired at the end of the transaction & start it to be populated when the user is seeing a product page.
  5. Recommended or normal product view
    A lot of e-commerce stores have the ability to show product recommendations, Most web shop owners don’t realize how much important it is for them. Placing a custom variable to know whether the product view is recommended or not, helps a lot.
  6. No.of bookmark items in the browser:
    # of bookmarked items provides the information about maturity of the user. The more items bookmarked, the more mature the user is & more likely to share your content.
  7. Google Search Results Position:
    There is a nice little nifty javascript available again by John Doherty & Michael King here which helps you to figure out the actual search results position in the case of Google. There are surely other ways as well, but important is to get this position figured out quickly.
  8. Shipping Method:
    The shipping method provides a highlight into what kind of shipping method is more likely to be used by users. If you are considering free shipping, you can also revise the workaround to get this going.
  9. Payment Type:
    When users are presented with different modes of payment, it is very likely that these different payment methods cost you different charges associated with them, but knowing which payment method brings different volumes would yield, huge insights on what kind of plan to choose for payment type.
  10. No.of Cart Items:
    At any stage visitors if you know the # of items present in the cart is an interesting fact to know. It also helps to figure out how users add the second product to the cart & how long it takes them to do so. You may have to rewrite some cookies here if you choose this as a session variable.
  11. Value of Cart Items:
    Related to #30, if you know the value of cart items during different visitor activities, it helps you identify, what is the avg. wallet-size users are willing to shell out for your products.
  12. Minutes to Complete Purchase:
    It would be interesting to know & to evaluate the effectiveness of webpages leading to product pages to understand how long it takes to have a user complete the purchase starting from a session. If you see that it takes less than a minute for users to finish it, you might want to break it down by a count of visits to see if these are repeat visitors who are just coming back to buy something that they already have planned.
  13. Minutes to add the product to the cart:
    Similar to #32, it would be a great help to understand how long it really takes users to add a product to a cart. This information measures the effectiveness of category pages & product details pages.
  14. Shipping City:
    Knowing the shipping state & if broken down by city helps you figure out whether users are buying your products for themselves or they are buying for others.
  15. Product Stock Status (in stock, out stock)
    Quite often when a product goes out of stock a webmaster would get a notification & it would be taken away. A smarter way is to keep it there and add a couple of lines “Notify me when this is available”. When you track such things you are aware of the popularity of some of your products that are out of stock.
  16. Name of Product Manager/Brand Manager:
    For large corporations, different sets of web properties and products/brands are handled by different brand managers. Even product promotions have different strategies. At the end of the day, it boils downs to a single person. Brand Manager/Product Manager. To know how effectively the web has been used by the brand manager & compare it with others, you may want to put the Name of the product/brand manager in the custom variable of course abbreviated.
  17. Product Margin type (high, low, medium):
    Different e-commerce products have different margins knowing margins and how users react to products with different margins, would be a huge insight for a web analyst to promote different products. You don’t necessarily have to add the exact % of the margin just keep it at high, medium & low.
  18. Day type (weekday vs. weekend):
    There are products that get sold on weekdays Or a few products, especially on weekends. Most people do not know about it, when you break this information with what has gotten sold or what’s the revenue proportion between weekdays or weekends, it would help immensely in devising new product launch strategies. You can also append it to have information on whether this day is a holiday or not to understand if your product is bought more when people are at work or whether it is bought when people are at home.
  19. Location Type (metro vs. Non- metro):
    Geography, when classified appropriately, i.e. metro area vs. non-metro area, it helps to figure the difference in avg. order value. You can change your Adwords strategy based on it.
  20. Market Type:
    Most large companies have their own defined market types, done in a variety of ways that are beyond my imagination. Having market type placed in Google Analytics would help to measure market type performance within Google Analytics itself.
  21. Deal of the Day:
    Most e-commerce sites these days offer the deal of the day, knowing that this product is sold via the deal of the day will help you figure out what kind of products to be offered for the deal of the day. The same strategy of measurement can be used if you have a deal of the week instead of a deal of the day.

Visitor-type custom variable

  1. Visitor ID:
    Hugely important if you are doing some custom analysis or prediction for data collected, having a primary key is of utmost importance. However, as per TOS #7, you can not use it to match it with any personally identifiable information of users.
  2. Registered/Non-Registered User:
    Lots of times, you have buyers who may have registered earlier, but now coming back to buy a second time. If you are doing some analysis like, customer life cycle value, categorizing visitors based on registered or non-register would be hugely helpful.
  3. Password reset:
    Sounds very trivial but to me, it’s most important. These days, people don’t bother to remember less than a critical password, if a lot of users are sending reset password requests, this might be alarming to you might want to consider guest checkout or may be signing up with Facebook.
  4. Buyer Type (new buyer vs. returning buyer)
    You can always have data about whether this visitor is a repeat visitor or not, but it’s seldom the same as a new buyer vs. returning buyer. The new buyer is the one who registers with you to buy the product whereas returning buyer is the one already registered with you to buy the product. You can have more criteria to decide whether this is returning buyer or a new buyer, but whatever they are, an important fact is, you have to know whether this transaction is by a repeat buyer or a First-time buyer. What this essentially means is that you ought to have a better methodology to identify a repeat buyer than just Cookie 🙂

Got it, so where does the rest of the 5 other variables exist? I thought hard about it and realized that if you have read this far, You would have certainly a few ideas that I couldn’t think about, if you do, share them and we can make the rest 5 custom variables together :)!

Hope you enjoyed it! let’s give a few more custom variables to the next reader 🙂

Google Analytics Blog: Introducing Google Analytics Premium

Launch of Tatvic Google Analytics/Adwords Excel Plug-in Version 2

I am extremely excited to announce the v2 of the Tatvic excel plug-in. We have been working on it for so long and it’s a great feeling to see it getting light in the real world.

In this blog post, I want to pass on some key features that we’ve built over some time.

More APIs = More data

We are now offering the ability to extract data via Adwords API, Keyword traffic estimator on top of Google Analytics data export API. We wanted to remain in the direction of Google Analytics as it firmly integrates with Adwords. You will, however, need to have an Adwords API token and you can only use it for an MCC account though.

You can watch an example of how you can extract keywords data via Adwords API below:

How to Extract data from Adwords API?

You can moreover, extract data from the keywords estimator tool as well. This is the first application in excel which can get you data from the Keyword estimator to understand how much traffic you can get if you go ahead with a specific keyword.

How to Extract Data from Adwords Keywords Estimator API?

Save/Share query:

With the new google Adwords excel plugin, it’s easy to remember a set of inputs that you provided to pull out specific reports so that you can reproduce them or share them with your colleague. We are also working to add a few more APIs e.g. SEOmoz as well but haven’t matured it as yet. If you have an opinion on what other APIs we should be adding to the excel integration, please feel free to reach out to us. Your opinion is most valuable to us.

Bot Icon
Bot Icon

Tatvic Bot

Explore About Tatvic and Services