Hello There!

Lorem ipsum dolor sit amet, consectetur adipiscing elit,

 About Ravi Pathak

Ravi is the co-founder of Tatvic and expert at managing different web analytics tools. Ravi actively works on conversion optimization projects to improve conversion rate and test newer hypothesis with e-commerce companies.

Challenge to Online Marketers

Working at a web analytics company we have find an interesting pattern of customers and especially those who are decision makers.

Decision makers are alone. They know inside themselves, that there is no perfect world, online or offline. If you face following questions, read along!

  • You fear that you are making decision based on wrong data collected via Google Analytics/Omniture.
  • You don’t trust the data as well as your manager, even if analyst makes hardest effort to convince?
  • You cannot make decision & delay taking a decision since on your google analytics/Omniture data just doesn’t have what you need?
  • You pay for incredibly large amount $$ for Google Analytic/Implementations implementation and don’t know what decision you can take?


I say “Welcome to the show” - You are not alone. Its Act 1.

Web Analytics tool implementation is sub optimal

Over last several (6years), I have been involved in Google Analytics & Omniture Implementation a lot. Quite a bit of the time, it involved cleaning up the Google Analytics/Omniture implementation done either by agency or client on their website/e-commerce store. A huge learning that we recently relayed internally was the fact that, most of the time either implementation was erroneous, either it lack action-ability , or may be even mistaken. This happened in 85% of the cases of implementation when Google Analytics was implemented by non-GA expert.

Problems with Web Analytics Implementation were not known

However, this problem is sub-optimal implementation of Web Analytics tool is both not known, not identified, well enough. Its normal that if you don’t know the problem, you are less likely to know the impact & you are not going to make any effort to solve that problem.

Challenge to Online Marketers:

Lot of people including you, my reader, may feel above two paragraphs are not right & doesn’t represent your situation as Leader in Analytics in your organization. Great!!

Why don’t you do act 2 then. Here is the challenge.

Show the world what actions did you took which helped your online business. You can be discreet & okay not to disclose the actual figures, but come forward & show the world that whatever was the analytics, you took decision & the online organization was benefitted. I am not saying that it is not possible to take good business decisions based on Google Analytics, I am just saying that its rare.

Comments section is yours. Do you second act my friend!

Okay if you cannot! It’s time to roll up your sleeves and carry out the Google Analytics Audit /Omniture Audit. If you need how to do it, sample reports, download free from Audit section.

Looking forward to Act 2.


Web analytics, web synthesis? or both

I was wondering where the term analysis stem from ? It seems it stem from Medieval Latin, from Greek analysis, which means a dissolving, around late 16th century. Then it was floated for specific disciplines , like chemistry, political science etc. In other words it means “resolution of anything complex into simple elements”. The best word definition that I got from Princeton university suggests either of following or a combination of it as meaning of “Analysis” :

1. the abstract separation of a whole into its constituent parts in order to study the parts and their relations [ant: synthesis]

2. a form of literary criticism in which the structure of a piece of writing is analyzed

3. the use of closed-class words instead of inflections: e.g., ‘the father of the bride’ instead of ‘the bride’s father’

4. a branch of mathematics involving calculus and the theory of limits; sequences and series and integration and differentiation

5. a set of techniques for exploring underlying motives and a method of treating various mental disorders; based on the theories of Sigmund Freud; “his physician recommended psychoanalysis” [syn: psychoanalysis]

Boho ! that’s so much of theory ? How does it matter to me ? a web analyst ? or web analysis ? Hang on !

My gut is If you are doing web analysis that means you are doing either #1 through #5 or combination(s) of it.

The platform on which web analytics or for that matter any analysis is based is Decision Support. You as a web analyst are here for decision support . You are required to provide help in making decision to your management. What management does is to me called “synthesis” which is exactly the opposite process to analysis. Analysis is breaking down a “whole” into the parts where as synthesis is understanding constituent parts of “whole” as pieces and their relationship to derive insight. You might be doing this already however, you may not be cognizant of the thinking process you are going through. Here is the process which I think makes sense and completes the full circle.

Its perfectly valid and possible that good analyst would be going this full circle, do we know this consciously ? do we go thru the process of “analysis” and “synthesis” separately ? do we need a separate mindset while carrying out these two separate mental exercise ? I don’t know , I will post if I come across. However what do you think ?

Tangled up in DeepLinking? Firebase has a solution!

Mobile Deep Linking

Deeplinks

DeepLinking

Deep Links simply help you merge the two different worlds of app & web. They allow the user to land on a specific screen or section in the app by clicking a web URL. The user can dive into the app seamlessly rather than fumbling on various pages of the website on mobile devices.

I was actually scrapping my head off when I first sat to implement Deep Linking. Do you also find Deep Links complex? Then worry not! Because there’s Firebase to the rescue!

Firebase is a platform that provides various tools and infrastructure to build better apps. One of its awesome features is Dynamic Links. With the help of Dynamic Links, we can set up Deep Links. This is actually the crux of this blog.

Now let’s put our heads together to learn:

  1. Why do we need Deep Link?
  2. How does Deep Linking actually work?
  3. How to implement Deep Link in your app using Firebase?

Why Deep Linking?

Let’s talk about a practical issue that everyone faces.
Suppose, you have an app installed in which you have already logged in.

Mobile Deep Linking

One fine day you receive an email regarding a tempting offer and you click on the link in the mail.

All it does is opens your browser in the mobile web asking you to login again. And then all you do is blurt out crap in frustration!

Deep Linking Android

Instead of the browser, the installed app should’ve opened, right? And that would be possible with Deep Linking.

Deep Links are also useful for promotional notifications as they take users to the most relevant screen in the App. That’s pretty magical, isn’t it?

How does Deep Linking Work?

Within a mobile phone and its native app ecosystem, the operating system uses a mechanism that allows any native app installed on the phone to register for a specific URI scheme.

A URI scheme will tell the operating system which app to open up when the URI is clicked.

Mechanisam

Mechanism of Deep Linking

For example, an app is listening to http://shop.www.tatvic.com/shop. If anyone clicks on this link, and an app is installed on the device then the app will open. If there is no app registered with this URI, then the link will open in the browser.

How to implement Deep Linking in android using Firebase?

To implement the Deep Link, you need to make changes in:

  1. The Firebase Console
  2. The Native coding in your android app
Firebase Console:

To work with Firebase, you need to first register your app with Firebase.
Post registration, add the following dependency for Firebase Dynamic Links to your app-level build.gradle file.

compile 'com.google.firebase:firebase-invites:9.4.0'

You can now proceed to create a dynamic link in firebase console. Here’s how:

  1. Open the Dynamic Links section by clicking Dynamic Links on the sidebar menu of Firebase Console.
  2. Click on New Dynamic Link and proceed to accord the basic details of the dynamic link in the form that appears on the screen, as shown in below image.

Firebase Android
Advance Option:

Use Advanced options if required, to add more attribute to our deep link.

Mobile app deep linking

Below are the optional fields that can be provided in your deep link.

Mobile app deep linking

Advanced options details for Deep Link

  1. This is the fallback link that will be fired if in case the Link set for deep link is not fired.
  2. Here, you can also provide a minimum version of the app that can open the deep link that is configured.
  3. This can use any link scheme if specified, it takes priority over the link parameter on Android.
  4. 5 and 6 are related to the campaign.

After you provide all the relevant details, just click the CREATE LINK button. The link generated will be as follows :

http://shop.www.tatvic.com/shop&apn=com.rj.firebasedemo&amv=4&afl=http://shop.www.tatvic.com/&utm_source=demo_source&utm_medium=demo_medium&utm_campaign=demo_campaign

Also along with the above link, a short deep link is generated which will be used in your deep link configuration, in the native app coding.

https://uw55y.app.goo.gl/?n9ro
Native coding in your android app

Now follow below steps for coding configuration in native coding part in android app also.

    1. In the intent filter of the activity (i.e activity of splash screen or main screen) that will handle the deep link, in Android Manifest.xml , append the following code.

Dynamic links Firebase

  1. In the java file of the activity, that will handle the deep link, append this code.

Dynamic link android

Now I would happily say that we have successfully implemented Deep Linking in the app!

But wait!!!

Don’t you want to know whether the configured deep link is working?
Well, here’s how you check it!

  1. You can send a long URL(Generated by Firebase console) to your device.
  2. Click URL from the device. Your device will either ask you to open the link in the app (if the app is already installed) or in the web browser. Preferably, you should opt for the app to test your configurations.

If the app opens up, pat your back! If not, then just take a nap break and follow up the steps again!
Before winding up with this post, I would also like to dispense an astonishing feature of Firebase. It automatically logs a few Analytics events of Deep Linking. Refer below screenshot for the same…
Dynamic link android

For any assistance on Deep Linking or Mobile App Analytics, please drop us a comment in the section below & our experts will be glad to assist you!!

Launched Multi Profiles feature for Google Analytics Excel Plug-in

How to update Tatvic Excel Plug-in

Recently, we had some excellent clients who have been demanding a unique feature that reduces the time for analysts who manages larger accounts with more profiles.

The request was to have the ability to extract multiple profile data within one query. The use case was:

“I manage about 38 countries’ dashboards within one Google Analytics accounting with 38 profiles dedicated for each country. I have to compare visits, time on site, etc all the time and the only way to do it is via creating many more queries in the Excel plugin- Is there a better way “

And we said “yes”. We figured that if we allow the country name to be extracted from the list of profile names written in Excel, we can pass that in our query and have it extracted from Google Analytics.

Here is a quick video representing the same.

In addition to this, we also have worked out a similar solution for the advanced segment. For e.g., if you have 10 advanced segments that you would like to compare for their performance against the same metrics, you can do the same as described in the above video for profiles.

As we continue to build more features, we are more committed to listening to ideas that you are looking forward to automating, please feel free to reach out to us if you have any feedback or feature requests for the Tatvic google analytics excel plug-in.

Note: To use this feature, you’ll need to update your Tatvic Excel plug-in. Here’s how to do it:

  1. Before logging in to the tool, click on “Check for update”.

    How to update Tatvic Excel Plug-in

  2. Click on the link that appears at the bottom of the tool.

How to update Tatvic Excel Plug-in

Done, enjoy the feature now.
Thanks again!

Internal site search Value- Do you need better internal Site Search Engine

internal-site-search-analytics

Its been long since I wrote a blog post, but It just becomes even more crazier day by day. I pushed myself hard to write and will get into the grove of writing more.

On Site Search - How it Works?

I just delved into internal site search usage this time. For those who are novice, it is a small search text box within your website, which a visitor can use (via search in a site) when trying to find something straight without delving into navigations. My purpose of analysis here was to do evaluate how internal site search as a website tool doing and is it producing desired results as expected by website marketer. So, I had Google analytics configured in a way that tracks site search so that was easy. Next step was to see very basic report as below.

See about 13.53% visits are with site search that means about 1,652 out of total 12,210 visits uses site search. Simple huh! Now let’s see how much it valuable is. See the screen shot for the internal website search usage report below in Google analytics.

The metric you use is per visit value. That is if yours is an e commerce website, the value of that metric is a ratio of total revenue generated from the visits with (or without) site search divided by visits for those respective site search statuses. What it basically tells us is , those visits which uses site search produces about 10 times revenue for every visit than normal other visits without web site search. Bang! You don’t need rocket science now to do more analysis from here. Still let’s see some more. A straight thought to me is one should do multivariate testing for the placement of site search. Anyways so, our summary till now is about 14% visits uses site search and every visit which uses site search produces about $31 for the website. Mind that this is about 10 times than the visits that are not using site search so every visitor that comes to the site and searches becomes 10 times more valuable for you. Let’s see how our search function is filtering in people.

Web Site Search Analysis

Going back to the original first screen shot it appears that there are about 23.04% search exits. This means that for every 100, 23 visits are lost because they didn’t get anything from your website. So, basically, your lost for this given time duration is = % search Exits X visits using site search X per visit value = 23% X 1,652 X $31 = $ 11,800 Rings bell ? Yes, I know, you can avoid all the search exits, agree completely. So, you are not going to recover all of $11,800 always, but how much can you recover?

Now, this gives you a nice idea of how your current onsite search engine is doing. If it is ordinary and you think that it should give more result, then you can go for Google’s custom search and try and see if it decreases your search exits. It should be noted here that the search results doesn’t merely depend on the type of search engine that you have on site, however if you see lot of internal site search keywords that are letting people to exit, you should focus on building content so that user doesn’t get drop.

What is Product Bundling & Product Analytics and Some of its Examples?

What is Product Bundling?

Product bundling is unique and probably most underutilized way to increase e-commerce revenue of store. I haven’t seen many stores that uses this tactic to increase revenue for e-commerce stores. If you head over to our E-commerce Revenue Optimization Framework that I built recently, it is pretty evident that if you can increase avg. quantity per transaction, it can have a strong boost on the revenue of e-commerce stores.

I wanted to use this article to explain some of the new practices are coming to make customers buy more if they are deal seekers using product bundling:

Product Bundling:

What is Product Bundling?

A Product Bundle is basically a group of products that you offer to your users, mostly at a discount. It’s a nice way to encourage impulse buying and increase order value. When a customer is on a product page, you can suggest a bundle of products that would go well with that product.

It works as normal recommendations. In bundling, all products that you recommend have a relation and they are sold together. The hitch here would be, “why would people buy 3 products when we are not even sure that they’re not even going to buy one?

They will. Actually, they do.

We implemented Product Bundling with one of the customers of Liftsuggest. Within 15 days, his order value for the customers who bought bundles increased the order value from $160 to $182. We learned that about 3% of visitors who saw bundles actually bought them.

How does bundling work? How are these bundles created?

Tatvic’s recommendation engine can be implemented on your shopping cart. It will analyze your website’s customer’s behavior using data from Google Analytics. It creates groups of users from the analytics data, and creates bundles based on which products are being bought together for the most of time, within that group. Then it serves targeted bundles to each specific group of customers.

How does it benefit the customer?

Example of Product Bundling

The customer has to see value. Here’s one of the 3 reasons a customer will consider buying the above bundle:

  • She sees a huge saving
  • She loves the product combination you are offering as a bundle
  • Both of them
How does it benefit the vendor?

If offered discounts, the vendor has to lose some margin. He makes less money per product, but more money on the total order value. Also, sells more products. Find below 3 product bundling strategies you can use for your e-commerce store:

Product Bundling Strategy:

There are some bundling patterns to create targeted bundles that customers would like to buy.

1) Bundling main product with accessories

Product Bundling Accessories

Above is a perfect example of bundling main product with accessories.  An Indian wear is bundled with a necklace and a purse. The customer will buy this because she’s getting a matching set and with discounts.

2) Bundling main product with similar products

Example of Product Bundling with Similar Products

This kind of bundles will go well for books, apps, software’s, music and movies.

3) Bundling main product with different products

You can use this pattern to cross sell. E.g., A washing machine can be bundled with a microwave or a TV.

Product Bundling Tips:

Offer discounts

Bundle products together and give good discounts. The customer will see direct value and a reason to buy the bundle. In above image, “Best deal..” as a heading is a nice way to promote the discounts and attract customers.

Build urgency

When offering discounts, or showing a value deal, urgency can be built. to push the purchase. Again in above image, see this line, “Valid for next 4 hours”. It builds and urgency in customer’s mind, and pushes her to buy it right away. 

In this blogpost, we learned what is product bundling, how to begin with product bundling and few tips that will help you improve your overall product bundling strategy.

What is Shapley Value Fractional Attribution Model?


In the last blog, we have discussed the various attribution models available in most of the sophisticated analytics tools and we now know that considering the position and the frequency of occurrence of channels can be instrumental in designing an optimal attribution model. 

While there are many approaches to design this attribution model that leverages historical data for attributing conversion to channels, I have found the following two approaches to be the most efficient - 

  1. Fractional Attribution Using Shapley Value
  2. Multi-touch Attribution Using Markov Chain

In this article, we will be discussing the Fractional Attribution Using Shapley Value in detail.

Fractional Attribution Using Shapley Value 

As the name suggests the Fractional Attribution model uses the Game Theory principle - Shapley Value for attributing conversions to channels.

To understand the model in more detail, let us consider some more examples of channel sequences. For ease of understanding, we are only considering the total number of conversions from each channel. Later, we will extend the analysis to include the drop-offs from each channel sequence as well.
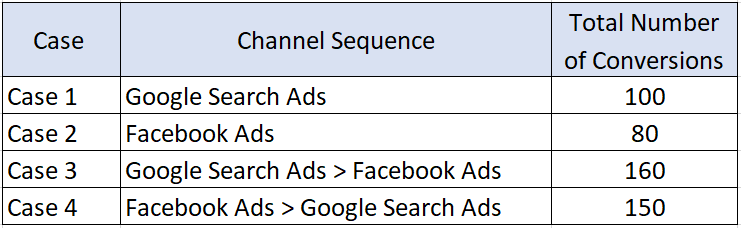
Here, the second column represents the sequence of the channels while the third column represents the total number of conversions from that sequence. 

If we analyze the given data now using the Shapley Value principle, For case 1, all the 100 conversions will be attributed to Google Search Ads and 0 to Facebook Ads. Similarly, for case 2, all the 80 conversions will be attributed to Facebook Ads and 0 to Google Search Ads. 

Now let us consider case 3, for this case, Google Search Ads is the first channel that the user interacts with and Facebook Ads is the second channel and there are 160 conversions for this channel sequence. Shapley Value will remember that Google Search Ads was able to bring 100 conversions on its own (from case 1) consequently, 100 conversions will be attributed to Google Search Ads and the remaining 60 conversions to Facebook Ads. A similar approach will be followed for case 4 as well and for this case, 80 conversions will be attributed to Facebook Ads and 70 to Google Search Ads out of the total 150 conversions.

From the table, we can see that for Case 3 and Case 4, even though we have the same channels appearing in the sequence and the total number of conversion are also the same. The conversions attributed to each channel is different for the two cases. Moreover, the attribution leverages data from Case 1 and Case 2 for assigning conversions in Case 3 and Case 4.

Creating A More Sophisticated Fractional Attribution Model 

In the above example, we have only considered the conversions from each channel sequence, a more sophisticated model would also consider the number of drop-offs (non-conversions) from each channel sequence. 

Let us try looking at the same example by considering the drop-offs from each channel as well.
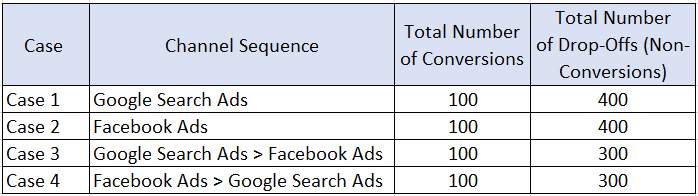
With this data, we will be able to calculate the efficiency or the probability of conversion for each channel sequence.
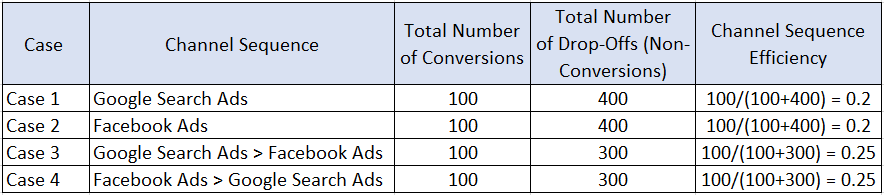
We may now again use the Shapley Value model and calculate the relative efficiency of each channel in the channel sequence -

Normalize the marginal efficiencies from multiple channels to calculate the fractional attribution to each channel in the channel sequence

From the table above, we now have the Fractional Conversion Attribution for Google Search Ads and Facebook Ads should they appear in a channel sequence. 

Let us now see how we can use these attribution values for assigning conversions to channels. Assume that from the latest data in our analytics tool, we have observed 500 conversions from channel sequence - Google Search Ads > Facebook Ads’ and 300 conversions from the channel sequence Facebook Ads > Google Search Ads’. The following table shows how conversions will be attributed to the two channels - 

Please note that we may also use the revenue from each channel sequence for calculating the ROI from each channel/campaign. 

There are some tools/packages already available in the market that works on the Shapley Value principle for attributing conversions to channels, some of these tools are listed below - 

  1. Data Driven Attribution Model in Google Analytics 360
  2. The Fractribution R Package By Google 
  3. Media Spends Attribution By Tatvic

Concluding Thoughts 

We have seen how the Fractional Attribution Model can help us in assigning conversions to multiple channels and multiple campaigns. Concludingly, I would like to highlight the key features of the Fractional Attribution Model -

  1. Fractional Attribution Model uses data for assigning conversions to channels, it is not a rule-driven model
  2. It considers the frequency of occurrence as well as the position of occurrence of various channels 
  3. It is based on a Game Theory Principle - Shapley Value’ and is not a machine learning model 
  4. There are attribution tools/packages in the market that works on the Fractional Attribution Model 

With these thoughts, I would like to conclude this article. In an upcoming article, we will be discussing the Markov Model in detail.

References 

Answering Every Marketer’s Dilemma - Which attribution model to choose? All about Fractional Attribution - Part 1

Working as a Digital Marketer, you would have definitely faced the above situation. Marketers in an organization will be running multiple campaigns across various channels, some of these campaigns will be aimed at driving brand awareness while others will be aimed at driving engagement or direct conversions.

A user typically interacts with multiple channels or campaigns before converting, consequently it is unjust to attribute the entire conversion to a single channel. 

Most of the sophisticated analytics tools in the market allows you to track the entire journey of your customers. These tools also have predefined campaign attribution models. Let us try and analyze some of the most commonly used models with the following sample user journeys - 

The Last Click(LC) or the Last Non-Direct Click(LNDC) is the most common attribution models used nowadays. The LC model attributes the entire conversion to the last channel whereas the LNDC model attributes the entire conversion to the Last Non-Direct Channel.

If we analyze the six user journeys using the LC or the LNDC models, we might end up reducing our spends on the Youtube Video Ad even though the campaign has been very efficient in driving acquisitions. Consequently, using LC or LNDC does not seem to be an optimal strategy. 

Another commonly used attribution model is the First Click Model(FC) which attributed the entire conversion to the first channel. We analyze the user journeys using the FC model, we might end up spending only on the Youtube Video Ads. Though the Youtube Video Ads have been effective in acquiring new users, the Ads have not been instrumental in driving conversion. Concludingly, leveraging FC model does not seem to be an optimal strategy either.

A Linear Attribution Model distributes the conversion equally among all the channels in a conversion path. If we try analyzing the journey for User F using the linear attribution model, The fractional contribution of Facebook Ad, Google Search Ad, and Youtube Video Ad will only be  (1/110) each in the conversion (110 is the total number of channels is the channel sequence for User F). The contribution of the direct channel will be (107/110) as the user has used the directly channel 107 times to navigate to the website. 

Even if we consider other attribution models such as The Position-Based Model or The Time Decay Model, all these models are driven by rules based on human intuition and not data. Moreover, none of the models considers the position or the frequency of occurrence of different channels.

Please refer to the article to know more about the various attribution models. 

We now know that considering the position and the frequency of occurrence of channels can be instrumental in designing an optimal attribution model.

In the next blog in this series, we will be talking about one of the most effective mechanisms for assigning conversions to channels based on the position and the frequency of occurrence.


Tracking AMP Pages with Google Analytics & Google Tag Manager

Tracking AMP Pages with Google Analytics

Accelerated Mobile Pages (AMP) are not a new concept. You must have heard about it, and worked on implementing it for your website as well in the last year and a half. For all those who are still discovering AMP, let me give you a very brief idea of what it exactly is. AMP is an open-source technology that allows your website’s static content to be rendered instantly on mobile devices. In simpler language it means that this technology is basically a stripped-down form of HTML that is meant to help the mobile pages load really fast, improving the user experience on mobile.

What makes it so fast? That is something that a lot of digital marketers and companies have talked about. Moz has done a great job explaining all that you need to know about AMP in one of their Whiteboard Fridays.

At the Google I/O 2017 conference, Google announced that more than 2 billion AMP pages have been published by 900,000 domains and these pages are now loading twice as fast resulting in a significant improvement in the traffic as well as the conversions.

Measuring the performance of such pages to be able to make constant improvements and derive actionable insights is critical and hence, in this blog post, we are going to focus on setting up the tracking of these Accelerated Mobile Pages in Google Analytics.

AMP & Google Analytics:

AMP allows us to track user activity in google analytics through the amp-analytics tag. You can track your AMP pages and user actions accurately in Google Analytics with and without GTM. The post is therefore further divided into the following two parts:

  1. Using AMP analytics library [Without GTM]

  2. Using GTM for Tracking AMP [With GTM]

Using AMP analytics library [Without GTM]

AMP doesn’t support javascript and so we, unfortunately, cannot use the analytics.js library to track AMP pages. Although, we can use the amp-analytics library which is provided by amp project.

<script async custom-element=”amp-analytics” src=https://cdn.ampproject.org/v0/amp-analytics-0.1.js></script>

Let us take a look at basic pageview tracking setup and event tracking setup for AMP pages in Google Analytics without any dependency on GTM:

1. Basic page view tracking:

To implement basic pageview tracking, the following code needs to be implemented on all the AMP pages:

Basic page view tracking

The above-given snippet should be implemented after the AMP analytics library code snippet. All you have to do is insert the property id of your Google Analytics and the page title value in the snippet. Once this tracking code is set up, your basic pageview tracking is implemented and you can start analyzing the basic performance of your AMP pages.

Additional tip: We can also take advantage of custom dimensions in Google Analytics for tracking AMP pages.

For e.g, I want to pass the author’s name with every pageview. As we do normally in Google Analytics, using the index value of Custom Dimension, we can start capturing the author name as desired. In the below-given code replace the author’s name with the actual author’s name.

Basic page view tracking

2. Event tracking:

Custom event tracking allows us to track detailed user behavior on the AMP Pages. To track events in AMP, use the tracking code given below:

Event tracking

Define the eventCategory and event action values as per your reporting requirements that you are looking to track in your Google Analytics. Furthermore, we shall also have to replace the

value of selector with CSS selector of that specific element which we want to track and if you want to track multiple elements, you can do so by inserting selectors with semicolons. We can also send noninteractive events in Google Analytics while setting up the tracking for AMP pages. To do so, we need to add the below JSON in the JSON of event tracking right after the vars key:

extra url parameter tracking

Using GTM for Tracking AMP Pages:

To get started, create a new container for AMP in Google Tag Manager.
new container for AMP in Google Tag Manager
Now, to add GTM on the amp, we need to install two code snippets on all amp pages as you can see in the screenshot below:
AMP Analytics tracking code integration
Now, let us take a look at the basic pageview tracking setup and event tracking setup for AMP pages in Google Analytics with Google Tag Manager.

1. Basic page view tracking:

Connect a GTM tag with addition of the GTM code to start with pageview tracking as shown in the screenshot below:

Add your Google Analytics property ID as the tracking ID in the UA tag. Add default All Pages pageview trigger as a trigger of this pageview tag and voila, you are all set to start tracking the AMP pages with the help of Google Tag Manager

2. Event tracking:

Event tracking on the AMP page is the same as the normal page event tracking. We just need to configure one UA tag with track type as event and have to provide category, action, and label for same.

Going further, we need to add a trigger to be able to send event data in Google Analytics and set triggers like click trigger, scroll trigger, and visibility of elements so as to successfully fire this event tag.

By creating and adding triggers as per your tracking requirements, the tags will start sending data to Google Analytics when the trigger conditions are met.

Conclusion:

We’ve covered the basic implementation of tracking AMP Pages in Google Analytics. Over the next couple of weeks, we will be focusing on various analytics quick hacks and advanced AMP tracking in Google Analytics and the benefits of doing so, with a series of blogs. So stay tuned to this space to read up more on this topic.

If you are facing any issues in setting up your AMP tracking in Google Analytics or if there is a topic in particular that you’d like us to cover in our series of blogs on AMP tracking in Google Analytics, please feel free to let us know in the comment section below.

Campaign Attribution in Firebase Analytics for Tracking Mobile App

Firebase tool is like a dream come true for product managers owing to its smooth app development capabilities and the complimentary app analytics features for analysis & insights.

In my previous blog on Firebase analytics for mobile app I had shared a few tips on how to enhance Firebase analytics reporting, identified its limitations & later discover how swiftly we can overcome them.

One of the actionable items in that blog was to attain the General Campaign Attribution data for Android app users in Firebase Analytics Reporting and we are going to cover the same in detail in this blog post.

So what’s missing in Firebase Reporting?

Undoubtedly the analytics reporting aspect of Firebase covers a wide range of important events that add value to your business. But unfortunately, when it comes to the “Attribution” section of reporting, it has its limitations and what is missing is the following:

  • No custom campaign attribution is available for App Installs.
  • The re-engagement campaigns attribution data is missing.

Elaborating on the above problem statement, currently, Firebase Analytics tracks Attribution for a limited number of Advertisers listed here. For any other platform or source/medium apart from those, the data tracked will be attributed to “direct”, which is a major problem.

Workaround to Track Custom Campaigns

In this blog, I will walk you through a solution that is a workaround developed by our team at Tatvic and will enable you to track custom campaigns through deep links for re-engagement attribution. The solution offered here that for the second problem statement mentioned above.

Let’s get an understanding of how the Campaign Attribution in Firebase Analytics will be done:

1. Deep link with UTM tagging

A prerequisite to being able to track custom campaign data is that all the links through which the users land on your app should have proper UTM tagging to it. Below is a sample URL:

https://shop.tatvic.com/?utm_campaign=test_dynamic&utm_medium=internal_campaign&utm_source=tatvic


2. Fetching UTM parameters

When the user lands on the app through the link, we fetch the UTM parameters form the link.

The below code describes how to fetch the UTM parameters from a deep link in Android.  

Note: The above code is for Android only. For similar implementation in iOS, you can refer to the iOS document and get the UTM parameters.

Also, Read Firebase Analytics Reporting

3. Sending campaign data along with an event

Being aware of the fact that Firebase Analytics is event-based, the campaign attribution is viewed against the “first_open” event only in Attribution Report of Firebase.

And we have no control or access to this event(first_open) and when it is fired. Thus, we define or use alternative event and track the campaign parameters along with it.

In our solution, we will use the suggestive event of Firebase Analytics i.e. “app_open”.

FirebaseAnalytics.Event.APP_OPEN


4. Enabling event as attribution in Firebase Reports

Since we are now tracking the campaign data, it is necessary to view the same in the reporting section. However, to view the campaign data with events, your very first job is to

“mark the event as conversion in the event report”

After enabling the toggle button, very soon you will be able to see your attribution report getting populated with fine campaign data.

Note:

The attribution will be only done for the count of events, only after they have been marked as true for conversion in the Event Report.

Comprehensively with the above set of actions, you will be able to start tracking the custom campaign data for deeplinks or re-engagement campaign in Firebase Reporting successfully. The above approach tracks source/medium in Firebase, with a custom event (“app_open”) and not with the default attribution of the “first_open” event that we send.

Below is the glimpse of a report with custom campaign attribution data:

Conclusion

Although we have achieved tracking Custom Campaign Attribution for Re-engagement Campaigns, unfortunately, we still have no sight of Install Campaign data in Firebase Analytics.

Are we really losing hopes on Install Referrer Data in our Analytics Reports?

Absolutely not! We are not going to give up so soon.

We have an in-house solution for tracking Install’s Campaign data in Firebase. The solution that we offer is quite savvy, it allows you to track the Install Referrer data in both Firebase and Google Analytics Platform. But not limited to ourselves we can further track these Install Data in other Analytics platforms too. For further assistance do reach us out and we will be glad to serve you!

Bot Icon
Bot Icon

Tatvic Bot

Explore About Tatvic and Services