Hello There!

Lorem ipsum dolor sit amet, consectetur adipiscing elit,

 About Ketan

Ketan is a Web Analytics Consultant at Tatvic.

How to save your marketing dollars on your Customer Loyalty Program?

consumer repeatation

I am very much intrigued by the Customer Loyalty programs I observe across eCommerce sites I encounter. Indeed they are very much common place and have become a tried and tested tool to drive loyalty. What makes a marketing campaign stand out is the definitely the ROI fetched on the campaign and this led me to think if we could apply some form of analysis to improve the returns. Before I pull the rabbit out of the hat, let me walk you through the approach I followed.

Cohort Analysis gives us great insight into consumer action. So I pulled up some Google Analytics eCommerce data and started experimenting with cohorts. I wanted to understand Repeat Purchase Behavior and hence focus on two cohorts in particular:

1. Customers who made only one purchase on the website

2. Customers who made multiple purchases on the website

Let us first examine the proportion of consumers belonging to both the above mentioned cohorts.

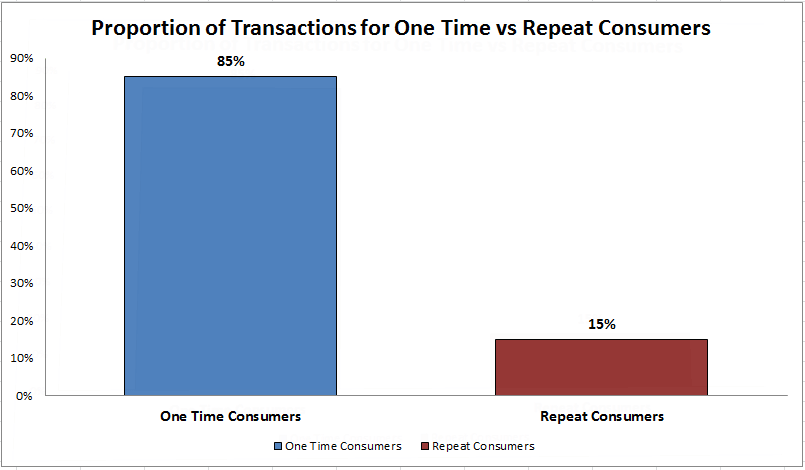
Proportion of Transactions for One Time vs Repeat Consumers


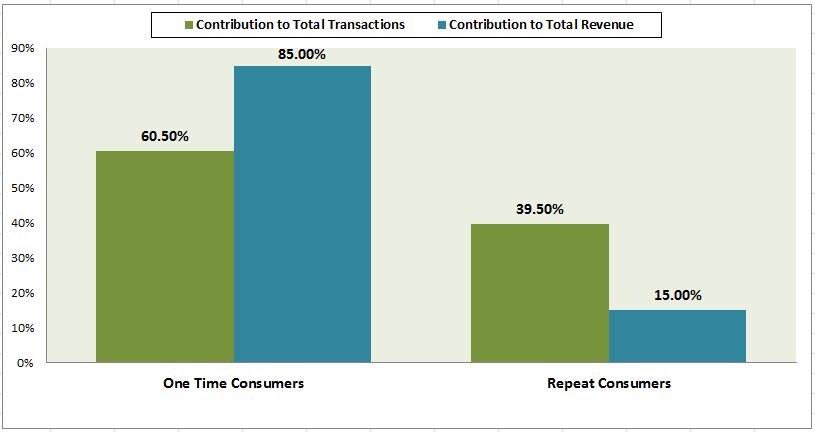
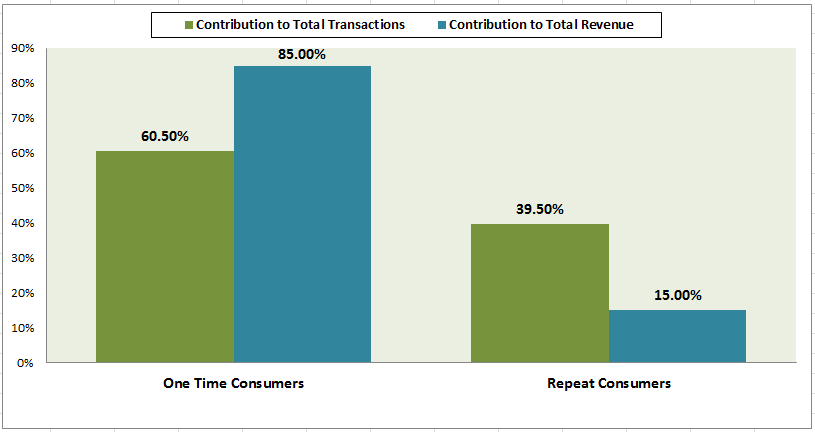
There is indeed a stark difference between the two cohorts. A huge majority (85%) of customers are one-time customers. They do not come back and purchase again. This is a challenge faced by many sites and is not limited to a singular instance. If we were to compare the revenue contribution of the two cohorts we see that while the one-time consumers contributed towards  60% of the total revenue, the other cohort contributed a ‘whopping’ 39.5%. I have a reason for using the word ‘whopping’ and I will state it now.

“15% of the consumers contributed towards 39.5% of the total site revenue.”

Sweet, let me tell that to my boss!

Contribution to Total Transactions and Revenue by Cohort


Yay! We have identified the problem that the consumers are not sticking. So lets target them with an aggressive retention campaign. Lets send out discount coupons to all the one-time consumers to encourage them for future purchases. But would it seem fair to target the entire one-time consumer base to drive sales? Some consumers would go for the 2nd purchase without the incentive. The point I’m trying to drive home is sending out discount coupons to all the one time consumers would also erode your profit margin to a large extent.

Moreover, assume that the discount coupon initiates a future purchase with a value of  $50 in 10% of the cohort. If a voucher is sent to a consumer who would have re-purchased anyway, that results in a loss of $5 to the store owner. Note that these figures are ball park estimates but I encourage you to think about the implications.

Marketers have a limited budget and need to prove the efficacy of retention campaigns by measuring results. How would you do this? Predictive Analytics can be of help here. Where cohort analysis is descriptive in nature, predictive analysis helps you use your data to build models to predict consumer behavior. Think of it as a machine that converts data into actionable insights that give you better ROI.

Specifically in our case, predictive analytics can provide answer to this important question:

“Which customers should I target for discount coupons in order to maximize revenue?”

Does this question seem interesting? View a recorded version of our recent webinar where we show you how to build a Predictive Model for Discount Targeting using R

Visualizing your websites’ ecommerce performance with R

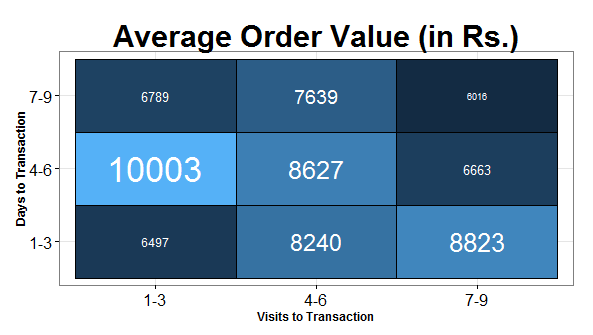
Average Order Value

In this blogpost, I want to dive deeper into the explanation of the relationship between Frequency and Recency of Visits with the Conversion Rate and Average Order Value. I have used the RGA package for data extraction and Dr. Hadley Wickham’s ggplot2 package to achieve the visualizations.

Here’s the data aggregation script :

#transactions dataframe contains the input data extracted via RgoogleAnalytics

head(transactions, n = 3)

#  visitsToTransaction daysToTransaction transactions transactionRevenue
#1                   1                 0         1639           11505429
#2                  10                 1            1               3700
#3                  10                10            1               6050

transactions$visitsToTransaction=(3*i-2)&transactions$visitsToTransaction=(3*j-2)&transactions$daysToTransaction

We now convert our data into a visualization using the ggplot2 package. Here’s the command:

require(ggplot2)
aov


Let us make some quick inferences:

  • When the consumers visit 1-3 times across a period of 4-6 days they tend to buy the most expensive products
  • When they visit the site 7-9 times across a very small period of 1-3 days, these might be the consumers who visit repeatedly to keep a tab on offers and prices of a product of their choice they too have a higher Average Order value
  • Spontaneous buying decisions are made when the Visits and Days to Transaction are in the 1-3 categories. As expected, the average order value for these transactions is on the lower end.

Let us do a similar exercise for the Conversion Rate. We extract data corresponding to the dimensions: Visit Count, Days since Last Visit and Metrics: Visits. Repeat the same steps as before. We already had the Transactions binned and categorized earlier. We now divide the total number of Transactions across each category to the Total Visits in order to get the Conversion Rate and plot it.


Conversion Rate

Both the plots stacked up together help us understand the relationship between the Average Order Value and the Conversion Rate which in this case seems to be an inverse relationship i.e. AOV tends to be higher when Conversion Rate is the lowest. Now, this correlation may not imply an underlying causation therefore we need to drill down further to verify our hypothesis.

Consumers do tend to visit the website multiple times before making a purchase. Some might buy right away, but most of them will research a bit and come back. With this realization, we could focus on giving them more information to help with their research and getting them to convert at their own pace. On the other hand, if the time period is short (for e.g. 1-3 Visits in 1-3 Days) and the purchase is more spontaneous we have some room for improvement here (Average Order Value: 6497, Conversion Rate 1.37 %). We could play with pricing strategy and thereby to increase the Average Order Value or provide a referral discount and get more consumers to convert. Of course, this has to be done keeping the site’s business objective in mind.

Would you like to understand the value of predictive analysis when applied on web analytics data to help improve your understanding relationship between different variables? We think you may like to watch our Webinar - How to perform predictive analysis on your web analytics tool data. Watch the Replay now!

Highlights of the Amazon Web Services Summit, Mumbai 2013

As a data analytics firm, we understand the value of the cloud for data storage and processing. When we talk about cloud computing, we are very passionate about Amazon Web Services since it is a very rich platform that enables us to build our applications for various use-cases. We were curious to understand AWS and gain an insight into best practices and this led us to the annual AWS Summit at Mumbai. The AWS Summit is a one day cloud community event organized in 12 major cities around the world. The focus of the current event was on cost effectiveness, high availability, big data and security.

The keynote was delivered by Dr. Werner Vogels, CTO of Amazon.com where he talked about how AWS helps developers focus on the application rather than the infrastructure.

A range of breakout sessions were attended by team Tatvic.

In the Startup and Developer Track, one of the speakers talked about the four stages of a startup development lifecycle namely: Idea, MVP (Minimum Viable Product), Scale and Profitability. These ideas were inspired by Steve Blank’s book: The Four Steps to Epiphany. He also mentioned how a startup can effectively use AWS as they pass through each of these stages.

One of the other sessions that we found very useful was the Big Data Analytics session. Abhishek Sinha, Head of Big Data and Compute, spoke about how running Analytics on the cloud could be extremely effective since it was Elastic and scalable. Data objects could either reside in S3 or if in a database layer like DynamoDB. The data processing can be carried out on an EC2 instance or on a distributed Hadoop cluster with the use of Elastic Map Reduce. Finally, the processed results can be pushed back to S3, DynamoDB or Redshift. Whats more to this is that this entire process of Data collection, Computation and Storage can be automated with the help of Data Pipeline. Interesting !

The keynote and breakout talks left us with an even better sense of what AWS is about, how it has grown, what kinds of customers are using it, and what it can do.

Update - The videos from the AWS Summits held around the world can be found in this Youtube playlist

Increase Your Store Revenue by Performing Shopping Basket Analysis

If you have an online store, then as an retailer you would certainly want to know how your product is performing online and the factors that are affecting its sale. And to know this, you need to collect data that provides in-depth information about buyer details and shopping behavior online. Further, it is also essential to identify the behavior of one product, compared to its counterpart. When you notice that few products in your store are performing better, then it becomes important to know whether these products were purchased together or were just complementary in nature. By carrying out Shopping Basket Analysis, this problem can be solved to a certain extent.

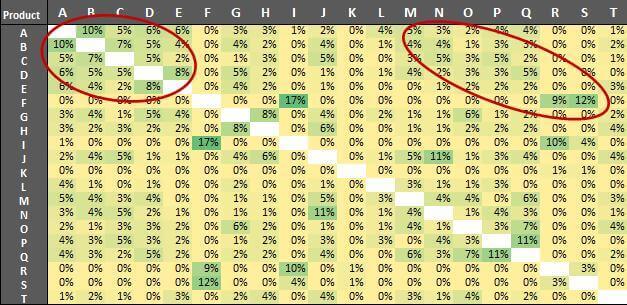
We carried out an analysis from a simple 2 by 2 chart comprising of top 20 highly sold products of clients involved in clothing business to learn how these products were related to each other. We used the transaction data of buyers to find the probability between two or more products purchased together by a buyer in a single transaction. We then put Tatvic Google Analytics Excel Plug-in into use and some pure excel functions to extract the relevant data.

Clothing Product Cycle
Product Purchase Pattern Analysis
Product Data Analysis and Findings
Shopping Basket Analysis:
  1. In 10% transactions of product “A”, product “B” was also purchased.
  2. In 17% transactions of product “F”, product “I” was also purchased followed by 12% transactions having product “S”.
  3. In approximately 5% transactions of product “I”, products R and S were also purchased.
  4. In 11% transactions of product “P” product “Q” was also purchased.
  5. Red circles in the diagram show hot zones where maximum slot of transactions happen and should be our focus.
Shopping Basket Recommendation:

Above insights can be used to decide optimum promotion and pricing strategies like:

  1. Ensuring that products being purchased in combination are on same page side by side.
  2. Highlighting those products on top landing pages of site.
  3. Providing discount in form of shipping benefits to group of products giving higher average order value.
  4. Finding out single product transactions and tie those products to moving items at discounted rate.

There is a whitepaper “Product Purchase Pattern Analysis” which covers this article in comprehensive manner. You can also use our Product Recommendation Engine to provide more product recommendations in different ways to your customers to enhancing up sell and cross sell conversions. In case you wish to analyze data in excel you can download excel version of shopping basket analysis dashboard here.

4 Elements to A/B Test for Product Recommendations to Increase Order Value

A/B Test

A/B Test

Testing Product recommendation means experimenting with different elements of recommendations section to make it more usable and convertible. There are different ways you can test product recommendations. Below are the elements you should test to improve performance of your product recommendations section.

1) Title

Title is the most important element of the recommendation section. The title is why people will see the recommendations. Sometimes, Title is the only thing visible in first fold.

Product Recommendation Title

Suggested titles to test:

      • “60% people who viewed above product also viewed these:”
      • “60% people who bought above product also bought these:”
      • “60% people who bought above product also viewed these:”
      • “60% people who viewed above product bought these:”

Note: “60%” is just used as an example above. That number would vary depending upon the user behavior.

[Tweet “A/B Test the Title of Your Product Recommendation to Increase the Average Order Value”]

2) Call-to-action

Call-to-action is why people will click and go further to buy more. It’s not every time that “Add to cart” button will get more clicks. We’ve seen instances where “Know more” as a prominent button get better conversions rates.

Call to action button

Suggestions to test call-to-action:
      • “Know more” as call-to-action button and “Add to cart” as a small link
      • Only “Know more” as a call-to-action button.

(No “Add to cart” CTA  tells customers that the seller wants them to explore the product before they buy)

[Tweet “A/B Test the CTA Button of Your Product Recommendation to Increase the Average Order Value”]

3) Placement

WHERE you place product recommendation section is also important and hence it should be tested. For some sites, recommendations on one page might perform better than recommendations on other page.

Suggestions to test placements:
      • Product page vs Shopping cart page
      • Product page vs category page
      • Category page vs Shopping cart page
      • On product page, you can test it below the product details vs above the product details
      • On shopping cart page, you can try it below the “Checkout” button vs above it.

e.g.

Product Page with Product Recommendation

Product page

vs

Shopping cart page

Shopping Cart Page with Product Recommendation

[Tweet “A/B Test the Placement of Your Product Recommendation to Increase the Average Order Value “]

4) Normal recommendations vs Bundles

A Product Bundle is basically a group of products that you offer to your users, mostly at a discount. It’s a nice way to encourage impulse buying and increase order value. When a customer is on a product page, you can suggest a bundle of products that would go well with that product.

Suggestion for test between different pages:

      • Test product bundling vs normal recommendations.

e.g.

Normal Product Recommendations Offer

Normal recommendations

vs

Product bundling

Normal Product Recommendations Offer

[Tweet “A/B Test Product Bundle of Your Product Recommendation to Increase the Average Order Value”]

To carry out the above A/B Test on your product recommendation you can use tools like Optimizely and Visual web optimizer.

Google+ Hangout: The Future of Working with Data with Michael Koploy and Thomas Davenport

Hi folks,

Some of the guys from our team have watched the replay of this Google+ Hangout and we have found it quite interesting. Assuming that the majority of you guys that come here to check our blog posts out are also part of the web analytics world, we thought we should share this with you here.

We really hope you enjoy this cross-post from the Plotting Success blog from Software Advice !

Author and professor Thomas Davenport’s new book, Keeping Up with the Quants, serves as a “quantitative literacy” guide for managers as they wade through the world of data today and tomorrow. Keeping Up with the Quants, co-authored by Davenport and Jinho Kim, covers the basics of quantitative analytics, the essential habits of effective analysts and insight on how business users and top-ranking quants can best collaborate.

Michael Koploy, Managing Editor at business intelligence resource website Software Advice, recently hosted a Google+ Hangout with Davenport to discuss key points from the book and Davenport’s thoughts on the future of business analytics.

Among other topics, Davenport and Koploy cover:

  • The importance of balancing creativity with a regular, thorough analytical process
  • Why great companies hire great analysts-and why that isn’t likely to change anytime soon
  • Why visualization tools are effective at analyzing “Big Data”
  • How “Ph.Ds with personality” drive analytical innovation in business
  • Why everyone should dabble in coding

Check out a full recording of the hangout below:

For a full analysis and takeaways from the hangout, check out Koploy’s post on the Plotting Success blog: Hangout with Thomas Davenport: The Future of Working with Data. Be sure to check out Keeping Up with the Quants: Your Guide to Understanding Analytics, on sale now. And connect with Koploy on Twitter (@PlottingSuccess) and Google+.

Resources for getting started with R

As we believe you may know, we are having a webinar tomorrow (June 19th, 2013) on Predictive Analytics. During this webinar, you are going to be introduced to R, learn how to build a predictive model and also how to carry insightful analysis through visualization.

As learning a new language can be a really difficult and painful process, we thought that it would be a valuable idea to share useful links for R resources with you. If you can spare some time to read some of these links, we believe that this first briefing will enable you to come with a better background to our webinar.

So, what do you say? Are you in for a reading and for reducing your learning curve?

Downloads

R : http://www.r-project.org/
Choose your nearest download location and click on the appropriate link
RStudio : http://www.rstudio.com/

Packages

RGoogleAnalytics :https://code.google.com/p/r-google-analytics/
Guide to getting started with RGoogleAnalytics :http://bit.ly/11kUgzI
Guide to getting started with ggplot2 :http://www.cookbook-r.com/Graphs/
Finding additional R packages for your domain : http://cran.r-project.org/web/views/
Additional Ideas for Predictive modelling :http://bit.ly/13XyCCK

Courses on R

Codeschool : http://tryr.codeschool.com/
2 minute short videos on R: http://www.twotorials.com/

Community

A Prezi tour of the R ecosystem :http://prezi.com/s1qrgfm9ko4i/the-r-ecosystem/
R news and tutorials from prominent R blogs : http://www.r-bloggers.com/
A search engine for R: http://www.rseek.org/

If you come across more resources, please ensure that you drop a comment below.

Would you like to understand the value of predictive analysis when applied on web analytics data to help improve your understanding relationship between different variables? We think you may like to watch our Webinar - How to perform predictive analysis on your web analytics tool data. Watch the Replay now!

Understanding the value of Predictive Analytics on Web Data

In this blogpost, I will be talking briefly about Predictive Analytics and why it holds value from a web analytics perspective. Broadly speaking, Predictive Analytics is a set of methodologies that assist us in anticipating customer behavior. The customer behavior of interest could be anything ranging from spend, buying habits, page views, response to a certain trigger or something else. From a business perspective, there could be a variety of reasons why you would opt for Predictive Analytics strategies. Some of them are:

  • Traditional Web Analytics tools generate tons of clickstream data. Predictive Analytics helps filter out the noise and go beyond aggregate level metrics.
  • It helps you understand the complex patterns between metrics and these patterns now form the basis of your decision making process.
  • It helps you allocate investments wisely since your decisions are now based on your data rather than gut.

I should point out here that Predictive Analytics does not mean that you need to predict customer behavior with a very high probability and be very accurate in your findings. Let me illustrate this with an example: Every time a new customer lands on your website, you know that he has a 50% probability of converting. Now, if you build a predictive model which indicates that he has 52% chance of converting, it holds great value for your business since it suggests that your customer is more likely to convert. You can now segment all your customers who have a higher than 50% chance of converting and channel your marketing efforts towards these customers.

Now, in order to perform Predictive Analytics, you will require the following :

  1. Clear Objective: The business problem that you want to model
  2. Data: Having the right data is absolutely imperative. If you have a user centric business model, where you can get rich data regarding your customers behavior, that’s a big plus.
  3. Methodology: Once you have the data and a clear objective, you can start thinking about the statistical method you will use to build the prediction model
  4. Tool: There are a variety of predictive analytics tools available. Selecting the right tool for your business depends on your in house analytics talent pool and allocated budget.

If you are interested in knowing more about deploying Predictive Analytics techniques at your organization, join us in our webinar where we will show you how to leverage Predictive Analytics on your clickstream data using the R language. R is the lingua franca for data analysis. Savvy Web companies, like Facebook, have successfully used R in predictive analytics to answer questions like “Which data points predict whether a user will stay? And if they stay, which data points predict how active they’ll be after three months?” We will also be covering data visualization since the use of good visualization leads to better understanding of the nuances between your variables.

See you at the webinar !

PS: You might want to warm up and read some additional posts on Predictive Analytics. Find them here.

Would you like to understand the value of predictive analysis when applied on web analytics data to help improve your understanding relationship between different variables? We think you may like to watch our Webinar - How to perform predictive analysis on your web analytics tool data. Watch the Replay now!

Bot Icon
Bot Icon

Tatvic Bot

Explore About Tatvic and Services