Hello There!

Lorem ipsum dolor sit amet, consectetur adipiscing elit,

GA4 Data Pipeline: What Happens Between Collection and Report

GA4 Data Pipeline: What Happens to Your GA4 Data Between Collection and Reporting

When a number in your GA4 report looks wrong, the instinct is to question the report.

That’s the wrong place to look.

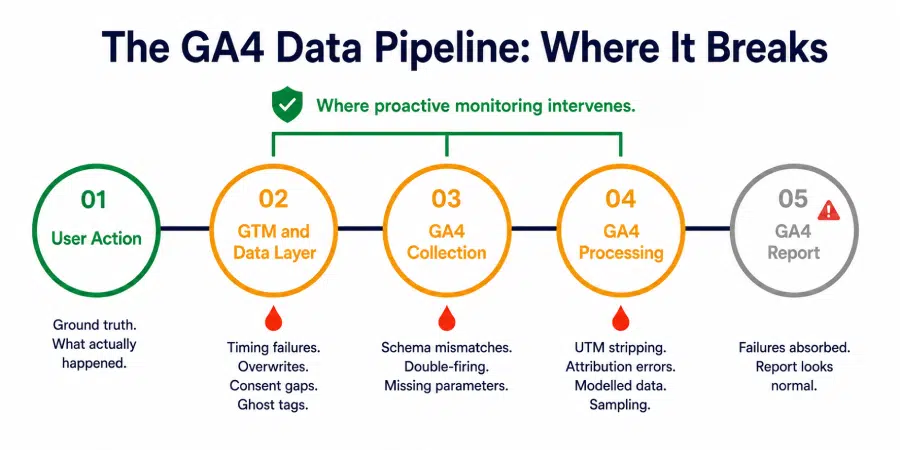
The report is the last stop in a journey that starts the moment a user takes an action on your site. Between that action and the number that appears in your dashboard, your data passes through five distinct stages:

  • The user interaction
  • The GTM data layer
  • GA4 collection
  • GA4 processing
  • The report itself

At four of those five stages, something can break without any visible signal that it has.

That’s the problem with the GA4 data pipeline that most analytics setups aren’t designed to address. Reactive monitoring watches the report. The breaks happen upstream.

This blog traces that journey stage by stage, names exactly where failures occur, what causes them, and what they look like by the time they reach a report. Understanding the pipeline is the first step toward monitoring it correctly.

The Five Stages of the GA4 Data Pipeline

Every data point in a GA4 report has passed through this sequence:

Stage 1: User Action

A user clicks, submits, purchases, or navigates. This is the ground truth. Whatever happened here is what the analytics stack is supposed to record.

Stage 2: GTM and the Data Layer

GTM intercepts the user action through triggers, reads values from the data layer, and fires the appropriate GA4 tag with the correct parameters. This is the first point of failure.

Stage 3: GA4 Collection

The GA4 tag sends an event hit to Google’s collection servers. Parameters, values, and event names are received and validated against basic format rules. This is the second point of failure.

Stage 4: GA4 Processing

Google processes the raw hit, applies attribution logic, resolves session boundaries, applies consent mode adjustments, and prepares data for reporting. This is the third point of failure.

Stage 5: GA4 Report

The processed data becomes visible in GA4 reports, explorations, and any downstream tools connected to the property. By this stage, any failure in Stages 2, 3, or 4 has already been absorbed into the numbers. The report looks like a report. It gives no indication of what broke upstream.

Gartner estimates poor data quality costs organizations $12.9 million annually. A significant portion of that cost in GA4 environments comes not from data that was never collected, but from data that was corrupted somewhere between Stage 1 and Stage 5 and reported as if it were accurate.
Stage 2: Where GTM and the Data Layer Break

GTM is where most GA4 data pipeline failures originate. The GTM data layer is the communication channel between your website and your tags. When it breaks, the tags that depend on it fire with wrong values, missing values, or no values at all.

The timing problem

Google’s own data layer documentation is explicit about this: tags that try to access data layer values before those values have been pushed will receive undefined.

A GA4 tag configured to fire on Container Loaded that reads a page_category variable from a data layer push that only occurs after DOM Ready will always send an undefined page_category to GA4. Every event it records will carry that empty parameter.

No error is thrown. The collection happens. The data is just wrong.

The data layer overwrite problem

Re-initialising the data layer after GTM has loaded, during a page transition in a single-page application, breaks the listener that GTM uses to receive events.

  • Tags may fail to fire entirely
  • Where they do fire, the data layer values they read will be from the wrong application state
  • The result is missing events or events recorded with parameters from a previous page
The consent sequencing problem

When tags fire before the consent management platform has loaded and communicated user preferences to GTM, analytics tags can fire without consent being properly checked, or fail to fire at all when they should.

Poor tag sequencing around consent can cause up to 20% data loss in reported traffic, according to industry analysis. Neither outcome is visible in GA4 without parameter-level monitoring.

The GTM container health problem

Publisher and e-commerce sites accumulate tags over time:

  • Redundant tags from past campaigns
  • Conflicting triggers across implementations
  • Ghost tags from vendors no longer in use

These create race conditions, duplicate event fires, and unreliable trigger logic that corrupts the GA4 data pipeline at its source. Continuous GTM health monitoring is specifically designed to catch these container-level failures before they reach GA4 collection.

Stage 3: Where GA4 Collection Breaks

Once a tag fires, the event hit travels to GA4’s collection servers. Failures at this stage are about what’s in the hit, not whether it arrived.

Schema mismatches

GA4 expects parameters to follow the schema defined in your implementation.

  • A revenue parameter passing a string value (“1,299”) instead of a numeric value (1299) will either be rejected or stored incorrectly
  • A product category parameter passing a value outside the approved taxonomy will record the event in GA4 but assign it to a segment that doesn’t match your intended classification

Both scenarios produce events that look valid in GA4 but carry corrupted parameter values.

Double-firing events

When a trigger is configured incorrectly, or when both enhanced measurement and a custom event are set up to track the same interaction, GA4 receives two hits for one user action.

  • Conversion counts inflate
  • Revenue figures double
  • The report shows numbers that are plausible enough to pass a casual review but are systematically wrong

Data sanity automation catches double-firing by monitoring event count ratios against historical baselines, flagging when a conversion event is being recorded at a rate inconsistent with the session volume that should be generating it.

Missing required parameters

A purchase event that fires without a transaction ID, or a lead event that fires without a form type parameter, is recorded in GA4 but is incomplete for any analysis that segments by those dimensions.

Missing parameters are rarely caught in aggregate metric monitoring because the event itself records correctly. The gap only appears when the data is sliced by the dimension that was never populated.

Stage 4: Where GA4 Processing Breaks

GA4 processing is the stage most businesses understand least, and where silent failures have the widest downstream impact.

UTM parameter stripping in redirects

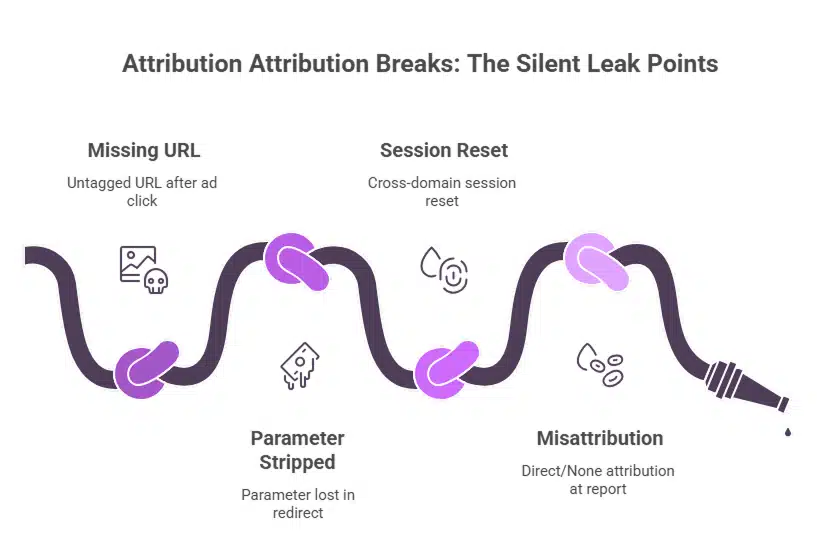
When a user clicks a paid campaign URL and is redirected through an intermediate URL before reaching the landing page, UTM parameters can be stripped in the redirect.

  • The session arrives at the landing page without attribution data
  • GA4 assigns it to Direct
  • If direct traffic as a percentage of your overall sessions is above 30 to 40%, stripped UTMs are likely a contributor
  • The campaign that drove the traffic shows no conversions

Budget decisions follow the attribution, not the reality.

Session attribution logic

GA4’s session attribution model assigns the full session to a single source based on the last non-direct click. When users arrive through multiple touchpoints within a session, or when cross-domain tracking gaps cause session breaks, attribution gets assigned to the wrong source.

The campaign that shows the credit may not be the campaign that earned it.

Consent mode data modelling

When consent mode is active and a portion of users decline analytics consent, GA4 uses modelling to fill in the gaps. The modelled data is an estimate, not a measurement.

In markets or audience segments with high opt-out rates, GA4 models a significant share of conversions and sessions instead of measuring them directly. Google designed consent mode to fill these gaps, so the modelling itself is not a failure. Problems arise when teams misunderstand the role of modelled data and optimize campaigns as though every reported conversion reflects a direct measurement.

Sampling in large properties

GA4 applies sampling thresholds in certain exploration reports and BigQuery exports at scale. When sampled data is used for audience building or conversion analysis without accounting for the sampling rate, the resulting segments and insights are drawn from a subset of actual data.

The anomaly detection layer helps here by flagging when key metric patterns shift in ways that suggest data volume changes, including sampling threshold effects.

What Each Break Point Looks Like in Your Reports

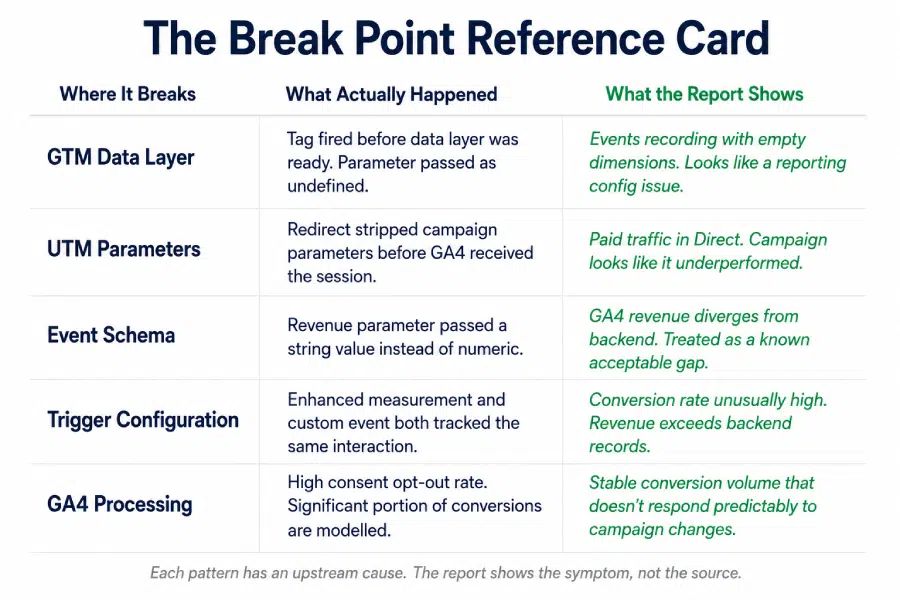
This is the most important part. Each failure above produces a specific pattern in GA4 reports. Knowing the pattern helps identify the upstream cause.

GTM data layer timing failure

Events record correctly in volume but carry empty or undefined parameter values. Segment-level analysis breaks down because the dimension is unpopulated. Looks like: a reporting configuration problem Actually is: upstream data layer timing failure

UTM stripping in redirects

Direct traffic percentage climbs without a corresponding increase in branded search or type-in traffic. Paid campaign conversion rates drop. Looks like: campaign underperformance Actually is: a redirect configuration stripping query strings

Double-firing conversion events

Conversion rate appears unusually high relative to the site’s actual funnel performance. Revenue figures exceed backend records. Looks like: a strong performance period Actually is: a duplicate trigger producing two hits per user action

Schema mismatch on revenue parameters

Total revenue in GA4 diverges from e-commerce backend figures. The gap is consistent, not random. Looks like: a known discrepancy that gets acknowledged and ignored Actually is: a parameter passing values in the wrong format

Consent mode modelling at high opt-out rates

Conversion volume looks stable but doesn’t respond predictably to campaign changes. Optimisation decisions produce inconsistent results. Looks like: attribution complexity Actually is: a high proportion of modelled data being treated as measured

Each of these has a distinct signature in the data. The GA4 data pipeline failing silently doesn’t mean it’s failing invisibly, if you know what to look for.
Monitoring the Pipeline, Not Just the Report

The reason GA4 data pipeline failures persist is that most monitoring is set up at the wrong end of the journey. Checking the report for anomalies is checking the output of a process that has already completed, potentially with corrupted inputs.

Protecting the GA4 data pipeline requires monitoring at each stage where failures occur:

At the GTM layer

Continuous container health monitoring catches tag sequencing issues, data layer timing failures, and trigger conflicts before they generate corrupted events. This is the earliest intervention point in the pipeline and the highest-leverage one.

At the collection layer

Automated schema validation checks that parameters are passing correct value types and that event counts fall within expected ranges. Double-firing is detectable within hours when event-to-session ratios are monitored with intelligent baselines rather than static thresholds.

At the processing layer

UTM coverage monitoring tracks the percentage of sessions arriving with campaign attribution. When direct traffic rises sharply without a corresponding organic explanation, that’s a redirect or UTM stripping signal worth investigating immediately.

An alert playbook with a named owner for this specific signal type ensures it gets investigated before a week of misattributed campaign data influences budget decisions.

Across the full pipeline

Reconciling GA4 output against backend data sources monthly, comparing GA4 revenue against finance records, and matching GA4 conversion counts against CRM data, closes the loop on what the pipeline produced versus what actually happened.

Discrepancies that survive pipeline monitoring are caught at reconciliation before they propagate into strategy.

In the analytics maturity model, this full-pipeline monitoring capability is what separates Stage 2 from Stage 3. Stage 2 monitors the report. Stage 3 monitors the pipeline that produces it.

Can You Trust Every Stage of Your GA4 Data Pipeline?

Before accepting the next GA4 report as ground truth, consider:

  • Do you continuously monitor GTM container health, or do you only review it during implementation updates?
  • Do you validate data layer pushes for timing and value accuracy before tags fire?
  • Do you automatically check parameter schema compliance across all custom events?
  • Do you track direct traffic against a baseline and investigate spikes that may signal UTM stripping?
  • Do you regularly reconcile GA4 conversion counts with CRM or backend records?
  • When your team identifies a pipeline failure, does a designated owner investigate it within a defined response SLA?

Gaps here mean your GA4 reports are describing a version of user behaviour that may have been partially corrupted before it was ever recorded.

The Takeaway

Your GA4 report is not where data quality is determined. It’s where data quality is revealed, or more often, where it isn’t.

The GA4 data pipeline has four stages between a user action and a report number, and each one is a point where data can break silently. The break doesn’t announce itself. It shows up as:

  • A plausible-looking metric that’s wrong
  • A campaign that looks like it underperformed
  • A conversion rate that seems high
  • A direct traffic share that nobody has questioned

Monitoring the report catches problems late. Monitoring the pipeline catches them where they start. That difference, measured in hours rather than weeks, is what separates analytics data you can trust from analytics data you’re hoping is right.

Want to know exactly where your GA4 data pipeline is breaking right now? Tatvic audits your GA4 data pipeline from collection to reporting, identifies gaps in data quality, and helps you build a more reliable analytics foundation.. Schedule a call with Tatvic’s experts today.

Data Quality Monitoring: Stop Bad Data Before It Hits Your CMO

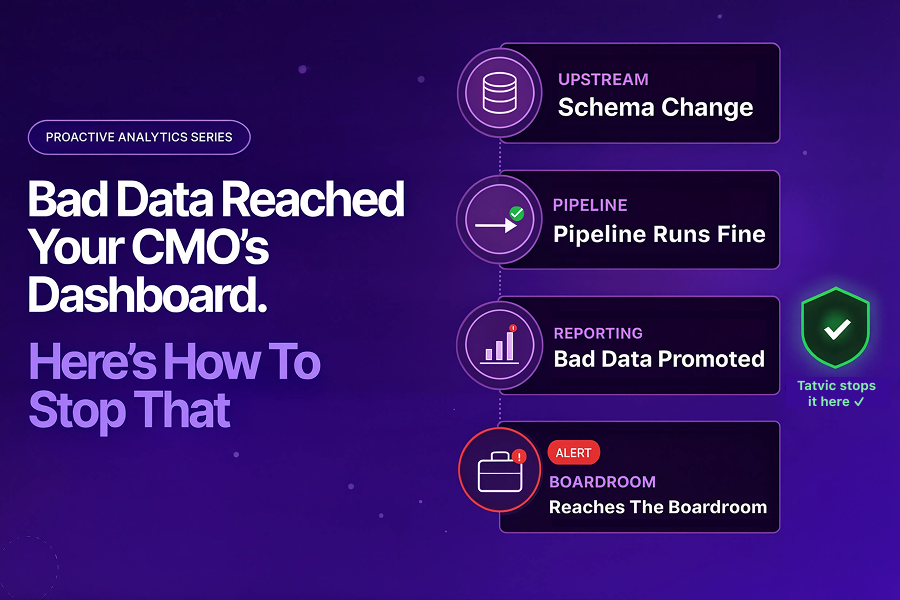
Bad Data Reached Your CMO’s Dashboard. Here’s How to Stop That.

The pipeline had recovered. Engineering considered the incident closed. Slack went quiet.

But the real problem had just started.

Three days later, Priya’s CMO was presenting quarterly marketing performance to the board. Conversion rates looked unusually high. Customer acquisition costs appeared to have dropped significantly.

The CMO made a confident case for scaling media spend in two underperforming regions.

A week after that, someone noticed the numbers were wrong.

The attribution model had been pulling from a stale reporting table. It had stopped updating during the pipeline failure three days earlier. Nobody had validated whether the data was correct after the pipeline recovered.

The pipeline had been fixed. But bad data had already reached the dashboard. And from the dashboard, it had reached the boardroom.

According to Harvard Business Review, bad data costs businesses $3.1 trillion annually. The damage is rarely from a single catastrophic failure - it comes from corrupted data that travels silently through pipelines and surfaces in decisions made with total confidence.

This is the second problem most analytics teams do not solve.

Post 1 of this series covered BigQuery pipeline failures - jobs that break, quotas exhausted, data that never arrives. Read: Your Data Pipeline Breaks Every Monday. It Doesn’t Have To →

This post covers something more dangerous: data that does arrive - but arrives wrong.

Bad data in dashboards is not a pipeline problem. It is a data quality monitoring problem.

And the gap between the two is where reporting trust quietly breaks.

Why Data Quality Monitoring Is Not the Same as Pipeline Monitoring

Bad data in dashboards rarely announces itself.

A pipeline failure is visible - dashboards go blank, engineers get paged, someone notices immediately. 

Bad data is the opposite. Dashboards look normal when bad data arrives.

Numbers populate, charts render, colors are right. The only problem is that what the dashboard shows is wrong - and nobody in the room knows it.

Most analytics teams treat data quality monitoring and pipeline monitoring as the same thing. They are not.

  • Pipeline monitoring checks whether a job ran - it is an infrastructure health check.
  • Data quality monitoring checks whether what it produced is actually correct - it is a content and dashboard data accuracy check.

Most teams do the first. Very few do the second consistently.

That gap is where bad data enters the dashboard.

According to Monte Carlo’s State of Data Quality report, stakeholders - not data teams - are the first to discover data quality issues in the majority of cases. The analytics team finds out when someone in a meeting says the numbers look wrong.

By the time a stakeholder notices bad data in a dashboard, the damage has usually already happened:

  • A campaign decision was made on wrong attribution data.
  • Campaign budgets get allocated based on inflated conversion numbers.
  • Regional performance reports give leadership a false picture.
  • Trust in the analytics team - quietly, permanently - took a hit.

More monitoring is not the fix. Validation that runs before data is promoted to dashboards is.

Wondering if silent data quality issues are already affecting your reporting layer?

Tatvic helps GCP-first teams identify hidden validation gaps before they impact decisions. Talk to an expert →

What Tatvic Sees Across Data Validation Environments

At Tatvic, we work with organizations where GA4 data flows continuously into BigQuery and surfaces in Looker dashboards that leadership reads every week.

Pattern: Data quality monitoring tools exist. Continuous data observability does not. Most teams run dbt tests or periodic QA - checks that catch what they anticipated, not what they didn’t.

Example: A GA4 event stops firing after a frontend deploy. A schema change breaks a downstream JOIN silently. A null spike skews aggregations without triggering an alert.

Consequence: None of these break the pipeline. All of them produce bad data in dashboards - and all of them are preventable with the right validation layer.

Wondering if bad data is already slipping into your dashboards unnoticed?

Assess your current validation gaps → 

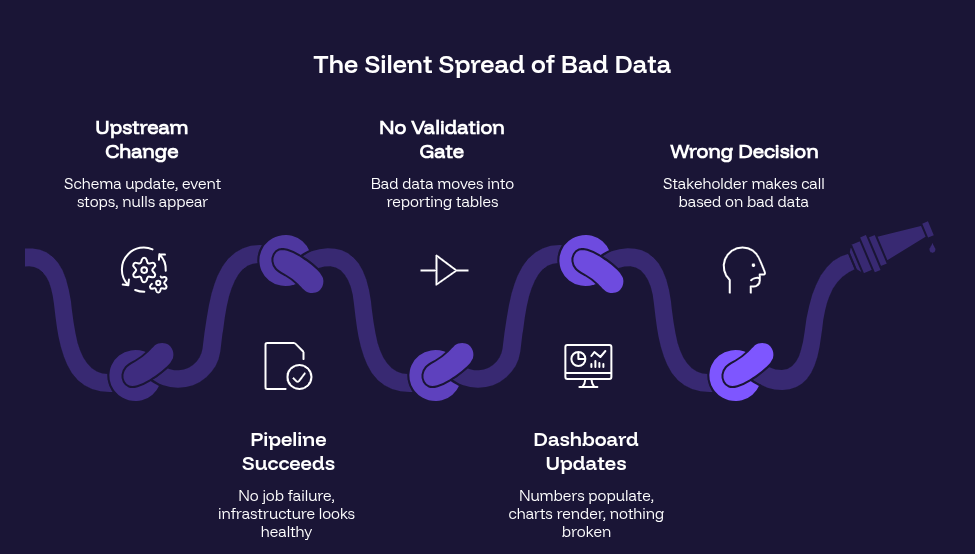
The Silent Spread of Bad Data

Understanding how bad data reaches a dashboard makes the solution clearer. The journey typically looks like this:

IBM’s 2025 Institute for Business Value report found that over a quarter of organizations lose more than $5 million annually due to poor data quality. The cost is not the bad data itself - it is the decisions made on it.

The Three Most Common Data Quality Issues in BigQuery Dashboards

Not all wrong dashboard data looks the same. Across GA4 → BigQuery → Looker ecosystems, three data quality issues account for the majority of failures that reach dashboards - and all three bypass standard data quality monitoring:

1. Schema Drift

A column gets renamed. A data type changes. A new field is added upstream that breaks a downstream JOIN.

Schema drift is particularly dangerous because it is invisible to standard monitoring. The pipeline runs. The table refreshes. But the transformation logic no longer matches the schema it was built for.

Dashboards built on top of that transformation start serving wrong aggregations - and they look completely normal doing it.

2. Null Spikes and Volume Anomalies

A GA4 event stops firing after a code push. A tracking tag gets removed by mistake. A data source experiences a partial outage.

The result is a sudden spike in null values, or a row count that drops unexpectedly. Both skew dashboards in ways that can mislead decision-making - especially when the drop is gradual enough not to trigger threshold alerts.

Volume anomalies are one of the hardest bad data patterns to catch manually, because they require comparison against historical baselines - not just a check against current state.

3. Silent Transformation Errors

A data type mismatch causes a numeric field to round incorrectly. A filter in a transformation excludes records it should not. A CASE statement logic has an edge case that was never tested.

These errors produce data that is structurally correct but semantically wrong. Everything looks fine. The numbers are just slightly off - or, in some cases, significantly off in ways that only become visible at scale.

These are the errors that reach CMO dashboards.

Data Quality Monitoring Tools: What They Do and Where They Fall Short

The analytics ecosystem has mature data validation tools for data quality monitoring. Understanding what they do - and what they miss - is an important context for where data observability and AI agents add value.

1. dbt Tests

dbt helps teams validate assumptions inside transformation layers:

  • Null checks
  • Uniqueness validation
  • Accepted values
  • Referential integrity
The limitation?

dbt catches expected failures. It does not detect anomalies nobody explicitly wrote tests for.

A gradual 18% drop in conversion events may pass silently if no threshold exists.

2. Great Expectations

Great Expectations expands validation through richer statistical checks and expectation frameworks.

It is powerful for structured testing. But like dbt, it still depends on one thing: Human anticipation.

If teams did not define the rule, the anomaly often goes unnoticed.

3. Google Dataplex

Dataplex provides native rule-based validation inside BigQuery:

  • Null checks
  • Range validations
  • Custom SQL assertions
  • Profiling for distributions and completeness

For GCP-first teams, it is often the most practical governance foundation. But Dataplex still operates on predefined logic. And data quality issues rarely stay inside predefined boundaries.

That is where continuous observability and AI-led anomaly detection become critical.

The 1-10-100 rule in data quality states: it costs $1 to verify data at the source, $10 to fix it downstream, and $100 to fix decisions made on bad data. HBR notes it costs ten times as much to complete a unit of work when data is flawed as when it is perfect.

What an AI Agent Adds to Data Quality Monitoring

An AI agent does not replace dbt tests, Great Expectations, or Dataplex. These data validation tools are the foundation of any solid data quality monitoring stack.

The agent adds the data observability layer on top of them. Here is what that means across four specific capabilities:

1. Anomaly Detection Beyond Rules

Rule-based validation catches what you defined. An AI agent detects what deviates from normal - even if no rule was written for it.

By learning historical baselines for each table - typical row counts, null rates, value distributions, column statistics - the agent flags deviations that are statistically significant, even when they do not cross a hard threshold.

  • A 12% drop in conversion events after a frontend deploy.
  • A null rate in the campaign_id column that increased from 2% to 18% overnight.

These are detectable without a pre-written rule - because the agent knows what normal looks like.

2. Pre-Promotion Validation Gates

The most effective place to stop bad data is before it reaches the dashboard - at the promotion step, when data moves from raw or transformed tables into reporting layers.

An AI agent sitting at this gate runs a validation check before each promotion:

  • Does this batch match historical baselines within expected variance?
  • Are there new nulls in columns that should never be null?
  • Has the row count changed in a way that cannot be explained by normal volume trends?
  • Did a schema change occur upstream that may have affected this transformation?

If validation fails, the promotion is blocked. The reporting table is not updated. The dashboard continues to show the last known good data - clearly marked as stale - rather than surfacing corrupted numbers.

The CMO sees a freshness warning. Not wrong numbers.

3. Root Cause Tracing

When a data quality issue is detected, the agent does not just flag it. It traces the issue upstream.

Correlating Dataplex scan results, dbt test outputs, BigQuery INFORMATION_SCHEMA metadata, and upstream event data, the agent identifies where in the pipeline the issue originated:

  • A GA4 event that stopped firing at 11:43 PM.
  • A schema change in an upstream source table at 8:15 PM.
  • A transformation query that produced unexpected nulls due to a JOIN condition.

The data team receives a diagnosis - not a validation failure report. They know what broke, where it broke, and what it affected downstream.

4. Downstream Impact Mapping

Bad data in a single BigQuery table rarely stays in that table. It propagates downstream - into joined tables, aggregated datasets, Looker explores, and dashboard tiles.

The agent maps this propagation automatically. When a data quality issue is detected, the impact report shows:

  • Which downstream tables ingested the bad data.
  • Which Looker dashboards are reading from affected tables.
  • Which business teams are looking at potentially corrupted metrics.
  • Which decisions may have already been made on bad data.

That last point is the hardest one. The agent cannot undo decisions. But it can surface the exposure - so teams can quantify the impact and, if necessary, correct course before the damage compounds.

How Tatvic Solves This in Real Environments

Common Failure Patterns We See

Across GA4 → BigQuery implementations, bad data in dashboards rarely traces back to a single failure. It traces back to a gap in the validation architecture - a point where data was trusted without being verified.

The most common gap is at the promotion boundary: where transformed data moves into reporting tables that feed Looker dashboards. Most teams have validation before this point - dbt tests in their transformation layer, some Dataplex rules on key tables. Very few have a validation gate at the promotion step itself.

The three patterns we see most frequently:

  • Schema drift - upstream column renames break downstream transformations silently
  • Stale tables - pipeline recovers but the reporting layer is never revalidated
  • Event changes - a GA4 parameter rename causes key metrics to underreport for days

Example From a Client Environment

In one Tatvic client environment, a GA4 custom event parameter was renamed during a site redesign. The parameter name change was not reflected in the BigQuery transformation. For 11 days, a key conversion metric was underreported by 34%. The issue was discovered when a campaign being considered for budget reduction was found to have actually been the top performer - once the data was corrected.

Eleven days of wrong data. One campaign almost cut. Zero pipeline failures during that entire period.

The pipeline worked perfectly. The validation layer did not exist.

Implementation Approach

Tatvic helps organizations build a validation layer that sits between their BigQuery pipelines and their Looker reporting environment - combining:

  • Dataplex - rule-based governance on key BigQuery tables
  • dbt - transformation-layer testing for expected data assumptions
  • AI validation layer - anomaly detection at the promotion gate, catching what rules miss

The result is a reporting environment where:

  • Bad data is caught before it reaches dashboards - not discovered in a board meeting
  • Data quality issues are diagnosed with root cause context - not just flagged as failures
  • Business teams receive a freshness warning when data is stale - not wrong numbers
  • Downstream impact is mapped automatically - so teams know what was affected and by how much

Priya’s attribution problem would have looked different. The GA4 event parameter change would have been detected at the validation gate during the next promotion cycle. The CMO’s dashboard would have shown a freshness warning - not three days of incorrect conversion data.

The board presentation would have been postponed. Not corrected a week later.

Is Bad Data Reaching Your Dashboards Before You Notice?

If your team discovers data quality issues from stakeholder complaints or wrong numbers in meetings, there is likely a validation gap between your pipeline and your reporting layer.

Tatvic helps GCP-first analytics teams build continuous validation layers across their BigQuery ecosystems - detecting bad data before it reaches dashboards, diagnosing root causes with full pipeline context, and blocking bad data promotions before they affect business decisions.

Most teams don’t know where bad data enters their reporting layer - until leadership questions the numbers. Assess your validation gaps →

Analytics Maturity Model: Which Stage Is Your Business At?

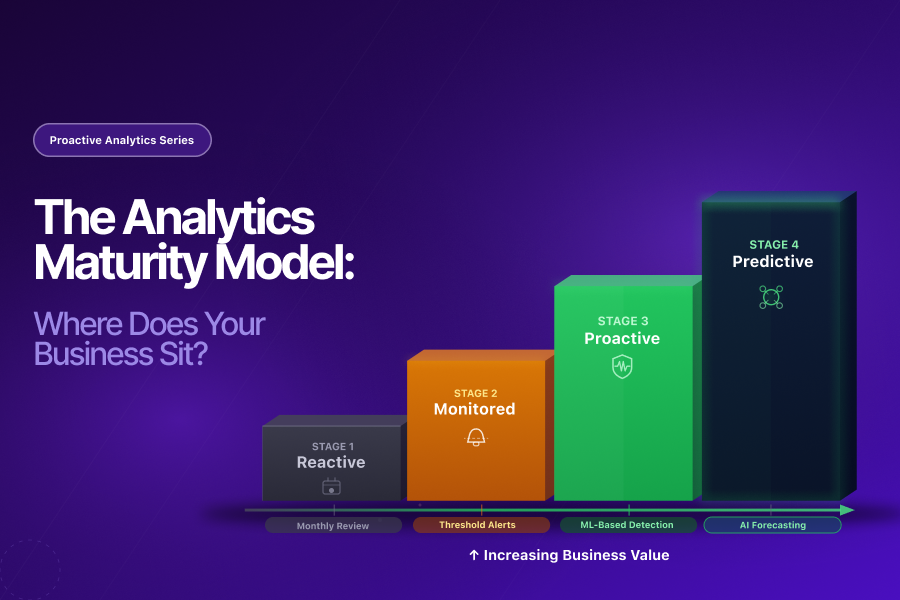
The Analytics Maturity Model: Where Does Your Business Sit?

If you have followed this Proactive Analytics series, you have read about why reactive analytics fails, how to extend your anomaly detection setup, how to build alerts that drive action, and why AI amplifies bad data. Each blog addressed a specific capability. This one takes a step back.

Before investing in any of those capabilities, it helps to know where you are starting from. The analytics maturity model answers that question. It maps out four stages of analytics development, gives you the signals to identify which stage your business is at, and shows what the path forward looks like from each level.

The honest truth is that most businesses are sitting at Stage 1 without knowing it. And the gap between Stage 1 and Stage 3 is not a technology gap. It is a system design gap.

Why Analytics Maturity Matters More Than Analytics Investment

Spending more on analytics tools does not automatically move you up the analytics maturity model. Plenty of businesses have expensive dashboards, GA4 implementations, and BI platforms that still produce insights three weeks after the decisions they should have informed were already made.

McKinsey research puts a number on what mature analytics actually delivers: data-driven organizations are 23 times more likely to acquire customers, 6 times more likely to retain customers, and 19 times more likely to be profitable than those that are not data-driven.

Gartner predicts that by 2026, 65% of B2B sales organizations will transition from intuition-based to data-driven decision-making. But transitioning to data-driven decision-making requires data you can actually trust, delivered at the speed decisions need to be made.

That is exactly what the analytics maturity model measures. Not how much data you collect. How reliably it informs decisions, and how quickly.

The Four Stages of the Analytics Maturity Model

Stage 1: Reactive

What It Looks Like

Analytics is a reporting function. It tells you what happened after it has already happened. Reports are reviewed weekly or monthly. Data issues surface in stakeholder meetings. Audits happen quarterly, if at all.

The Signals You Are Here
  • Last data quality issue was raised by a stakeholder, not an alert
  • GA4 custom insights are not enabled or not acted on
  • Analysts spend more time validating data than analyzing it
  • A known GA4 to CRM discrepancy has existed for weeks
  • Campaign decisions are made on unverified data
The Cost

It shows up silently: campaigns scaled on inflated conversion data, budgets pulled from channels that were working, AI models trained on data that was never clean.

Stage 2: Monitored

What It Looks Like

Basic monitoring is in place. GA4 custom insights are enabled. Threshold-based alerts are configured. Dashboards are reviewed weekly. Issues are found within a week, not a month.

The Signals You Are Here
  • GA4 custom insights active on key metrics
  • Static threshold alerts in place (e.g. “alert when sessions drop 20%”)
  • Alerts fire but are often dismissed or ignored
  • Metric-level anomalies detected, but not parameter-level issues
  • No formal response playbook for alerts received
The Cost

Static thresholds fire during every promotional period and seasonal spike. Teams learn to ignore them. A system nobody trusts eventually protects nothing. Stage 2 is monitored. It is not yet protected.

Stage 3: Proactive

What It Looks Like

Issues are caught before they influence decisions. The monitoring layer is intelligent, contextual, and connected to a response workflow. Resolution is measured in hours, not weeks.

The Signals You Are Here
  • Anomaly detection is ML-driven and adapts to seasonal patterns
  • Data sanity checks run continuously at the parameter level
  • Every alert includes: what changed, by how much, since when, which segment
  • Alerts are tiered P1/P2/P3 with named owners and response SLAs
  • Attribution patterns monitored for channel credit shifts
The Cost of Not Being Here

Businesses at Stage 2 discover tracking failures in monthly reviews. Businesses at Stage 3 resolve them the same day. That gap is where budget decisions, campaign strategies, and stakeholder reports are built on data that was never reliable.

Stage 4: Predictive

What It Looks Like

Analytics anticipates what is likely to happen, not just what went wrong. AI models are trained on continuously validated data and produce forward-looking signals that inform decisions before the data changes.

The Signals You Are Here
  • Predictive metrics (purchase probability, churn, revenue forecasting) are active and acted on
  • AI models produce reliable outputs because the data quality foundation is sound
  • Anomaly detection extends to AI model input data, not just business KPIs
  • Attribution is modeled forward, not just reported backward
  • Automated data quality gates built into the collection pipeline

Gartner’s research found that 63% of organizations either do not have or are unsure if they have the right data management practices for AI. Stage 4 requires Stage 3 as its foundation. Organizations that try to skip directly from Stage 1 or Stage 2 to AI-powered analytics are building on unreliable data. Their models will produce outputs that look confident and compound errors at scale.

Which Stage Are You At? A Quick Self-Assessment

Be honest with yourself here. Many businesses believe they are at Stage 2 when they are actually at Stage 1. The difference is not what tools you have. It is how those tools are actually being used.

You are at Stage 1 if:

  • Data issues are consistently discovered in meetings or stakeholder reviews
  • Your last analytics audit was more than 90 days ago
  • Analysts spend a significant portion of their time on data validation, not analysis

Stage 2 indicators:

  • You have GA4 custom insights enabled but alert on static thresholds
  • Teams regularly receive alerts but rarely act on them.
  • Most teams spot issues within a week, not within 24 hours.

Stage 3 signals:

  • Anomaly detection is active with adaptive baselines on your highest-value KPIs
  • Every alert routes to a named owner with a defined response time
  • Data sanity checks run continuously at the parameter level, not just the metric level

You likely operate at Stage 4 when:

  • Teams train AI models on continuously validated data
  • Predictive metrics actively inform budget and campaign decisions
  • Data quality monitoring extends to AI model input data specifically

Most analytics teams reading this will identify themselves at Stage 1 or Stage 2. That is not a failure. It is a starting point.

The Path Forward: Moving Up the Analytics Maturity Model

The single most important thing to understand about the analytics maturity model is that you cannot skip stages. Each stage is the foundation for the one above it.

From Stage 1 to Stage 2: Start with GA4 custom insights. Enable anomaly detection on your three most important KPIs: revenue, primary conversion events, and your top acquisition source. Set a weekly review cadence for anomalies detected. This is the minimum monitoring layer.

From Stage 2 to Stage 3: Replace static thresholds with ML-driven baselines. Add parameter-level data sanity checks. Build an alert playbook: who receives each alert type, what the first action is, and what the escalation path is. This is where proactive analytics begins in earnest.

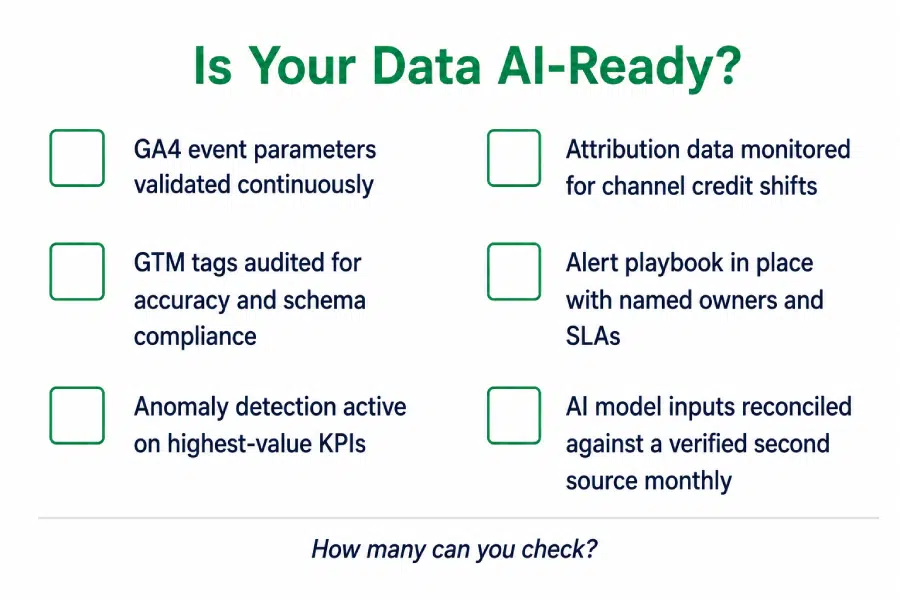
From Stage 3 to Stage 4: Identify the specific metrics, dimensions, and attribution signals that feed your AI models. Extend monitoring to these specifically. Build automated data quality gates into your collection pipeline. Reconcile AI outputs against verified external sources monthly.

The analytics maturity model does not judge maturity by tools deployed. It judges maturity by the speed and reliability of analytics-driven decisions.

The Takeaway

The analytics maturity model is not a theoretical framework. It is a practical diagnostic. Run through the self-assessment honestly and you will know exactly where your business stands and exactly what needs to change to move up.

The businesses that reach Stage 3 and Stage 4 of the analytics maturity model are not necessarily the ones with the largest analytics budgets. They build each layer with intent. Data collection integrity comes first, followed by anomaly detection and alerting before AI enters the picture.

tyle=”font-weight: 400;”>Get the foundation right and every layer above it becomes more reliable, more actionable, and more valuable.

Not sure which stage of the analytics maturity model your business is at? Tatvic’s team can run a structured analytics audit across your GA4 setup, monitoring configuration, and data collection layer and tell you exactly where you stand and what the path forward looks like. Schedule a call with Tatvic’s experts today.
BigQuery Pipeline Failures: How AI Agents Fix Them First

Your Data Pipeline Breaks Every Monday. It Doesn’t Have To.

Priya had done everything right.

She had spent Friday evening double-checking the weekend pipeline schedule. Jobs were queued. Refresh windows were set.

A marketing report was due Monday morning at 9 AM - one that the CMO would open in a client review meeting at 9:30.

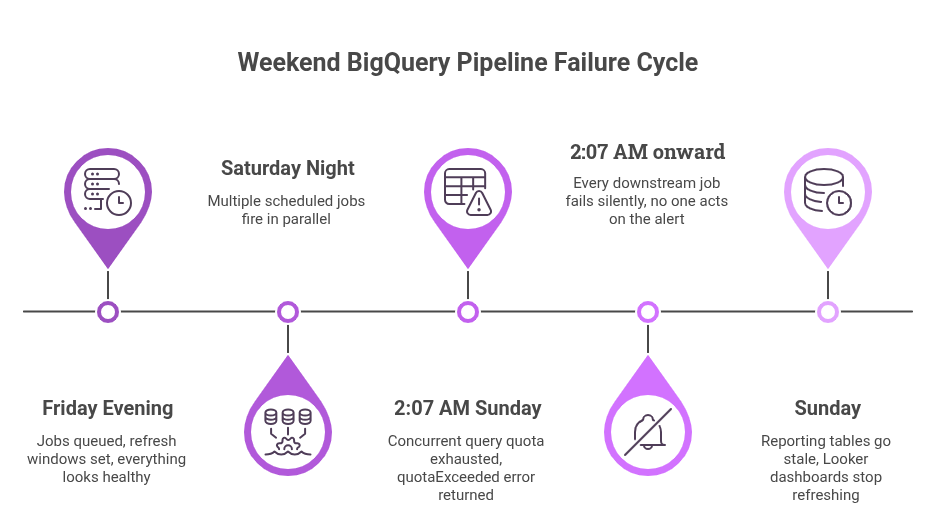
By Saturday night, her BigQuery pipeline was running exactly as planned.

Come Sunday morning, it had quietly failed. And nobody knew.

Monday arrived. Priya’s phone lit up at 8:47 AM.

The dashboard was blank. But the real problem was not the dashboard.

The CMO had a budget reallocation discussion at 9:30 AM. Media teams were preparing spend decisions. Regional teams were waiting on performance trends before launching campaigns.

Nobody knew the numbers were wrong.

That is what makes BigQuery pipeline failures dangerous. They do not just break reports. They quietly break business decisions.

What followed was a familiar scramble - engineers pulled into a thread, logs opened in four browser tabs, Slack messages flying.

Forty minutes of senior data engineer time, burned on diagnosis before the business day had properly begun.

The cause? A BigQuery quota limit had been hit at 2 AM Sunday. Parallel scheduled jobs had exhausted the project’s concurrent query quota.

Every job that ran after that point failed silently. No alert was sent that anyone acted on. Nobody noticed until Priya opened a blank dashboard.

This is not a one-off. According to Monte Carlo’s State of Data Quality report, 68% of data professionals take four or more hours to even detect a pipeline incident - let alone fix it. The Monday morning fire drill is an industry pattern, not a personal failure.

BigQuery pipeline failures like the one Priya experienced are structural. Incompetent engineers or missing alerts are not the cause.

A fundamental gap between what monitoring tools report and what humans need to act - that is what drives them.

This post is about that gap - and how an AI agent closes it.

Why BigQuery Pipeline Failures Always Hit on Mondays

Data pipelines are not evenly distributed across the week. Most teams front-load heavy processing on weekends. The goal is clean, ready dashboards for Monday’s business decisions.

Weekend workloads typically include:

That concentration creates a structural vulnerability

Why failures happen silently: 

  • Upstream systems change without notice.
  • Quota limits reset or get hit overnight.
  • A developer pushes a schema change Friday that breaks a downstream transformation Saturday night.

Each of these events produces a BigQuery pipeline failure. Most of them produce a failure that is entirely silent.

Cloud Composer sends an email when a DAG fails. Error traces land in Cloud Logging. But no one is reading DAG failure emails at 2 AM on a Sunday. The first human signal that something went wrong is almost always a blank cell, a wrong number, or a missing table - discovered at the worst possible moment.

That moment is always Monday morning.

The Quota Exhaustion Problem, Specifically

BigQuery enforces strict limits on concurrent queries, load jobs, and API calls per project. When a pipeline hits these limits, jobs do not queue politely. They fail.

The pattern looks like this: multiple scheduled jobs fire in parallel on Saturday night. By 2 AM, the project has exceeded its concurrent query quota.

Every subsequent job in the pipeline returns a `quotaExceeded` error and stops.

The result:

  • No data flows downstream.
  • Reporting tables go stale.
  • Looker dashboards surface Sunday’s numbers - or nothing at all.

The infrastructure did exactly what it was designed to do. Quota exhaustion is not a bug - it is an enforced limit. What was missing was an intelligent system to catch it, diagnose it, and fix it while there was still time.

While quota exhaustion is one of the most common causes of BigQuery pipeline failures, it is rarely the only one. Schema mismatches, delayed upstream feeds, and orchestration issues often create similar downstream disruption. 

What Tatvic Sees Across GA4 → BigQuery Ecosystems

At Tatvic, we work with organizations running large-scale analytics ecosystems on Google Cloud Platform - GA4 exports into BigQuery, attribution models, Looker reporting layers, campaign performance datasets, and near real-time business dashboards.

Across implementations, one pattern appears consistently:

Teams are rarely missing monitoring. They are missing interpretation.

The issue is not that alerts fail. Monitoring systems surface technical symptoms. Business teams need operational decisions.

A BigQuery pipeline failure means something very different to:

  • A Data Engineer troubleshooting a quotaExceeded error at 2 AM.
  • A Head of Analytics explaining a delayed report to leadership on Monday morning.
  • A Marketing Director waiting on budget allocation data before launching campaigns.

This is where traditional monitoring breaks down - and where Agentic AI monitoring becomes operationally meaningful.

The Real Problem: Alerts That Nobody Can Act On

Most data teams already monitor their pipelines. That is not the issue.

Cloud Composer, the managed Apache Airflow service on GCP, surfaces DAG-level failures. Metric alerts fire from Cloud Monitoring. Some teams even have custom Pub/Sub triggers wired to Slack.

Yet BigQuery pipeline failures keep happening. Reports keep breaking. And engineers keep spending their Monday mornings on triage.

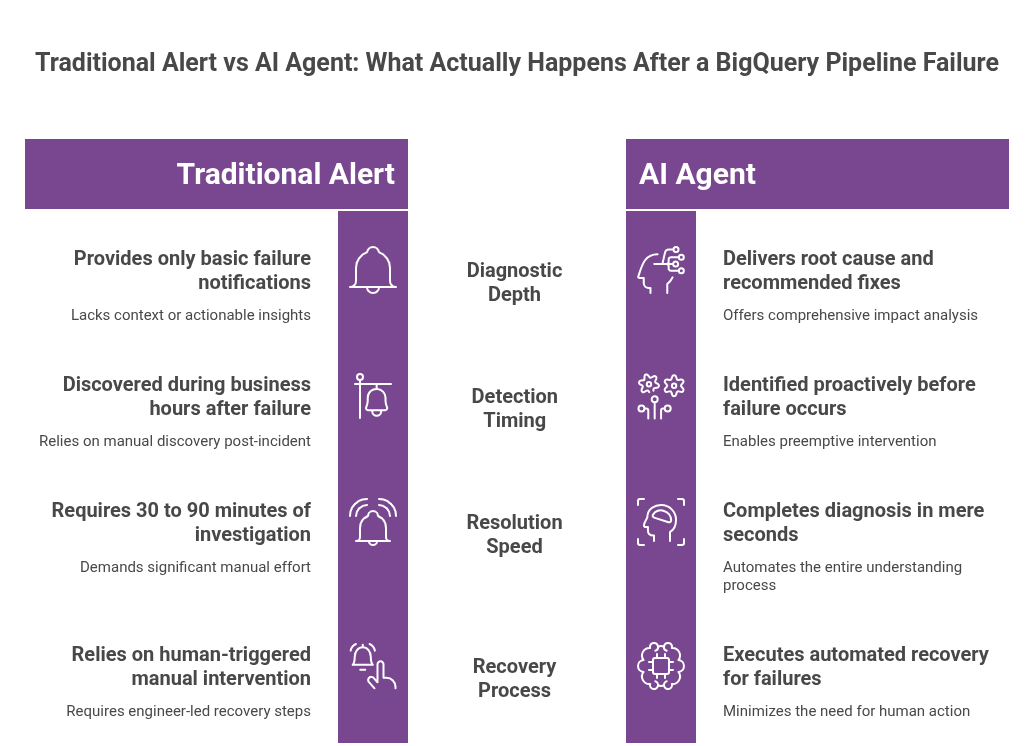
The reason is simple: an alert tells you something failed. It does not tell you why, what it affected, or what to do next.

Consider what happens after a BigQuery pipeline failure alert fires:

  • Notification: An engineer receives an alert. It says “DAG failed.” That’s all.
  • Diagnosis: Which task failed? Was it quota exhaustion? A schema issue? A missing GCS file? This takes 30 to 90 minutes.
  • Impact assessment: Which downstream tables are stale? Which reports are affected? Which teams need to be notified?
  • The fix: Often another 30 to 60 minutes after diagnosis is complete.

According to Monte Carlo’s 2023 data quality survey of 200 data professionals, the average time to resolve a BigQuery pipeline failure - once detected - is 15 hours or more. For Monday morning failures, even a fraction of that cost is unacceptable.

Alerts are not the problem. What happens after them is.

That gap is exactly what an AI agent is built to close

What an AI Agent Actually Does Differently

An AI agent monitoring your BigQuery pipeline does not replace Cloud Composer or Cloud Monitoring.

It sits on top of them - reading their signals, adding context, and turning raw BigQuery pipeline failure data into something a human can actually act on.

Here is what that looks like across four key capabilities:

1. Continuous Quota Monitoring - Before the Failure

The agent does not wait for a BigQuery pipeline failure to occur. Instead, it queries BigQuery’s INFORMATION_SCHEMA in real time to track slot usage, job queue depth, and quota consumption trends across your project.

When usage trends toward the limit, the agent intervenes automatically:

  • Non-critical jobs get rescheduled to off-peak windows.
  • Critical jobs get prioritized.
  • The quota ceiling is never hit.

Priya’s Monday crisis would have ended here - at 1 AM Saturday, not 8:47 AM Monday.

2. Root Cause Identification - Not Just Error Logging

When a failure does happen, the agent does not log it and move on.

Cross-referencing Cloud Logging error traces, INFORMATION_SCHEMA job metadata, and DAG run history, it traces the BigQuery pipeline failure to its source.

Was it:

  • Quota exhaustion?
  • A schema drift upstream?
  • A GCS file that never arrived?

Each failure type has a different fix. The agent identifies which one applies and surfaces it - not as a raw log, but as a structured summary with a recommended action.

3. Downstream Impact Mapping - The ‘So What’

A BigQuery pipeline failure never happens in isolation. One failed job can stale a dozen downstream tables and break three dashboards.

The agent maps these dependencies automatically and generates an impact report showing:

  • Which tables are stale.
  • Which reports are affected.
  • Which business teams need to be informed.

The on-call engineer receives a complete picture - not a starting point for a 90-minute investigation.

4. Proactive Recovery - Fixing It Before Monday

For recoverable BigQuery pipeline failures - quota exhaustion being the most common - the agent takes action automatically:

  • Failed jobs get queued for retry during off-peak windows.
  • Parallel queries get staggered to avoid hitting concurrency limits.
  • Data freshness is verified before Monday morning reports are generated.

The analytics manager’s Monday morning job changes. Instead of firefighting at 9 AM, she reviews a Sunday night summary - a structured digest of what ran, what was caught, what was fixed, and what is ready.

The shift is not just operational. It is a shift in trust. When data is reliable every Monday - not because engineers worked Sunday night, but because an agent handled it - data becomes something the business actually relies on.

How This Fits Into Your Existing GCP Stack

This is not a new infrastructure layer. An AI agent for BigQuery pipeline failure monitoring plugs directly into the tools GCP-based data teams already use.

It reads their outputs, enriches their signals, and closes the gap between alert and action.

Existing System What It Does What the Agent Adds
Cloud Composer Runs and orchestrates DAGs Detects failure points and traces pipeline dependencies
BigQuery INFORMATION_SCHEMA Provides job metadata and execution logs Predicts quota risks and identifies failure patterns
Cloud Logging Captures errors and system signals Diagnoses root causes and prioritizes issues
Pub/Sub + Functions Triggers event-based actions Automates remediation without manual intervention

The agent sits between your pipeline and your team. Every BigQuery pipeline failure it catches autonomously is one fewer Monday morning crisis.

In enterprise analytics environments, BigQuery pipeline failures rarely happen in isolation. One delayed transformation affects the entire downstream chain:

  • Attribution reporting across channels.
  • Media budget decisions in real time.
  • Looker executive dashboards used in leadership reviews.
  • CRM activation workflows triggered by audience data.
  • Experimentation reporting for A/B test decisions.

In one environment Tatvic worked with, a failed overnight attribution refresh caused a performance marketing team to nearly pause a high-performing campaign - because conversion reporting appeared to collapse. The issue was not campaign performance. The BigQuery pipeline had silently failed.

This is why Tatvic approaches Agentic AI for data reliability differently. We do not optimize for pipeline uptime alone. We optimize for business continuity.

The Cost of Reactive BigQuery Pipeline Monitoring

The hidden cost of BigQuery pipeline failures is rarely engineering time.

It is business confidence.

When BigQuery pipeline failures reach reporting:

  • Marketing teams delay campaign decisions waiting for clean data.
  • Finance teams question reporting reliability in investor reviews.
  • Leadership teams lose trust in dashboards they once relied on.
  • Analysts spend time validating numbers instead of driving insights.

According to Monte Carlo, data teams spend 30-40% of their time handling data quality and reliability issues rather than strategic work.

For organizations making high-frequency marketing and media decisions, even a few hours of BigQuery pipeline disruption can translate into:

  • Delayed campaign optimization.
  • Wasted media spend on wrong attribution signals.
  • Missed revenue opportunities from paused high-performing campaigns.

This is why leading organizations are increasingly treating BigQuery pipeline failure prevention as a growth enabler - not simply a technical maintenance task.

Proactive BigQuery Pipeline Failure Monitoring Is the New Baseline

Most analytics teams treat BigQuery pipeline failures as an engineering problem - set up alerts, assign on-call rotations, and respond when something breaks.

That framing is wrong, and it is expensive.

Pipeline reliability is not an engineering problem. At its core, it is a trust problem.

The analytics manager is the one sitting in the CMO’s meeting when the dashboard is wrong. Engineers built the pipeline, but the business owns the consequences when it breaks.

Agentic AI shifts the posture from reactive to proactive:

  • From: “We’ll fix it when it breaks, and explain the delay later.”
  • To: “We caught it over the weekend. Everything is ready for Monday.”

This is not a luxury for large data teams with dedicated reliability engineers. For any team where analytics drives business decisions, proactive BigQuery pipeline failure monitoring is the new baseline - not a nice-to-have.

Key Takeaways

  • BigQuery pipeline failures typically happen over the weekend - quota exhaustion, upstream schema changes, or missed file arrivals - and surface Monday morning as wrong or missing data.
  • The root cause is not missing alerts. Standard monitoring tools like Cloud Composer and Cloud Logging already fire. The gap is between alert received and root cause understood.
  • According to Monte Carlo’s research, data teams spend 30 to 40 percent of their time handling BigQuery pipeline failures and data quality issues - time that should be spent on work that drives actual business value.
  • An AI agent closes the alert-to-action gap by monitoring quota consumption proactively, diagnosing BigQuery pipeline failures with full context, mapping downstream impact, and recovering automatically where possible.
  • Proactive BigQuery pipeline failure monitoring is not advanced. For teams where analytics powers business decisions, it is the new reliability baseline.

Still discovering pipeline failures on Monday morning?

If your dashboards are the first place your team notices data problems, there is likely a reliability gap in your analytics ecosystem.

Tatvic helps GCP-first teams proactively monitor BigQuery pipelines, diagnose failures automatically, and recover before business teams feel the disruption.

Assess Your BigQuery Reliability

Real Estate Lead Generation Analytics: Fix Tracking Failures

 The Hidden Cost of Form Tracking Failures in US Real Estate Lead Generation

For property portals and listing platforms operating in the US market, real estate lead generation analytics is the foundation of every business decision. It informs every major growth decision, from which campaigns deserve more budget to which markets and listing categories drive the strongest inquiry quality.

All of it runs on analytics data. And the single most important data point in that system, the form submission, is also the most fragile one.

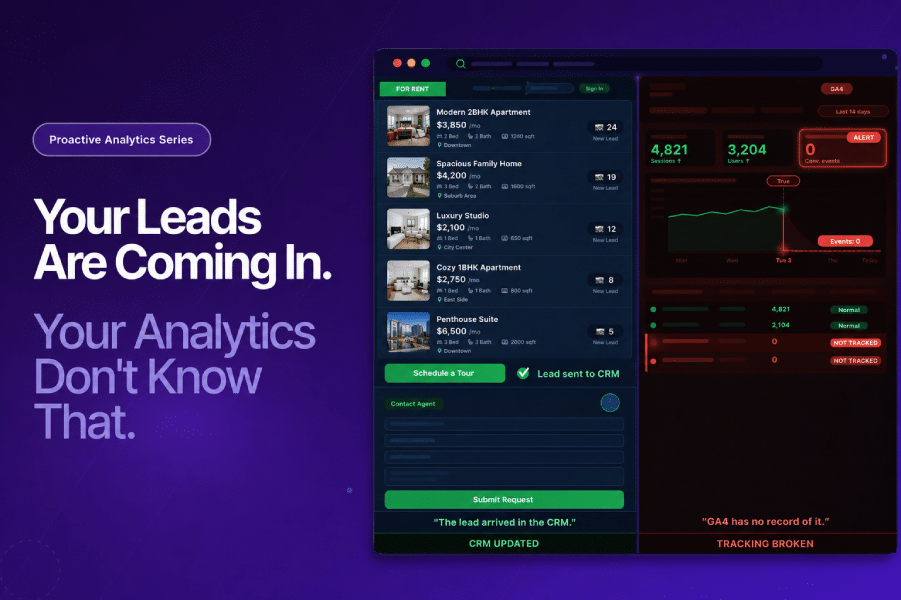
A form tracking failure in GA4 does not announce itself. The inquiry form still works. Users still submit their details. Leads still land in the CRM. But GA4 stops recording them. And everything downstream of that missing data, campaign performance reporting, cost per lead calculations, channel attribution, gets quietly distorted.

This is the real estate lead generation analytics problem that costs US property portals the most, and gets investigated the least.

The US Property Portal Lead Generation Stakes

The US real estate market is unambiguously digital. According to Zillow’s 2025 Consumer Housing Trends Report for Agents, 36% of sellers now find their agents through online channels, more than double the 15% share recorded in 2018. Among buyers, 33% say online research played a key role in selecting their agent.

For property portals and listing platforms, this digital shift is the entire business model. Every page view on a property listing, every saved search, every inquiry form submitted is a lead generation event. The NAR 2025 Technology Survey found that 24% of real estate professionals now spend over $500 per month on technology tools alone, reflecting how central digital infrastructure has become to the industry.

In this environment, real estate lead generation analytics is not a reporting function. It is an operational one. When the analytics are wrong, the operational decisions made from them are wrong too.

The Form Tracking Problem That Property Portals Underestimate

A typical US property portal has multiple form-based conversion events across its listing pages:

  • Property inquiry forms (“Contact Agent” or “Request Info”)
  • Schedule a Tour or Schedule a Showing requests
  • Rental application initiation forms
  • Save a Search or Create an Alert sign-ups
  • Mortgage calculator lead capture forms

Each of these is a distinct conversion event that needs to be tracked correctly in GA4 to inform real estate lead generation analytics. And each of them is a point where tracking can fail silently.

How Form Tracking Fails on Property Portals

Form tracking failures on property portals follow a consistent set of patterns:

GTM container updates after feature launches.

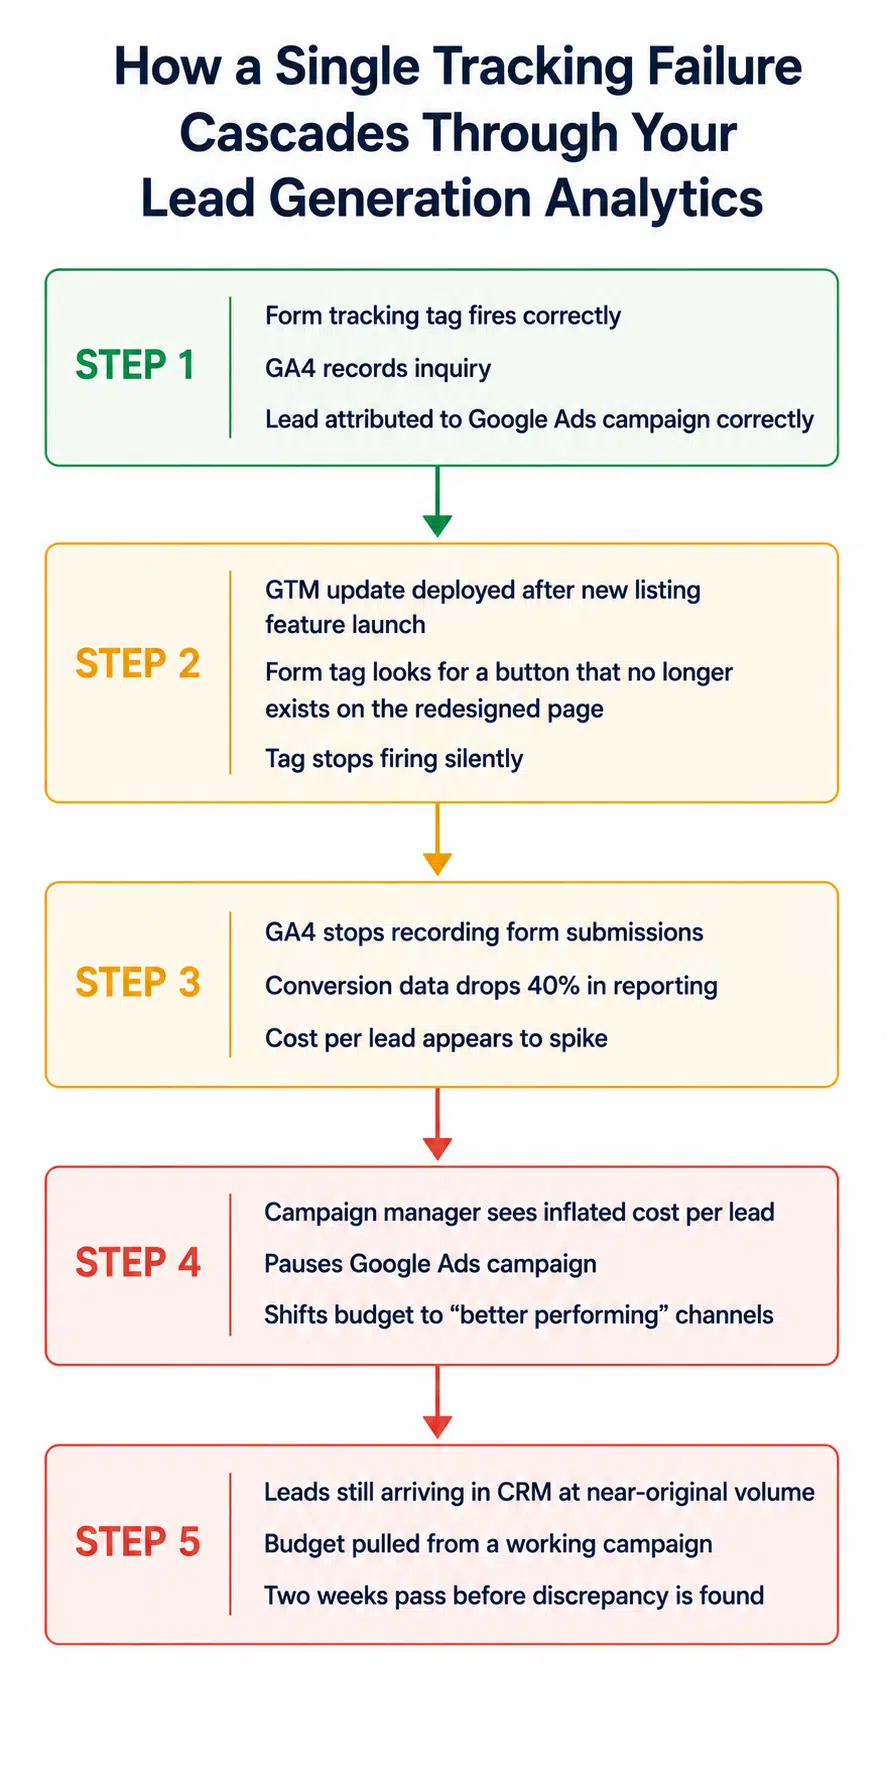
A new listing feature, a redesigned search experience, or a mobile UX update gets pushed to production. The GTM container is updated as part of the deployment. A form trigger that was firing correctly now looks for a button or form field that no longer exists in the redesigned page. The tag stops firing entirely. GA4 conversion data drops. Nobody catches it during deployment because the form itself still submits correctly from a user perspective.

Mobile vs desktop tracking discrepancies.

US property portal traffic skews heavily toward mobile. A “Schedule a Tour” button event that fires correctly on desktop may not fire at all on mobile if the GA4 event configuration uses a click class that differs between device types. Mobile leads vanish from real estate lead generation analytics entirely. The platform sees lower mobile conversion rates and draws incorrect conclusions about mobile campaign performance.

Cross-domain tracking failures between listing pages and application portals.

Many US rental platforms use a separate subdomain or third-party application for the rental application process. When a user moves from the listing page to the application portal, if cross-domain tracking is not configured correctly in GA4, the session resets. The completed application attributes to “direct” rather than to the paid search or display campaign that brought the user to the listing.

Form confirmation page tracking errors.

Some property portals fire GA4 conversion events on the thank-you page after a form submission, rather than on the form submission event itself. If the confirmation page URL changes, is cached differently on mobile, or becomes inaccessible due to a redirect change, the conversion event stops firing. Leads are still coming in. GA4 has no record of them.

How Form Tracking Failures Cascade Into Business Decisions

This is where real estate lead generation analytics failures become genuinely expensive. Not because the leads are lost, but because the decisions made from the distorted data cost more than the tracking fix would have.

Here is a scenario that plays out regularly on US property portals:

A platform running a Google Ads campaign targeting apartment renters in Chicago has been averaging 340 qualified leads per week with a cost per lead of $42. A new listing page redesign goes live on a Tuesday. By Thursday, GA4 is recording 190 leads per week from the same campaign. Cost per lead appears to have jumped to $75.

The campaign manager sees the cost per lead spike in the dashboard. They reduce the Google Ads budget by 40%, reasoning that the campaign has become inefficient. The budget is reallocated toward an organic content push that appears to be holding its conversion numbers because its separate landing page was not affected by the GTM change.

Leads are still coming in at close to the original volume. The CRM is still receiving around 320 inquiries per week. But GA4 shows 190 because the form tag stopped firing on the redesigned listing pages. The campaign that was working at $42 per lead is now running at a reduced budget because the real estate lead generation analytics said otherwise.

Two weeks later, a monthly performance review catches the discrepancy between GA4 lead volume and CRM intake. The investigation begins. The GTM error is found and fixed. But two weeks of reduced Google Ads budget have already passed, and the platform lost competitive positioning in the Chicago rental market during a peak leasing period.

This is the 100x cost problem identified in proactive analytics research: catching the issue at the point of entry costs almost nothing. Finding it two weeks later costs significantly more.

What Proactive Monitoring Looks Like for US Property Portal Analytics

Protecting real estate lead generation analytics requires monitoring at the tracking layer, not just the reporting layer. By the time a discrepancy between GA4 and the CRM is visible in a monthly review, the business decisions have already been made.

Anomaly detection on form submission event volume.

Set intelligent baselines for each form event by device type, listing category, and traffic source. When mobile “Schedule a Tour” events drop 35% over 48 hours without a corresponding traffic decline, that is a tracking anomaly, not a lead gen performance drop. Tatvic’s anomaly detection solution applies ML-driven baselines specifically to conversion events, not just traffic metrics.

Continuous GTM tag validation after every deployment.

Every site update, feature launch, or GTM container change is a potential tracking failure point. Automated validation of form tracking tags after each deployment confirms that events are still firing correctly before the analytics data has time to mislead campaign decisions. Tatvic’s data sanity automation runs these checks continuously, not just at scheduled audit intervals.

Weekly reconciliation of GA4 lead volume against CRM intake.

For US property portals, the CRM is the ground truth for lead volume. Building a weekly reconciliation step that compares GA4-recorded form submissions against CRM lead intake catches tracking gaps before they compound. A consistent 15% gap between the two systems is a signal worth investigating immediately.

A response playbook for form tracking failures.

As covered in Tatvic’s analytics alerting system blog, a P1 alert for a form tracking failure on a primary conversion event needs a named owner, a one-hour response SLA, and a defined escalation path to the development team. For a US property portal running paid campaigns with significant daily budgets, a same-day response to a form tracking failure prevents the campaign decision cascade described above.

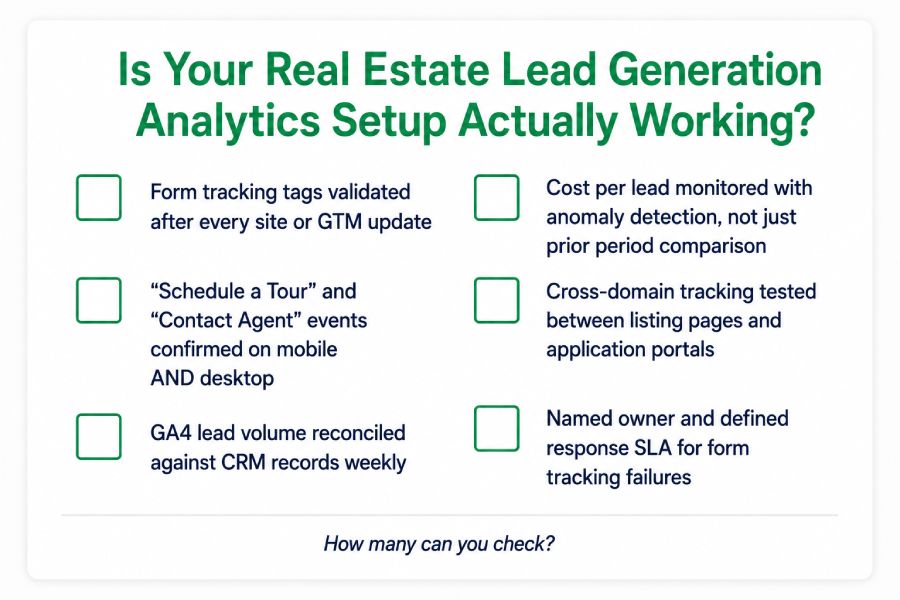
Is Your Real Estate Lead Generation Analytics Setup Actually Reliable?

Before the next campaign launch, run through this:

  • Has every form tracking tag been validated since the last site or GTM update?
  • Are “Schedule a Tour” and “Contact Agent” events confirmed firing on both mobile and desktop separately?
  • Is GA4 lead volume reconciled against CRM records at least weekly?
  • Is cost per lead monitored with anomaly detection, or just compared manually to the prior period?
  • Is cross-domain tracking configured and tested between your listing pages and any third-party application portals?
  • Is there a named owner and a defined response time for form tracking failures?

For US property portals running paid campaigns across Google, Meta, and listing network placements, each of these gaps represents a potential decision failure waiting to happen.

The Takeaway

Real estate lead generation analytics is only as strong as the tracking layer behind it. For US property portals and listing platforms, every qualified inquiry carries a measurable acquisition cost, and every campaign decision depends on accurate conversion data. When form tracking breaks, the impact goes far beyond analytics.

High-performing campaigns get deprioritized, budgets shift in the wrong direction, and growth decisions are made on incomplete data. What looks like a reporting issue quickly becomes a business cost. The competitive positioning lost during a peak leasing season does not come back.

Proactive monitoring of form tracking health, combined with intelligent anomaly detection on conversion event volume and a clear response playbook, turns real estate lead generation analytics from a lagging indicator into a live operational signal. That is the difference between a portal that discovers tracking failures in monthly reviews and one that resolves them the same day they begin.

Running lead generation campaigns across your property portal and want to make sure your GA4 tracking is giving you the full picture?

Tatvic’s team can audit your form tracking setup, GTM configuration, and cross-domain tracking health across your US listing platform. Schedule a call with Tatvic’s experts today.

Programmatic Ad Revenue: Why Publishers Lose It Silently

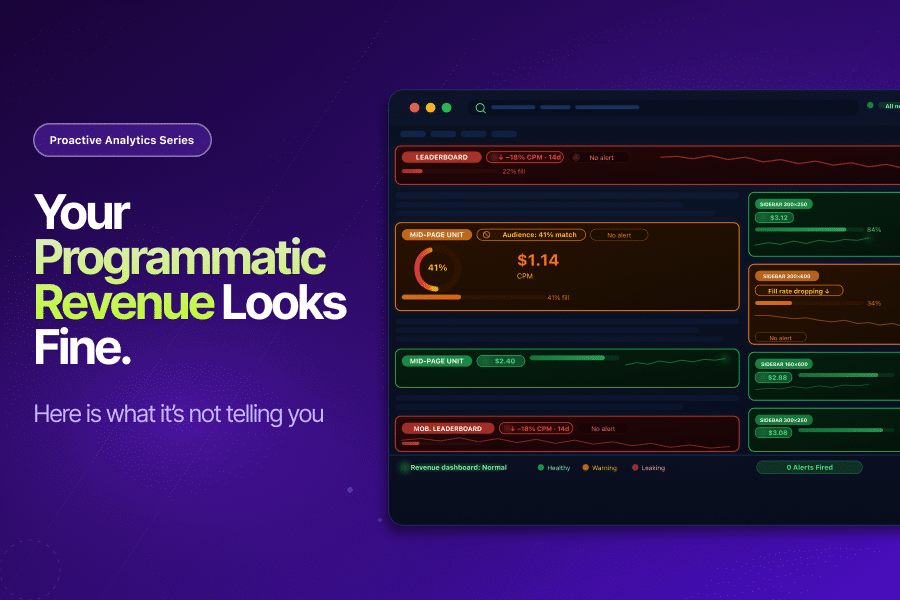
Why Media Publishers Are Losing Programmatic Ad Revenue Without Knowing It

Every publisher knows that programmatic ad revenue is the engine of their digital business. Most publishers also know that CPMs fluctuate, fill rates vary, and some revenue loss is just part of how the ecosystem works. What far fewer publishers know is how much of that lost programmatic ad revenue is not a market problem. It is a data problem. One that is entirely preventable.

The mechanics of programmatic advertising are unforgiving when it comes to data quality. An advertiser’s DSP decides what to bid on your inventory based on the audience signals your pages send. Those signals come from your first-party data, your GA4 setup, your audience collection tags, and the behavioral data your analytics stack captures.

When any part of that data chain breaks silently, your inventory looks less valuable than it actually is. CPMs drop. Fill rates decline. And your revenue dashboard shows numbers that look normal, because they are only slightly lower than they were last week, and slightly lower the week before that.

By the time anyone notices, weeks of compressed programmatic ad revenue have already been lost.

The Revenue Stakes Are Too High to Accept Passive Monitoring

The numbers put this in context.

According to the IAB/PwC Internet Advertising Revenue Report for Full Year 2025, the digital advertising industry reached nearly $300 billion in revenue in 2025, a 13.9% year-over-year increase and the highest level in the report’s 30-year history. Programmatic is the dominant mechanism through which publishers access this market.

eMarketer forecasts that programmatic ad sales on properties owned by digital publishers will reach $22.69 billion by 2027. For most publishers, programmatic ad revenue is not a secondary revenue stream. It is the primary one.

At this scale, even a silent 10% compression in effective CPMs across a publisher’s inventory translates to significant annual revenue loss. The problem is that a 10% CPM compression over four weeks rarely looks like a crisis in a dashboard. It looks like normal market volatility. It gets attributed to seasonal slowdowns or advertiser budget cycles. The data problem underneath it goes unfound.

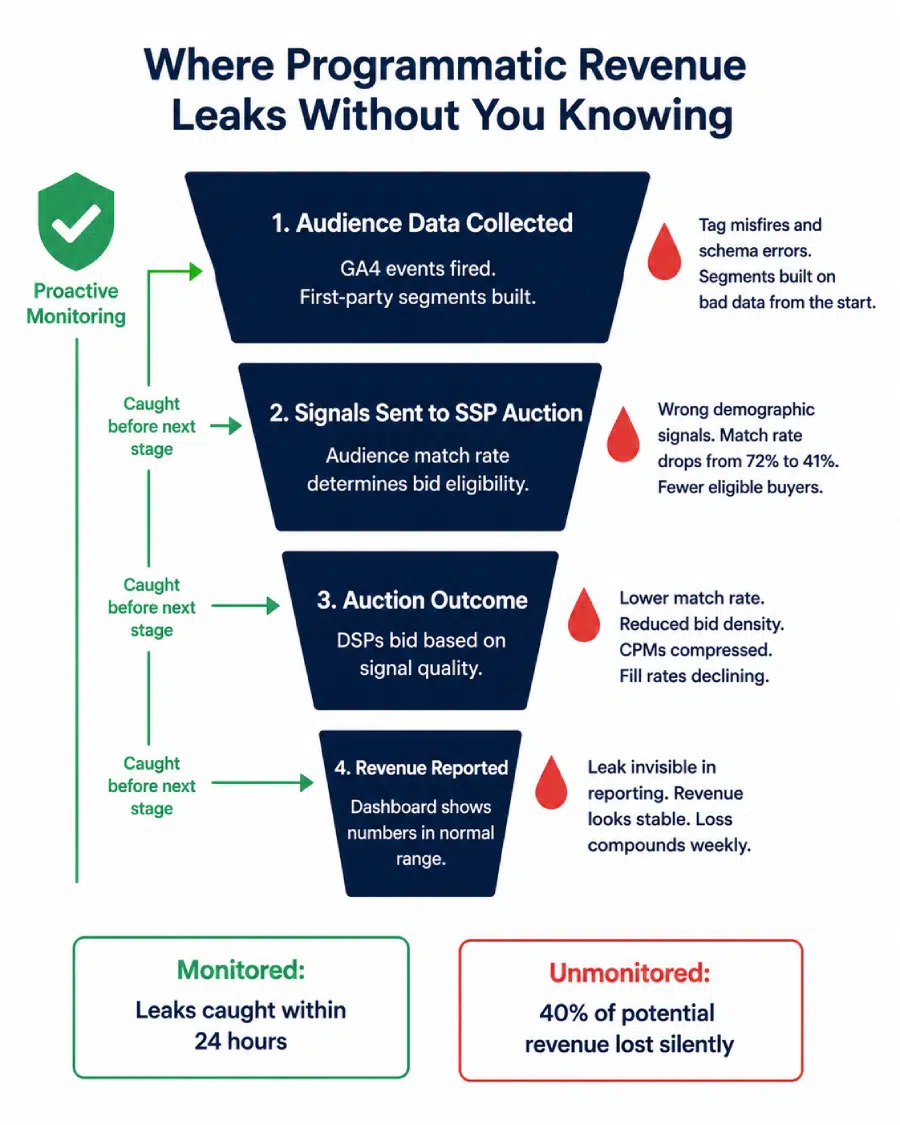
How Data Failures Silently Drain Programmatic Ad Revenue

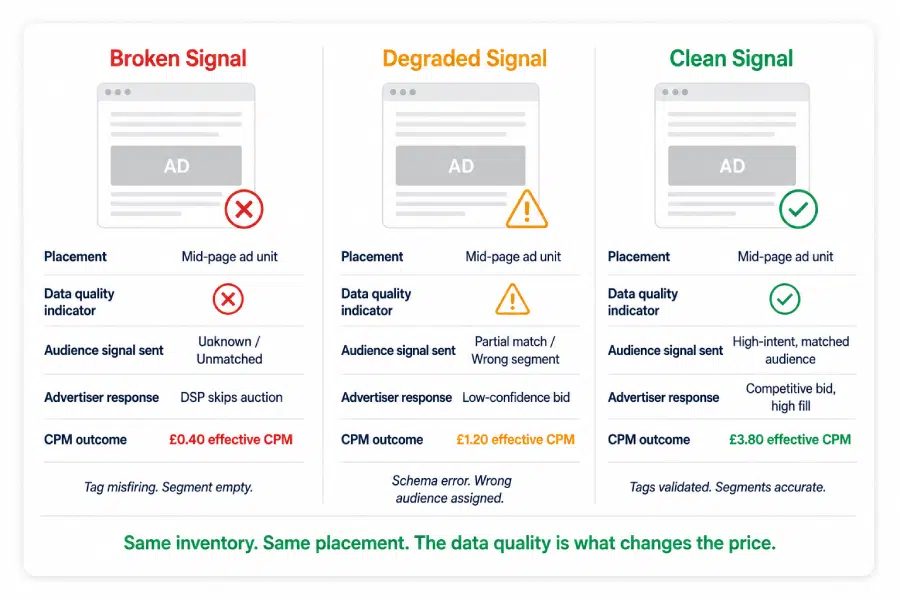
Programmatic ad revenue does not just depend on traffic volume. It depends on the quality and accuracy of the signals your inventory sends to advertisers. Those signals come from your data stack. When the data stack has problems, the signals degrade, and the programmatic revenue follows.

Here is how that happens in practice:

Audience Segment Tags Misfiring

Your first-party audience data is one of the primary signals that determines what advertisers bid for your inventory. When tags misfire, send incorrect values, or stop firing altogether, they feed bad data into your audience segmentation - causing teams to build targeting strategies on inaccurate signals.

An advertiser looking to reach 25-to-34-year-old users with purchasing intent does not lower their bid. Advertisers simply stop bidding on your inventory because the signal that should have identified their target audience never reached them correctly. The auction happens without them. Your programmatic ad revenue reflects that absence without ever explaining it.

GA4 Data Collection Errors Corrupting Audience Quality

GA4 is increasingly the source layer for first-party audience data in publisher environments. Configuration errors in GA4, parameter mismatches, and event schema issues do not just corrupt your analytics reports. They corrupt the behavioral signals that flow from GA4 into your audience building and monetisation stack.

A page category parameter passing incorrect values will cause users to be placed in the wrong content segments. Users in incorrect segments attract the wrong advertisers at lower CPMs. The programmatic ad revenue impact is real, but it is invisible in standard reporting because the impressions are still being served and the revenue is still coming in. Just at a lower rate than it should be.

CPM Floor Price Anomalies Going Undetected

Publishers set floor prices to protect the value of their inventory. When teams misconfigure floor prices - setting them too high and reducing fill rates, or too low and compressing CPMs - programmatic ad revenue takes a direct hit. In reactive monitoring environments, teams often uncover these issues during monthly revenue reviews instead of catching them in real time.Weeks of suboptimal floor pricing pass before anyone investigates.

Viewability Drops Eroding Advertiser Confidence

Advertisers increasingly buy on viewability standards. When a technical change, a layout update, or a lazy-loading configuration causes viewability to drop below buyer thresholds, affected placements start losing bid density. CPMs fall. Some buyers apply exclusions. The programmatic ad revenue impact compounds over time as the inventory’s perceived quality deteriorates in DSP algorithms.

Why Reactive Monitoring Is Not Enough for Programmatic Publishers

Most publishers monitor their programmatic ad revenue reactively. They review weekly revenue reports, compare CPMs against prior periods, and investigate anomalies when someone flags a number that looks wrong.

The problem is that programmatic revenue problems rarely look obviously wrong in aggregate reporting. A 12% drop in CPMs across mobile placements over two weeks, caused by an audience tag misconfiguration, will be visible in detailed SSP reporting but easily explained away as mobile market seasonality. A fill rate decline from 78% to 64% over three weeks, caused by a floor price error introduced during a CMS update, looks like normal programmatic variance until it doesn’t.

This is the same pattern we identified in the context of proactive analytics across marketing analytics. Data problems look like market problems until someone investigates the data. By then, the revenue has already been lost.

The Data Quality Connection

The IAB’s State of Data report found that 71% of brands, agencies, and publishers are currently growing or planning to grow their first-party data sets, nearly double the rate from two years earlier. The shift toward first-party data is accelerating because the industry recognizes that audience signal quality is the primary driver of programmatic ad revenue in a privacy-first world.

But collecting more first-party data does not help if the collection infrastructure is unreliable. More data collected incorrectly is more incorrect audience signals sent to the programmatic ecosystem. The investment in first-party data strategy only returns value when the data quality layer beneath it is sound.

What Proactive Monitoring Looks Like for Programmatic Publishers

Protecting programmatic ad revenue requires monitoring at the data layer, not just at the revenue reporting layer. Waiting for revenue reports to surface a problem is waiting for the 100x cost stage, as covered in Tatvic’s proactive analytics series.

Here is what proactive monitoring looks like specifically for publisher programmatic environments:

Anomaly detection on CPM and fill rate by placement, device, and content category.

Rather than monitoring aggregate programmatic ad revenue, set intelligent baselines for CPMs and fill rates at the segment level: by device type, by content category, by ad placement. When mobile CPMs drop 15% over 48 hours without a corresponding market-wide shift, that is an anomaly worth investigating immediately. Tatvic’s anomaly detection solution applies this logic to publisher-specific KPIs, not just marketing metrics.

Continuous validation of audience segment tags.

The tags that collect first-party audience data need the same continuous validation as conversion tags in an e-commerce environment.

  • Are they firing on the right pages?
  • Are they passing the correct values?
  • Are they populating the intended segments?

Data sanity automation catches parameter-level errors in audience collection before they corrupt segment quality and suppress CPMs.

GTM health monitoring for publisher environments.

Publisher sites typically run complex GTM containers with audience tags, analytics tags, ad tech tags, and consent management scripts all coexisting. Tag conflicts, ghost tags, and misconfigured triggers in publisher GTM containers directly affect the accuracy of audience data collection. Continuous GTM health monitoring catches these issues as they develop, not during an annual ad tech audit.

An alert playbook specific to programmatic revenue signals.

As covered in the analytics alerting system blog, an alert without a named owner and a defined response is just noise. For publishers, P1 programmatic alerts (significant CPM drop, fill rate collapse, audience match rate decline) need a response workflow that connects the analytics team, the ad operations team, and the technical team quickly enough to limit revenue loss.

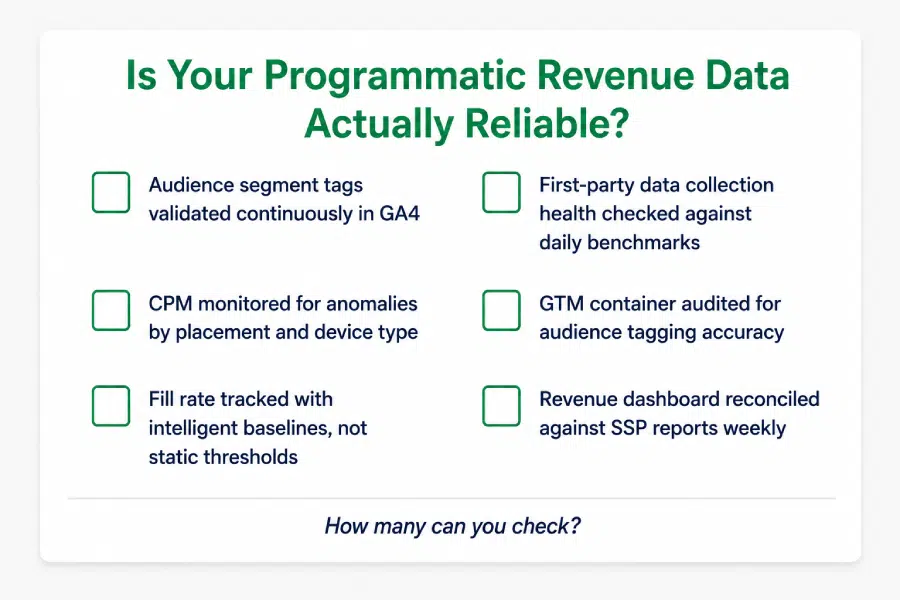
Is Your Programmatic Revenue Being Protected?

Before accepting the next CPM dip as normal market variance, run through this:

  • Are audience segment tags validated continuously or only audited periodically?
  • Is CPM monitored by placement and device type with intelligent anomaly detection?
  • Does your fill rate tracking account for expected baselines, or is it compared against a single prior period?
  • Has your GTM container been reviewed for audience collection accuracy in the last 90 days?
  • When a programmatic revenue anomaly is flagged, is there a named owner and a defined response time?
  • Are your GA4-sourced audience segments reconciled against SSP audience match rates regularly?

If two or more of these are not in place, your programmatic ad revenue is being managed reactively. Market conditions will always fluctuate. Data quality issues should not be allowed to compound on top of them.

The Takeaway

Programmatic ad revenue at scale is a data quality problem as much as it is a market problem. The signals your inventory sends to DSPs, the audience data feeding your first-party segments, and the behavioral data your analytics stack collects are all points where silent failures reduce what advertisers bid for your inventory.

Proactive monitoring does not change the market.But it ensures teams investigate genuine market shifts - not data failures that slipped through, went unnoticed for 24 hours, and quietly compressed programmatic ad revenue for weeks.

In a market that reached nearly $300 billion in 2025 and is still growing, the publishers who protect their programmatic revenue most effectively will not necessarily be the ones with the most traffic. They will be the ones whose data is most reliably telling advertisers the truth about their audiences.

Want to understand where your programmatic ad revenue may be leaking silently? Tatvic’s team can audit your GA4 setup, audience collection tags, and GTM configuration to identify exactly where data quality issues are suppressing your CPMs and fill rates. Schedule a call with Tatvic’s experts today.
AI Analytics: Why Bad Data Gets Worse When AI Gets Involved

When AI Makes Bad Data More Dangerous: The Case for Data Quality AI Analytics

Every blog in this Proactive Analytics series has built toward this point.

We’ve covered why reactive monitoring fails businesses in Proactive Analytics, how to extend your detection layer in Anomaly Detection in GA4, and how to build alerts that actually drive action in Building an Analytics Alerting System. The thread running through all of it has been simple: bad data caught late costs far more than bad data caught early.

But there’s a new dimension to that argument now. One that makes data quality AI analytics not just a best practice but a business survival question.

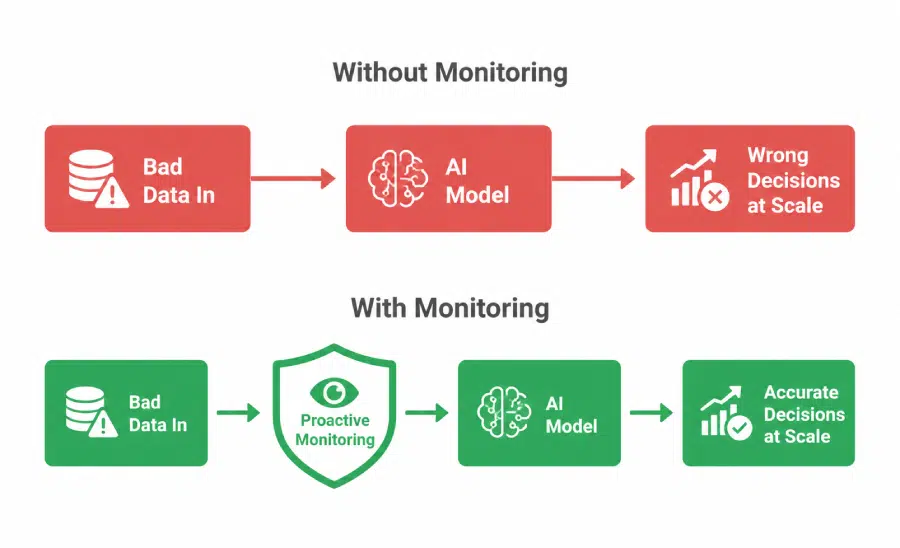
AI doesn’t catch bad data. It amplifies it.

AI Is Already in Production. And It’s Hungry for Your Data.

Let’s be clear about where things stand. Data quality AI analytics isn’t a future problem to prepare for. It’s a present one, happening right now, inside organizations that have already deployed AI models in marketing and analytics.

Gartner’s April 2026 research surveyed 353 data and analytics leaders and found something telling:

  • Organizations with successful AI initiatives invest up to 4x more in data quality, governance, and AI-ready foundations than those with poor outcomes
  • Only 39% of technology leaders are confident their current AI investments will deliver a positive financial impact

That gap between investment and confidence isn’t a technology problem. It keeps coming back to the same root cause: the data feeding these AI models isn’t ready for them. Data quality AI analytics is where the gap lives, and most organizations haven’t closed it yet.

And what exactly is that data? It’s your GA4 data. Your attribution data. Your campaign performance data. The same data this series has shown can be quietly corrupted by GTM misconfigurations, UTM parameters stripped in redirects, cross-domain tracking gaps, and parameter-level schema mismatches that nobody catches for weeks.

When that data lived only in reports, the damage was contained. A bad report informed a bad decision. When that same data feeds an AI model, one bad input becomes thousands of bad outputs.

Here’s What Nobody Tells You About AI and Data Quality

Most conversations about AI failure focus on the model. Wrong architecture, wrong training approach, not enough data. That’s rarely where the real problem is, and it’s why data quality AI analytics deserves its own conversation entirely.

Think about what an AI model actually does.

  • It takes what you give it, finds patterns in it, and applies those patterns to new situations.
  • It doesn’t have intuition.
  • It can’t look at a number and think “that seems off.”

A human analyst reviewing a GA4 report might notice that revenue looks inflated, trace it back upstream, and find a double-firing purchase event. An AI model won’t. It’ll learn that inflated revenue is normal, build its patterns around that assumption, and confidently produce outputs based on it.

That’s not a flaw in the AI. It’s working exactly as designed. The failure is upstream, in the data quality layer that was never built to support it.

Here’s what poor data quality AI analytics looks like in practice:

When predictive models train on bad data, they predict badly at scale.

Say a purchase propensity model trains on GA4 data where conversion events were double-firing for three weeks. It learns those inflated patterns as its baseline. The high-value audiences it identifies are built on fictional behaviour. Campaigns targeting them underperform, and even after the data issue is fixed, the model needs time to unlearn what it was taught.

When attribution models get corrupted channel data, they misallocate budget systematically.

An AI-driven attribution model fed two months of data where paid social conversions were misattributing to direct traffic will learn to undervalue paid social. Every budget recommendation it produces carries that bias forward. The error doesn’t stay static, it compounds across every campaign cycle.

When personalisation engines get the wrong behavioural signals, they deliver the wrong experiences.

A personalisation model running on product interaction data corrupted by parameter schema errors optimises for signals that were never accurate. Users get recommendations built on behaviour that was never correctly recorded. Engagement drops. The team looks at the model, not the data.

In each of these scenarios, the AI model isn’t making mistakes. It’s faithfully processing exactly what it was given. The problem was never the model. It was the data quality AI analytics foundation that was never properly built beneath it.

What the Numbers Say

Gartner has been direct about this, and the research comes straight from their own published reports, not interpretation.

Gartner’s February 2025 survey of 248 data management leaders found:

  • 63% of organizations either don’t have or aren’t sure they have the right data management practices for AI
  • Through 2026, Gartner predicts organizations will abandon 60% of AI projects that aren’t supported by AI-ready data

The 2026 Gartner Magic Quadrant for Augmented Data Quality Solutions puts a forward-looking number on the response: by 2027, 70% of organizations will adopt modern data quality solutions to support their AI adoption. The market is moving toward data quality AI analytics investment because it has to.

Most recently, Gartner’s May 2026 research predicted that 40% of organizations deploying AI will implement dedicated observability tools by 2028 to monitor model performance, bias, and outputs continuously. Gartner’s recommendation is explicit: mandatory monitoring policies for all production deployments, with continuous tracking of data quality metrics.

Meanwhile, poor data quality already costs the average organization $12.9 million annually according to Gartner. That’s before you factor in AI. Once AI is in the mix, decisions made on bad data happen faster, reach further, and carry more confidence behind them. The cost of weak data quality AI analytics doesn’t stay the same. It scales.

What “AI-Ready Data” Actually Means in Practice

Gartner defines AI-ready data as data that is aligned to specific use cases, actively governed at the asset level, supported by automated pipelines with quality gates, and continuously quality-assured.

That last word, “continuously,” is where most data quality AI analytics setups break down. Traditional data management works in cycles: quarterly audits, annual governance reviews, periodic pipeline checks. AI models in production need data quality signals measured in hours, not quarters. That mismatch is exactly where most data quality AI analytics failures originate.

The proactive monitoring capabilities covered across this series address each layer of that gap directly:

  1. Continuous parameter validation makes sure what enters GA4 is accurate before it becomes a training signal for anything downstream. A purchase event passing the wrong currency code doesn’t just corrupt one report. It corrupts every model trained on that data, potentially for months. This is data quality AI analytics at the collection layer.
  2. Anomaly detection on AI input metrics watches for shifts in the data patterns that feed your models. When paid social’s share of attribution credit drops sharply without a corresponding spend change, that’s not just an attribution problem. It’s a signal that your attribution model’s training data is being distorted. Catching it in hours rather than weeks stops the model from learning the wrong lesson.
  3. GTM health monitoring protects the collection layer everything else depends on. Tatvic’s anomaly detection solution works at this layer, making sure the events and parameters feeding your analytics and AI tools are collected accurately and consistently.
  4. A response playbook with defined SLAs closes the loop. Detecting a data quality issue and not acting on it before the next model training cycle is the same as not detecting it at all. Good data quality AI analytics means the alert triggers a response fast enough to matter.

Building the Stack That Protects Your AI Investment

Getting data quality AI analytics right isn’t a single project. It’s a sequence of capabilities, each protecting the layers above it. The order matters.

Start with data collection integrity.

Everything else sits on top of this. Validate event parameters, monitor GTM health continuously, and run automated sanity checks on what enters GA4. If this layer is unreliable, your entire data quality AI analytics foundation is compromised before any model sees it.

Add anomaly detection on your model input data specifically.

Don’t just monitor headline KPIs. Identify the exact metrics, dimensions, and attribution signals that your AI models use as inputs and set intelligent monitoring on those. A shift in these signals that goes undetected becomes a corrupted training dataset. It’s that straightforward.

Build alert-to-action workflows for data quality issues.

When something breaks, the response has to happen before the next model training cycle. Define who owns data quality alerts that affect AI inputs, what the SLA is, and how it escalates. If that’s not documented before the alert fires, it’ll be negotiated under pressure after the fact.

Reconcile AI outputs against ground truth regularly.

Once a month at minimum, compare what your AI models are recommending against a verified external source: CRM data, finance records, e-commerce backend figures. This is how you catch model drift before it compounds into months of systematically wrong budget decisions.

Is Your Data Actually AI-Ready?

Before the next AI analytics investment gets signed off, it’s worth being honest about what your data quality AI analytics foundation actually looks like:

Two or more gaps here means your AI investment is building on a data quality AI analytics foundation that wasn’t designed to support it. The models might be excellent. The underlying problem is upstream.

The Takeaway

AI doesn’t make data quality less important. It makes it the thing everything else depends on.

Every capability in this Proactive Analytics series, detecting anomalies, validating data at the collection layer, monitoring attribution patterns, building alert playbooks, now has a second job. It’s not just protecting your reports. It’s protecting the integrity of every AI model that learns from your data.

The organizations that will get the most out of AI analytics over the next two years won’t necessarily have the most sophisticated models. They’ll have the most reliable data quality AI analytics foundation feeding them. That’s what separates AI that earns trust from AI that quietly misleads.

Proactive analytics isn’t just a measurement best practice anymore. In an AI-enabled business, strong data quality AI analytics is the foundation every intelligent decision runs on.

Investing in AI analytics and want to make sure your data is actually ready for it? Tatvic’s team can assess your current data quality setup across GA4, GTM, attribution, and monitoring layers and identify exactly where the gaps are. Schedule a call with Tatvic’s experts today.
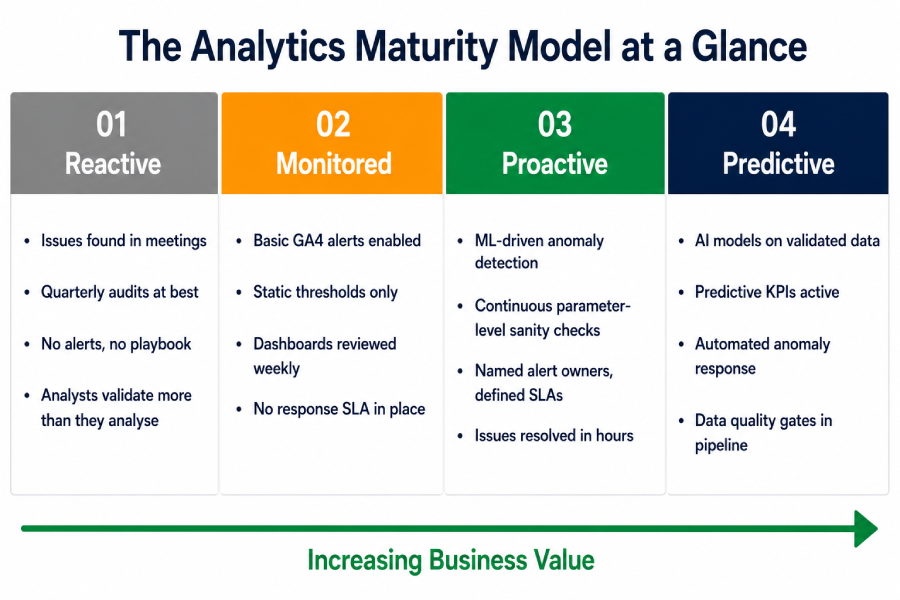
 

Analytics Alerting System: Why Alerts Fail and How to Fix It

An Alert Without a Playbook Is Just Noise: Building an Analytics Alerting System That Works

In this Proactive Analytics series, we have covered the foundation (Proactive Analytics), the detection layer (Anomaly Detection in GA4), and a high-stakes use case. All three end at the same place. Something is detected. An alert fires. And then what?

For most analytics teams, the honest answer is: not much. The alert lands in an inbox. Someone glances at it. It gets marked as read without action. Or it does not get read at all.

This is not a technology problem. It is a design problem. And it is the most common reason proactive analytics setups fail to deliver their full value.

The Alert Fatigue Problem Is Real, and It Is Not Limited to IT

Alert fatigue is widely documented across operations teams. Splunk’s State of Observability 2025 report, surveying 1,855 ITOps and engineering professionals, found that 73% of organizations experienced outages directly linked to ignored or suppressed alerts. The same research found that 59% say they have too many alerts, and 55% deal with too many false positives. The AI SOC Market Landscape 2025 report by SACR found that 40% of alerts are never investigated, and 61% of teams admitted to ignoring alerts that later proved critical.

These figures come from security and operations contexts. But the dynamic is identical in analytics:

  • A GA4 custom insight fires daily because the threshold is set too low
  • An anomaly alert triggers during a known promotional period because baselines have not been calibrated
  • A data quality alert lands in a shared inbox with no named owner and no expected action
  • A team that has been burned by false positives stops treating alerts as actionable signals

The result is an analytics alerting system that runs in the background, generates notifications, and influences nothing. The monitoring is in place. The detection is working. The value is lost at the last step.

Why Analytics Alerts Get Ignored

Understanding why alerts fail is the first step toward designing a system that works. The reasons are consistent across analytics teams:

No Context in the Alert Itself

An alert that says “sessions dropped by 23%” gives you a number. It does not tell you which pages, which segments, which device types, which time period, or what the likely cause is. Without context, the recipient cannot assess severity or take action without conducting their own investigation first. Most do not. They dismiss the alert and move on.

No Severity Tiering

When every alert looks the same, a revenue-impacting conversion failure competes for attention with a minor informational fluctuation. Teams learn quickly that most alerts are low severity. They apply that assumption to all of them. The critical ones get caught in the same net as the noise.

No Named Owner

An alert sent to a team, a shared inbox, or a distribution list has no clear owner. Everyone assumes someone else will handle it. This is not a behavioural failure; it is a structural one. Alerts without owners get resolved at the speed of the slowest person who reads them, which is usually never.

No Defined Response Expectation

Even when an alert reaches the right person, if there is no defined response protocol, the recipient has to decide in the moment what to do, when to do it, and who to involve. That decision overhead is often enough to push the response to “later,” which becomes never.

Static Thresholds Generating Predictable Noise

As covered in the Anomaly Detection in GA4 blog, static sensitivity settings produce alerts during expected peaks, known seasonal patterns, and normal day-of-week variation. When a team receives enough of these, they stop trusting the system. A well-calibrated analytics alerting system is the foundation of alert trust. Without trust, the system is decorative.

Already experiencing alert fatigue in your analytics setup? Tatvic’s team can help you audit your current alerts and identify what to keep, recalibrate, and remove. Get in touch.

What a Working Analytics Alerting System Actually Looks Like

An effective analytics alerting system is not defined by how many alerts it generates. It is defined by how many alerts drive action. The design principles that separate the two are straightforward.

Alerts Carry Context, Not Just Numbers

Every alert in a working analytics alerting system answers four questions immediately:

  • What changed: the specific metric, event, or parameter affected
  • By how much: the magnitude of the deviation and the expected range
  • Since when: the precise time the anomaly began
  • Which segment: the dimension combination where the deviation is isolated (browser, region, device, channel)

This context is what turns a notification into a brief. The recipient knows what they are looking at before they open the dashboard. Response time drops significantly when the investigation has already been done by the system.

Severity Is Tiered by Business Impact, Not Metric Size

A working analytics alerting system does not treat all anomalies equally. It routes alerts based on their proximity to revenue and decision-making:

  • A conversion tracking failure is a P1. It affects the accuracy of every marketing decision made from that point forward.
  • A parameter-level data quality issue is a P2. It affects reporting accuracy but not necessarily in real time.
  • An informational anomaly with no immediate business impact is a P3. It is worth knowing about, but it does not need to interrupt anyone’s day.

Tiering prevents the critical from being buried by the routine. It also gives recipients a rational basis for prioritisation rather than asking them to judge severity from a raw notification.

Every Alert Has a Named Owner and a Defined SLA

High-performing analytics alerting systems remove ambiguity before alerts even fire. Teams define ownership in advance, mapping every alert type to a named role or individual with a clear response time expectation.

  • P1 alerts: analytics lead responds within one hour, marketing director informed within two
  • P2 alerts: analytics team responds within 24 hours
  • P3 alerts: reviewed in the next weekly analytics meeting

This structure removes decision overhead from the recipient. They know what they are expected to do and by when.

How to Build an Analytics Alerting System That Drives Action

Building an analytics alerting system that works is a four-step process. Each step addresses one of the failure points described above.

Step 1: Audit your existing alerts and remove the noise.

Start by listing every alert currently active in your GA4 setup, your anomaly detection configuration, and any third-party monitoring you have in place. For each one, ask: has this alert driven a response in the last 60 days? If not, it is noise. Disable it or recalibrate it before adding anything new. A smaller set of high-trust alerts is more valuable than a comprehensive set of ignored ones.

Step 2: Build a tiered alert hierarchy.

Map your alerts to three priority levels based on business impact:

  • P1: Revenue impact, conversion tracking failure, data collection break
  • P2: Data quality issue affecting reporting accuracy, parameter-level anomaly, attribution signal change
  • P3: Informational anomaly, dimension-level shift, informational trend change

Assign each tier a response SLA and a named owner. The tier system only works if the definitions are agreed upon by the team before an alert fires, not negotiated in the moment.


Step 3: Add context to every alert.

Work with your anomaly detection and monitoring setup to ensure every alert includes: what changed, by how much, since when, and in which segment. This may require configuring alert templates in your monitoring solution or using Tatvic’s anomaly detection solution, which surfaces this context automatically. Without it, your alerts will generate activity but not resolution.

Step 4: Build and distribute a response playbook.

For each alert type, document:

  • The first action the owner is expected to take
  • The diagnostic questions to answer within the first 30 minutes
  • The escalation path if the issue cannot be resolved at the owner level
  • The communication template for notifying stakeholders when a P1 is active

This playbook does not need to be long. A single page per alert tier is sufficient. The system removes the decision overhead that pushes teams to deprioritize alerts. When the next step is obvious, the response happens. You can read more about how Tatvic’s anomaly detection solution surfaces contextual intelligence that feeds directly into this kind of response workflow.

The Alert Playbook in Practice: What Good Looks Like

Here is what a P1 response looks like in a team that has built this system:

6:45am: Anomaly detection flags a 67% drop in mobile purchase events, isolated to iOS users, beginning at 6:10am

Alert routes to analytics lead with context: affected segment, magnitude, start time, and a link to the relevant GA4 exploration

Analytics lead opens the alert, has enough context to begin investigation immediately

By 7:15am: GTM configuration issue identified on an iOS-specific tag after a previous night’s deployment

By 8:00am: Fix deployed, tracking restored, stakeholders notified via a pre-written P1 communication template

Total time from anomaly onset to resolution: under two hours

Without a working analytics alerting system, the same issue surfaces in a Monday morning meeting. The team spends the first hour of the week diagnosing a problem that started the previous Friday. Three days of corrupted mobile conversion data have already fed into weekend campaign optimisation.

The difference is not the detection. As covered across the previous blogs in this series, the detection capability is available. The difference is what happens the moment the alert fires.

The Takeaway: Detection Is Only Half the System

This series started with a simple observation: reactive analytics finds problems after they have already done their damage. The blogs that followed showed what proactive monitoring looks like across anomaly detection, attribution, and data collection.

But proactive analytics is only complete when the detection layer connects to an action layer. An analytics alerting system that detects everything and acts on nothing is a more sophisticated version of the same reactive problem.

The full picture looks like this:

  • Detect: Anomaly detection across metrics, parameters, dimensions, and attribution patterns
  • Validate: Data sanity checks that confirm the signal is real before the alert reaches a human
  • Alert: Contextual, tiered notifications routed to named owners with defined response expectations
  • Act: A playbook that tells the recipient exactly what to do and by when

When teams connect all four layers: Detect, Validate, Alert, and Act - proactive analytics begins to deliver its full value: faster problem resolution, decisions backed by trusted data, and teams that act on alerts because the system has earned their confidence.

That is what a complete analytics alerting system looks like. And that is the standard worth building toward.

Ready to turn your analytics monitoring into a system that actually drives action? Tatvic’s team can audit your current alerting setup, identify the noise, and help you build a response playbook tailored to your business. Schedule a call with Tatvic’s experts today.
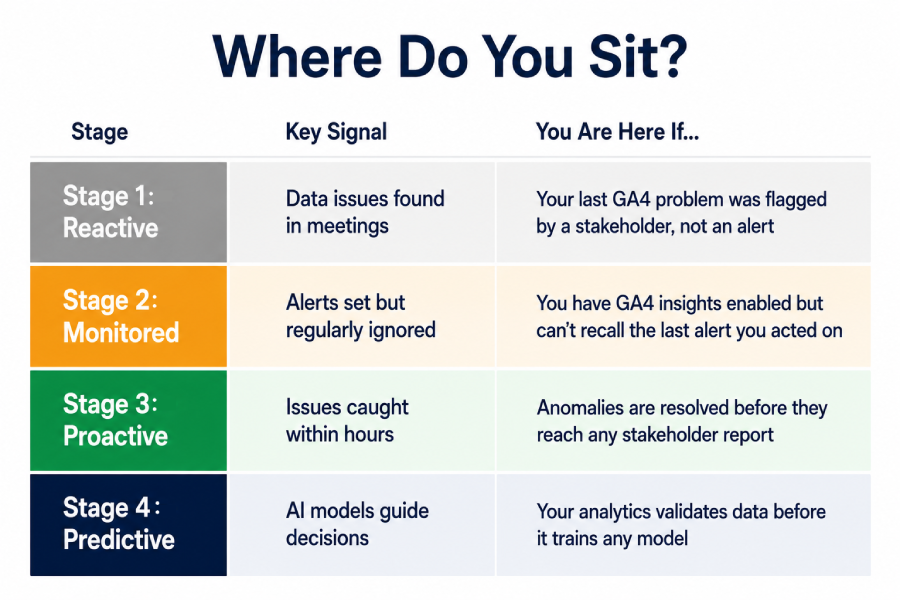
Anomaly Detection in GA4: How to Get More Out of It

This is the third blog in Tatvic’s Proactive Analytics series. In the first blog , we established why reactive analytics is costing businesses more than they realise. In second blog, we applied that thinking to marketing attribution. This blog focuses on the capability that sits at the heart of proactive analytics: anomaly detection in GA4.

We have written about anomaly detection before from a technical standpoint. This blog takes a different angle: what GA4’s built-in anomaly detection already does well, and how extending it across additional monitoring layers makes your entire analytics setup significantly more powerful.

GA4’s anomaly detection is a strong starting point. The question worth asking is: how much further can you take it?

What GA4 Built-in Anomaly Detection Already Does Well

GA4’s approach to anomaly detection in GA4 is genuinely sophisticated. It uses a Bayesian statistical model that learns from your historical data to establish expected ranges for your metrics:

  • Hourly anomalies: Based on 2 weeks of historical data
  • Daily anomalies: Based on 90 days of historical data
  • Weekly anomalies: Based on 32 weeks of historical data

The September 2024 GA4 update added anomaly detection directly into detail reports, surfacing unexpected spikes or dips as visual indicators on your charts without any manual setup. Custom insights extend this further, allowing you to define specific conditions that trigger alerts for the metrics that matter most to your business.

This is a meaningful capability. It surfaces significant metric-level shifts automatically, reduces the manual monitoring burden, and gives analysts a starting point for investigation when something in your data changes. For teams that have not yet enabled GA4’s built-in anomaly detection, doing so is the right first step.

The opportunity is in what comes next.

Taking Anomaly Detection in GA4 Further

GA4’s built-in monitoring operates at the metric level: sessions, users, conversions, revenue. This is the right layer to start with. But business anomalies rarely live only at the metric level.

They live in the data underneath the metrics:

  • A conversion event firing correctly but passing the wrong parameter value
  • A revenue drop isolated to one browser version while all others remain stable
  • A checkout parameter schema mismatch introduced by a developer change that does not affect the headline conversion count

At the metric level, these look normal. At the parameter, dimension, and data collection layer, they are anomalies with real business consequences.

Extending anomaly detection in GA4 across these deeper layers is what separates a monitoring setup that catches the obvious from one that catches the costly.

Three Layers That Make GA4 Anomaly Detection More Powerful

Layer 1: Parameter-Level Monitoring

GA4’s built-in anomaly detection watches whether a metric has moved. Parameter-level monitoring watches whether the data feeding that metric is accurate.

In practice, this means:

  • Validating event parameters against expected schemas on a continuous basis
  • Flagging null values, type mismatches, or unexpected value ranges at the point of collection
  • Detecting when an event fires more or fewer times than expected within a session
  • Catching currency code mismatches, null transaction IDs, or malformed product arrays before they populate your reports

This is where Tatvic’s GTM health monitoring operates: at the collection layer, validating data before it reaches the metric level where GA4’s anomaly detection watches. Together, they create a complete monitoring chain from data entry to report.

Layer 2: Dimension-Level Anomaly Detection

Business anomalies are rarely uniform. A revenue drop might be specific to:

  • Users on a particular browser version after a site deployment
  • Users in a specific geographic region after a payment provider outage
  • Users on a particular device type after a mobile UX change

When this happens, the aggregate revenue metric may remain within its expected range while the dimension-level collapse goes undetected. Dimension-level anomaly detection monitors specific combinations of metrics and dimensions simultaneously, surfacing the signal that the aggregate hides.

Tatvic’s in-house anomaly detection solution allows monitoring across dimension combinations such as revenue by browser and region simultaneously, flagging the isolated drop before it is absorbed by a healthy aggregate. You can see how this works across real client scenarios in the anomaly detection safeguards business performance blog.

Layer 3: Intraday Monitoring on High-Value Events

GA4’s daily anomaly model is well-suited to identifying overnight or multi-day shifts in your data. For time-sensitive business events, intraday monitoring adds an additional layer of speed.

Consider the scenarios where timing matters most:

  • A new campaign launches with a tracking misconfiguration at 9 am. Intraday monitoring catches it within hours.
  • A payment flow breaks during peak trading. Conversion data drops. An intraday alert fires the same morning.
  • A flash sale drives traffic that exceeds infrastructure capacity. Bounce rates spike sharply. The alert arrives before the sale ends, not after.

Tatvic’s anomaly detection runs checks multiple times per day, giving teams hours rather than a full day to respond to time-sensitive issues. The faster the detection, the smaller the window during which bad data influences decisions.

Adaptive Baselines: Making GA4 Anomaly Detection Smarter Over Time

GA4’s custom insights include a sensitivity slider that lets you calibrate how easily anomalies are flagged. This gives you control, and it also creates an ongoing calibration responsibility:

  • Promotional periods that double your typical traffic can trigger alerts for spikes that are entirely expected
  • Seasonal patterns require manual threshold adjustment before each peak period
  • Day-of-week variation can produce false alerts on naturally slower traffic days

ML-driven adaptive baselines solve this automatically. Rather than a fixed sensitivity setting, adaptive models continuously learn your business patterns, including seasonality, campaign cycles, and day-of-week variation, and adjust expected ranges accordingly.

The result: anomaly detection in GA4 that produces actionable alerts during campaigns, not noise. Expected peaks are recognised as expected. Genuine deviations stand out clearly because the baseline already accounts for normal variability.

Extending Anomaly Detection to Attribution Patterns

One of the most valuable extensions of anomaly detection in GA4 is applying it to attribution data rather than just traffic and conversion volume.

When paid social’s share of conversion credit drops by 30% over 48 hours without a corresponding change in spend, that is an anomaly in your attribution chain, not your traffic volume. GA4’s built-in monitoring watches metric totals. Attribution pattern monitoring watches how credit is distributed across channels over time.

As explored in the proactive attribution blog, this layer of anomaly detection catches UTM failures, cross-domain tracking breaks, and channel misattribution while there is still time to act, before budget decisions are made on a distorted performance picture.

The Market Signal: Why Businesses Are Extending Beyond Built-in Tools

The investment trend in anomaly detection reflects how seriously businesses are treating this. The global data anomaly detection market is expected to reach $33.32 billion by 2035, growing from $5.61 billion in 2025 at a CAGR of 19.5%, according to Market.us research. The ML and AI segment is growing fastest, at 18.7% CAGR.

This growth is driven by one consistent business insight: native platform monitoring, while valuable, is the starting layer. The organisations investing in extended anomaly detection are the ones treating data reliability as a business priority, not just an analytics function.

How to Extend Your GA4 Anomaly Detection Setup

Building on GA4’s strong foundation is a layered process. Start with what is already available and add depth systematically.

Step 1: Enable and configure GA4’s built-in anomaly detection fully.

  • Activate custom insights for your highest-value metrics: revenue, purchase events, lead form completions
  • Set evaluation frequency to daily for core KPIs
  • Review and act on automated insights weekly as a starting discipline

Step 2: Add intraday monitoring on your most time-sensitive events.

  • Identify the three to five events where a same-day detection matters most
  • Configure intraday anomaly checks on purchase events, payment initiations, and primary conversion actions
  • Set contextual alerts that include what changed, by how much, and which segments are affected

Step 3: Layer in dimension-level monitoring on your top segments.

  • Map your three to four highest-value dimension combinations: top browsers, key markets, primary device types
  • Set anomaly detection specifically on these combinations
  • Use these alerts as the early warning system for localised failures that aggregate metrics conceal

Step 4: Validate your data collection layer continuously.

  • Anomaly detection in GA4 at the report level depends on accurate data collection
  • Pair your monitoring setup with continuous GTM health checks and parameter-level validation
  • This ensures the data GA4 watches is reliable before anomaly detection begins

Step 5: Extend anomaly detection to your attribution patterns.

  • Monitor direct traffic share and channel attribution distribution alongside volume metrics
  • Set alerts for shifts in attribution credit that do not correspond to spend changes
  • This closes the loop between proactive analytics and proactive attribution monitoring

The Takeaway

GA4’s built-in anomaly detection is a genuine asset. It gives analytics teams automated, ML-powered monitoring without additional tooling, and it has improved significantly with each GA4 update.

Extending it adds three meaningful capabilities:

  • Parameter and data layer monitoring that validates what GA4 watches before it is watched
  • Dimension-level detection that surfaces localised anomalies that aggregate conceal
  • Intraday intelligence that reduces detection time from days to hours on your most critical events

The goal is not to replace what GA4 provides. It is to build a monitoring setup that is as complete as the business decisions that depend on it.

Every analytics setup benefits from anomaly detection. The deeper the monitoring goes, the more reliable the data it protects.

Want to understand how your current GA4 anomaly detection setup can be extended? Tatvic’s team can map your monitoring coverage across metric, parameter, dimension, and collection layers in a structured review. Schedule a call with Tatvic’s experts today.
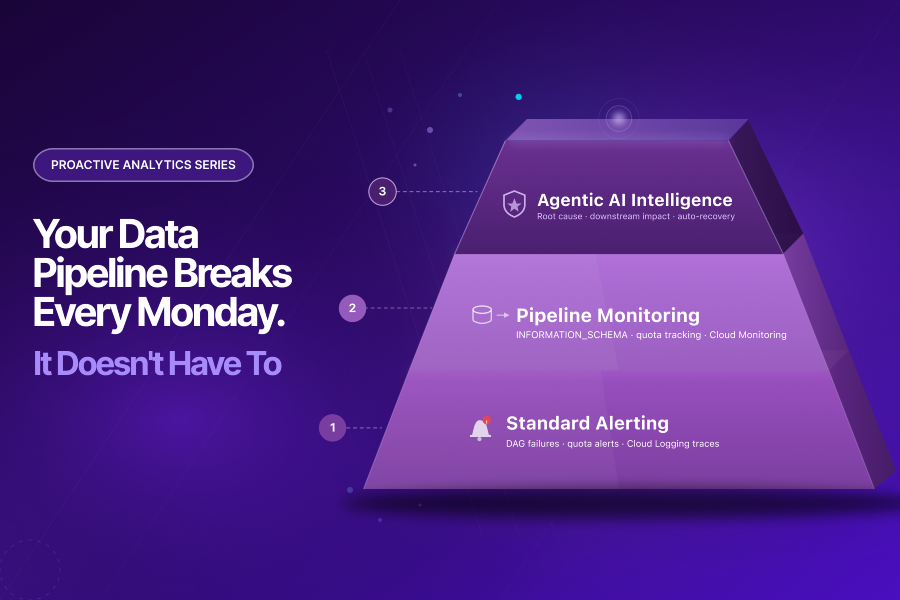
Bot Icon
Bot Icon

Tatvic Bot

Explore About Tatvic and Services