Integrating Firebase with BigQuery provides you the ability to perform deeper insights into your data by writing SQL queries. It can help you answer many questions about how your apps are performing and being used.
Also Read: Getting Started with Firebase Analytics
Linking your Firebase project to BigQuery lets you access raw, unsampled event data of your Firebase project along with all of your parameters and user properties.
Note that you need to have a Firebase Blaze plan in order to link it with BigQuery. With free tier, i.e Firebase Spark Plan the export of data is not possible.
There are two prerequisites for enabling export. First, within Firebase your account needs to be an Owner of the project that you want to link, and second, on Google Cloud Platform project, that same Google account needs Project Owner access.
You can configure Firebase to export data to BigQuery from the following Firebase products:
We will be considering Analytics data for our example. Once the export is successful, under the BigQuery console we will have a dataset named analytics_xxx where xxx is the property for your Firebase. Under this analytics_xxx dataset a table is imported for each day of export. These tables have the format “events_YYYYMMDD” and are sharded tables. Additionally, a table is imported for app events received throughout the current day. This table is named “events_intraday_YYYYMMDD” and it is populated in real-time as app events are collected.
If we want to Analyze Firebase Analytics data in-depth to find meaningful insights & patterns Firebase and BigQuery integration is required. This opens doors to advanced analysis such as Closed Funnel, Revenue/Monetization, Ad Performance, In-App Purchases, Top Performing Features, User Lifetime Value, user churn pattern, etc. since raw level data is collected in BigQuery.
Sample dashboards (DataStudio)
We will create two dashboards:
- Churn Users
- Users Funnel Drop off
Here is the query for churn users:
with level_sucessful as
(
select * from (
select event_date,user_pseudo_id, event_timestamp, country,
CAST(level as INT64) level, CAST(Cash_Money as INT64) Cash_Money , CAST(Bonus_Money as INT64) Bonus_Money
,row_number() over(partition by user_pseudo_id order by event_timestamp desc) as row_number
from(
SELECT event_date, event_timestamp , user_pseudo_id , app_info.version , geo.country , event_name,
IF(ep.key=’Level’, ep.value.string_value, null) AS level ,
IF(ep.key=’Cash_Money’, ep.value.string_value, null) AS Cash_Money ,
IF(ep.key=’Bonus_Money’, ep.value.string_value, null) AS Bonus_Money
FROM `Project-ID.analytics_xxx.events_*` ,unnest(event_params) ep
WHERE event_name = “Level_Completed”
)
) where row_number=1
),
user_app_remove as (
SELECT event_date, user_pseudo_id
FROM `Project-ID.analytics_xxx.events_*`
WHERE event_name = “app_remove”
)
SELECT ar.event_date,ar.user_pseudo_id,ls.country,ls.level Level,ls.Cash_Money, ls.Bonus_Money
FROM user_app_remove as ar JOIN level_sucessful as ls
ON ar.user_pseudo_id = ls.user_pseudo_id
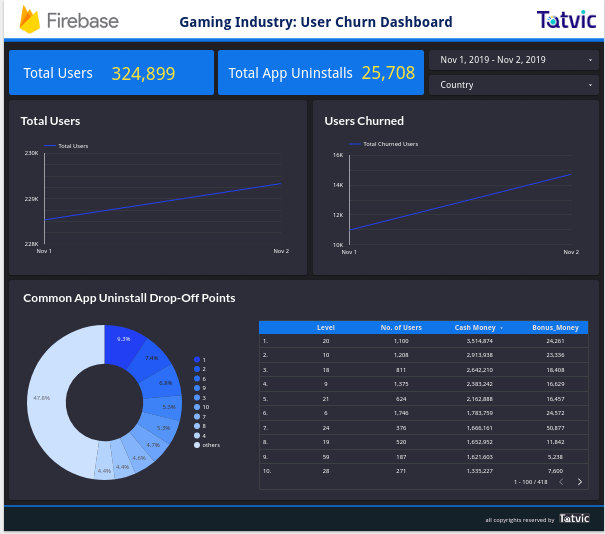
Now, for churn users dashboard we want the level at which users uninstall the app and the amount of cash money and bonus money they have. So that we can identify the level that can be improved and identify the common drop off points.
The event app_remove is a default event of Firebase and users level, cash money and bonus money are being passed with Level_completed. Hence, we will join the latest level completed by the users just before removing the app.
We save results from the query into a table named churn_users and then connect it to DataStudio for generating wonderful insights.
Dashboard:
Query for funnel:
with funnel_data as
(
SELECT event_date,event_timestamp,user_pseudo_id,geo.country,event_name
FROM `Project-ID.analytics_xxx.events_*`
WHERE
event_name IN (“Payment_details_entered”,”Add_to_Cart”,”Order_Confirmation”)
UNION ALL
FROM `Project-ID.analytics_xxx.events_*` , UNNEST(event_params) event_params
WHERE
event_name = “Shipping_Details” AND event_params.key = “From” AND event_params.value.string_value = “In Game”
),
Add_to_Cart as
( SELECT event_date,country ,user_pseudo_id FROM funnel_data
where event_name = “Add_to_Cart” AND country != “”
)
,Shipping_Details as
(
SELECT event_date, country,user_pseudo_id FROM funnel_data
where user_pseudo_id in (select distinct Add_to_Cart.user_pseudo_id from Add_to_Cart )
AND event_name = “Shipping_Details”
),
Payment_details_entered as
(
SELECT event_date,country,user_pseudo_id FROM funnel_data
where user_pseudo_id in (select distinct Shipping_Details.user_pseudo_id from Shipping_Details) AND event_name = “Payment_details_entered”
),
Order_Confirmation as
(
SELECT event_date, country ,user_pseudo_id FROM funnel_data
where user_pseudo_id in (select distinct Payment_details_entered.user_pseudo_id from Payment_details_entered) and event_name = “Order_Confirmation”
),
Add_to_Cart_with_cnt as
(select event_date,country,count(user_pseudo_id) Add_to_Cart_cnt from Add_to_Cart
group by 1,2) ,
Shipping_Details_with_cnt as
(select event_date,country,count(user_pseudo_id) Shipping_Details_cnt from Shipping_Details
group by 1,2),
Payment_details_entered_with_cnt as
(select event_date,country,count(user_pseudo_id) Payment_details_entered_cnt from Payment_details_entered
group by 1,2),
Order_Confirmation_with_cnt as
(select event_date,country,count(user_pseudo_id) Order_Confirmation_cnt from Order_Confirmation
group by 1,2),
Add_to_Cart_and_Shipping_Details as
(select s.event_date ,s.country ,Add_to_Cart_cnt,if(Shipping_Details_cnt is null,0,Shipping_Details_cnt) Shipping_Details_cnt from Add_to_Cart_with_cnt as s
left join Shipping_Details_with_cnt as i
on s.event_date = i.event_date AND s.country =i.country ),
Add_to_Cart_and_Shipping_Details_and_Payment_details_entered as
(
select s.*,if(Payment_details_entered_cnt is null,0,Payment_details_entered_cnt) Payment_details_entered_cnt from Add_to_Cart_and_Shipping_Details as s
left join Payment_details_entered_with_cnt i
on s.event_date = i.event_date AND s.country =i.country
),
Add_to_Cart_and_Shipping_Details_and_Payment_details_entered_and_inAppPurchase as
(
select s.* ,if(Order_Confirmation_cnt is null,0,Order_Confirmation_cnt) Order_Confirmation_cnt from Add_to_Cart_and_Shipping_Details_and_Payment_details_entered as s
left join Order_Confirmation_with_cnt i
on s.event_date = i.event_date AND s.country =i.country
)
select * from Add_to_Cart_and_Shipping_Details_and_Payment_details_entered_and_inAppPurchase
For the user funnel dashboard, we want a closed funnel for purchase which goes like this Add to Cart > Shipping Details > Payment Details > Order Confirmation. Thus, it will help us identify where our users are being dropped while performing the confirmation.
Now, the query for the closed funnel is quite tricky. The logic goes like this: what is the number of users that performed add to cart event out of this how many performed the shipping details activity again out the shipping details how many users get into the payment details process and finally to order confirmation.
Hence, for the query logic, we use “WITH AS” and first create a master table named funnel data with the respected events after which we list out the number of users for the Add to Cart event. While creating the Shipping Details we apply the filter for users from the add to cart and for Payment details entered we apply the filter for users from the shipping details temporary table and so on. Finally, we count the users for respected events in each temporary table thereby joining them.
Dashboard:
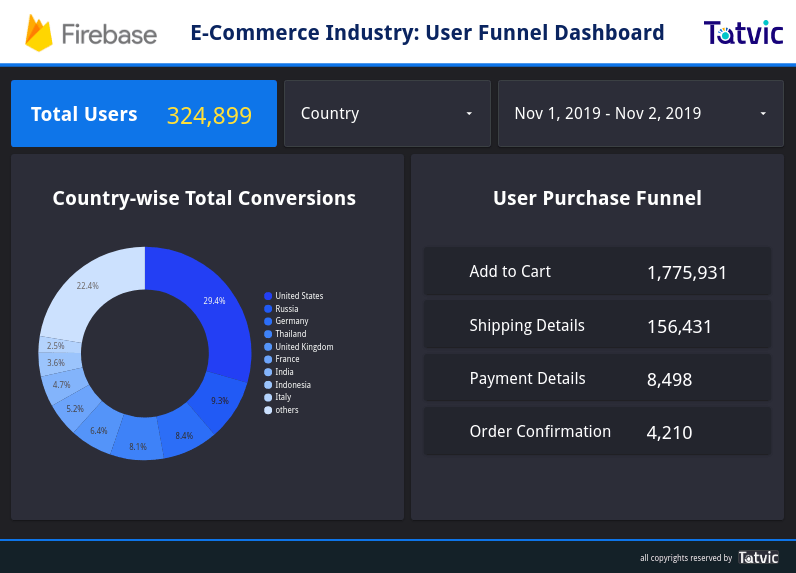
Now using this table, we have created a sample dashboard to understand the user drop off from the add to cart and we can see a high drop off rate at all the steps
Possible reasons for this could be that page load issues, payment issues, shipping details form load issues, lengthy form to complete the checkout, payment gateway issues, fewer options for payment, etc. We can also map specific user behavior against this funnel
Depending on your business KPI, custom events and parameters can be created and then queried in BigQuery to fetch raw-level data to in turn visualized in Data Studio.
Great so now that we have all the rich information and insights in front of us the obvious question is “So what? What can I do with all the data that I have?” One of the main closing points here would be the activations that be done using Firebase because insights without any action is an investment with zero ROI.