This extensive guide aims to explore Looker BI in-depth, covering key features, integrations, use cases, pricing, and more.
Is Looker BI a Tool?
Google’s Looker is a cloud-based Business Intelligence tool that helps you explore, share, and visualize data that drive better business decisions. Looker is a platform that allows you to create and share reports quickly and smartly. It allows anyone in your business to analyze and find insights into your datasets quickly.
With the Looker platform, you can get more than just a Business Intelligence(BI) tool. You can gain Looker analytics, a modern data stack, integrations, features for app development, comprehensive professional services, and world-class support.
Deep dive into the Core Values of Looker as a Modern BI tool:
Before diving into the intricacies of Looker BI, it’s essential to understand the core values that define its approach to business intelligence (BI):
1. API-first & Cloud Native Integration:
Looker is designed to seamlessly integrate into existing workflows, emphasizing an API-first and cloud-native approach.
2. Semantic Modelling & Governance:
With a semantic modelling layer, Looker ensures enterprise-wide governance of data, promoting consistency and accuracy.
3. In-Database Architecture:
Access to real-time data is a cornerstone of Looker’s architecture, enabling users to make decisions based on the latest information.
-
Single Dashboard, Multiple Experiences:
Looker consolidates diverse experiences into a single dashboard, simplifying the user interface and fostering collaboration.
-
Rich, Governed Data Sets:
Users can leverage rich and governed data sets without the need to learn new tools, ensuring a seamless transition to Looker BI.
-
Standardized Common Metrics:
Looker promotes the use of standardized common metrics and definitions, facilitating consistency across the organization.
-
Integrated Insights:
Looker allows integration with third-party APIs, enabling the combination of APIs and the addition of AI/ML capabilities to applications.
-
Customization and Personalization:
Users can customize and personalize their Looker experience, tailoring it to meet their specific needs.
Embedded BI:
Looker facilitates the integration of insights through embedded bi analytics into existing applications, enhancing the user experience.
Looker Used Cases:
Looker BI has demonstrated its transformative impact in various industries, with tangible outcomes:
-
Channel Performance with Looker:
Looker BI consolidates all your marketing performance data, including ad impressions, website traffic, and customer data, into one central console for your marketing team. You can integrate Google Analytics 360 (GA360) or Google Analytics 4 (GA4) data, along with Google Marketing Platform (GMP) data, into BigQuery alongside your first-party datasets. This enables Looker to provide real-time insights into your channel performance and user engagement.
-
Customer Lifetime Value (CLV):
Looker BI can help establish customer lifetime value models to enhance personalized customer experiences and enhance ROI. Employ BigQuery ML or AutoML to generate a list of profitable customers based on predicted customer lifetime value, which can be seamlessly integrated into marketing platforms for targeted strategies.
-
Propensity Modeling:
Create audience segments that are inclined to perform specific actions like making a purchase, signing up, or churning, and tailor your advertising strategies to effectively reach them. Leverage Google Cloud Platform’s Vertex AI Pipelines, BigQuery Machine Learning (BQML), and XGBoost to build, and deploy predictive models for this purpose.
-
Revenue Contribution Analysis:
Revenue Contribution Analysis is a powerful technique that enables you to analyze and understand the various factors that influence your total revenue. This analysis can help you analyze revenue drivers like sales channels, products, devices, and regions to optimize profitability strategies.
Looker integrates data, facilitating a thorough analysis of user behaviour, conversion rates, cart size, average prices, and their impact on revenue. To gain a deeper understanding of this relationship and make data-driven decisions, we have developed a Looker Block, which empowers us to derive insights from the data.
Pain Points Addressed by Looker BI:
Looker BI addresses common pain points:
1. Data Silos:
Looker resolves the challenge of data stored in cubes or silos that lack trust across the organization.
For instance, A multinational corporation with operations spanning multiple regions faced challenges in consolidating data from different regional offices. Looker’s semantic modelling layer provided a unified view of the data, breaking down silos and ensuring consistent metrics across the organization.
2. Dashboard Overhead:
It eliminates the need for multiple dashboards for different use cases, reducing overhead and streamlining data access.
For instance, In the healthcare sector, a major hospital network faced the issue of disparate dashboards for patient records, financial metrics, and operational data. Looker BI’s single-dashboard approach allowed the hospital to integrate these disparate sources, providing a comprehensive view for decision-makers. This not only reduced dashboard overhead but also improved decision-making efficiency.
3. Learning Curve:
Looker tackles the issue of expensive self-service tools with a significant learning curve, ensuring a user-friendly experience.
For instance, an educational institution seeking to enhance its data analytics capabilities faced resistance due to the steep learning curve of existing BI tools. Looker BI’s user-friendly interface and extensive training support allowed the institution to empower its staff with data insights without the need for extensive training. This resulted in faster adoption and improved decision-making across departments.
4. Looker Integrations:
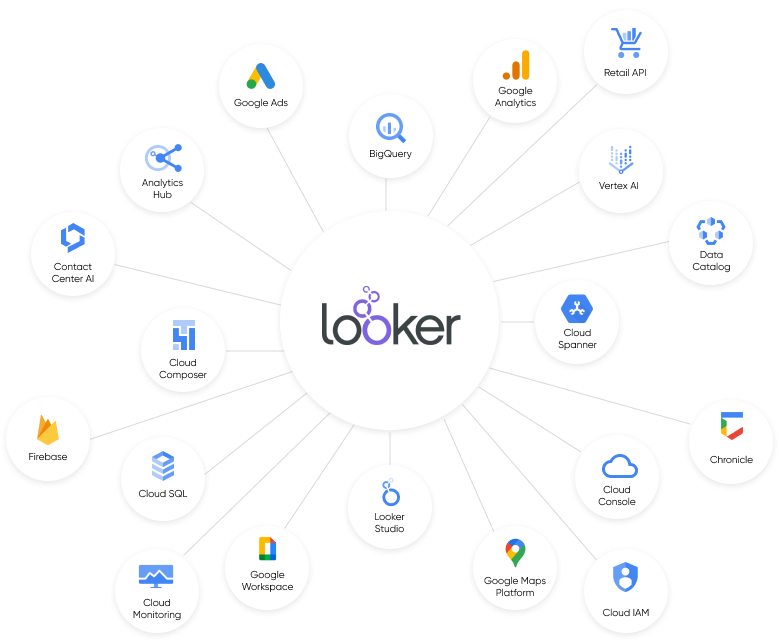
Looker’s versatility is further amplified through its integrations with various platforms. Whether it’s Google Cloud, Azure, AWS, or other prominent cloud services, Looker BI ensures a reliable and trusted experience. Additionally, native integrations with Google Ads and Facebook Ads empower organizations to streamline remarketing processes and make data-driven decisions.
Consider an e-commerce company leveraging Looker’s native integrations with Google Ads and Facebook Ads. By seamlessly connecting marketing performance data with Looker’s analytics, the company gained real-time insights into ad impressions, click-through rates, and conversion metrics. This integration not only optimized marketing strategies but also enhanced the overall customer experience.
Target Personas for Looker BI
Identifying the right audience for Looker BI is crucial for its effective implementation. The tool caters to:
Data Analysts:
Looker provides data analysts with a powerful platform for exploration, analysis, and visualization.
Consider a data analyst in a retail organization tasked with identifying sales trends and optimizing inventory. Looker’s intuitive interface and advanced analytics capabilities empowered the analyst to create dynamic dashboards, allowing for real-time monitoring of sales performance, inventory turnover, and customer preferences.
Business Intelligence Professionals:
BI professionals can leverage Looker’s features for seamless integration and advanced analytics.
In the financial sector, business intelligence professionals grapple with the challenge of aggregating data from diverse sources for regulatory reporting. Looker’s API-first approach allowed these professionals to integrate Looker seamlessly with existing data sources, reducing reporting errors and ensuring compliance.
Decision Makers:
Executives and decision-makers benefit from Looker’s user-friendly dashboards and real-time insights.
Consider a CEO leading a multinational conglomerate seeking to optimize operational efficiency across diverse business units. Looker’s consolidated dashboard provided the CEO with a comprehensive view of key performance indicators, enabling informed decision-making.
Looker Features that Redefine Business Intelligence with Looker BI:
1. Browser-Based Access
Looker BI stands out as a browser-based tool, eliminating the need for local software installations. This not only simplifies the user experience but also enhances collaboration, ensuring a seamless workflow.
Consider a global workforce spread across different geographical locations. Looker’s browser-based access allowed employees to access critical business insights from any device, fostering collaboration and facilitating data-driven decision-making.
2. Embedded Analytics:
Looker BI facilitates seamless integration by allowing the embedding of dashboards into existing applications or workflows. This enhances productivity by eliminating the need to switch between platforms.
In the manufacturing sector, a production planning team integrated Looker BI into their ERP system. This allowed planners to access real-time production data directly within the ERP interface, streamlining decision-making and reducing the time spent toggling between applications.
3. Augmented Analytics:
Harnessing the power of machine learning and artificial intelligence, Looker BI enables the automatic discovery of insights, anomalies, and trends. Its AI and ML functionalities extend to predictive analytics and forecasting, providing a forward-looking perspective.=
Consider a financial institution utilizing Looker BI for risk management. Looker’s augmented analytics capabilities identified emerging trends in market data, allowing risk analysts to proactively adjust investment portfolios.
4. Multi-Platform Data Integration:
Looker BI’s versatility is evident in its ability to connect, explore, and present data across various platforms. Whether it’s Google Cloud, Azure, AWS, or other cloud services, Looker BI ensures a reliable and trusted experience.
In a multinational conglomerate with diverse data sources, Looker BI seamlessly integrated data from on-premises databases, cloud services, and third-party applications. This unified data view enabled the organization to uncover hidden insights, resulting in an improvement in decision-making accuracy and an increase in overall operational efficiency.
5. Activations and Remarketing:
Looker BI goes beyond conventional analytics by offering native integrations with Google Ads and Facebook Ads. This streamlines the remarketing process, enabling users to analyze data and create models seamlessly within the Looker interface.
Consider an e-commerce company leveraging Looker BI’s activations and remarketing capabilities. By integrating Looker with Google Ads and Facebook Ads, the marketing team gained real-time insights into customer behaviour and preferences. This data-driven approach led to a 20% improvement in click-through rates and a 15% increase in conversion rates.
6. Looker ML Modeling
An innovative addition to Looker BI is Looker ML, a modelling language designed to simplify and standardize data modelling. This promotes collaboration among teams, ensures robust data governance, and facilitates efficient data analysis.
In a data-intensive research institution, Looker BI’s LookML modelling proved invaluable for standardizing research data. Researchers could define data structures and metrics using LookML, ensuring consistency and accuracy in their analyses.
Integration of Looker BI in your existing Data Analytics:
Integrating Looker into your data strategy involves careful planning and implementation to ensure that your organization can effectively leverage the platform for data analytics and decision-making. Here are the steps to integrate Looker into your data strategy:
Assessment of Needs and Objectives:
Start by defining your organization’s data analytics goals and objectives. Determine what specific business challenges you intend to address with Looker. This step can also include determining the insights that you are looking to gain through the looker.
Data Source Identification:
Looker facilitates integration with several data sources. Identify and leverage the data sources that you currently use and want to integrate with Looker. This may include databases, cloud services, data warehouses, and third-party applications.
Data Preparation and Cleaning:
Ensure that your data is clean, consistent, and structured for analysis. Data quality is critical for accurate insights.
Choose Looker Deployment Option:
Decide whether you want to use Looker as a cloud-based solution or deploy it on your own infrastructure (on-premises or in a private cloud). This decision may depend on your organization’s preferences and data security considerations.
LookML Modeling:
Create LookML models that define how your data is structured, the relationships between data sets, and the metrics you want to track. LookML is Looker’s modeling language.
This is where Looker holds greater value. If we see Google Looker Vs. Power BI, while both are powerful BI tools, they differ in their approach and integration capabilities. Looker excels in its seamless integration with Google Cloud services and its unique modeling language, LookML, while Power BI is renowned for its deep integration with Microsoft’s ecosystem and advanced data visualization features
Build Dashboards and Reports:
Use Looker’s user-friendly interface to create customized dashboards and reports that meet your business needs. If you or your organization is going to utilize the dashboards and visualizations in an existing workflow of yours, embed the dashboard straight into your existing workflow.
Data Access and Security:
Looker can help you set up role-based access controls and security measures to ensure that users can only access the data they are authorized to see. This is critical for data governance.
Conclusion:
Integrating Looker BI into your data strategy is an ongoing process that requires continuous improvement and adaptation to changing business requirements. As mentioned in this article, looker offers a versatile set of tools and features that can be applied to various use cases within your organization.
Whether it’s understanding channel performance, analyzing customer lifetime value, or performing revenue contribution analysis to increase profitability, looker can help you make the most of its capabilities and derive data-backed decision-making. By following the steps above to integrate Looker into your data strategy and leveraging Looker’s diverse use cases, you can ensure your organization always remains adaptable and responsive to the ever-evolving needs of data-backed decision-making.


