
If you’re a publishing firm or an OTT platform and work with data, you exactly know the work that goes into presenting the right metrics in a clear and concise way. You love data, but you don’t love the cluttered worksheets. While your Google Analytics default dashboards are informative, they aren’t visually appealing.
Reports can get even more complicated when you’re in the process of combining data from different sources in a single view. Want to analyse the Google Ads and Facebook advertising campaigns side by side? Want to track content-wise performance? A spreadsheet won’t cut it.
The teams at Tatvic & Google Marketing Platform know how much work this can turn out to be. Our Data Studio experts at Tatvic put their heads together for this blog & have explained this awesome data visualization tool can help OTT Platforms and Publishers such as yourself answer their core business questions.
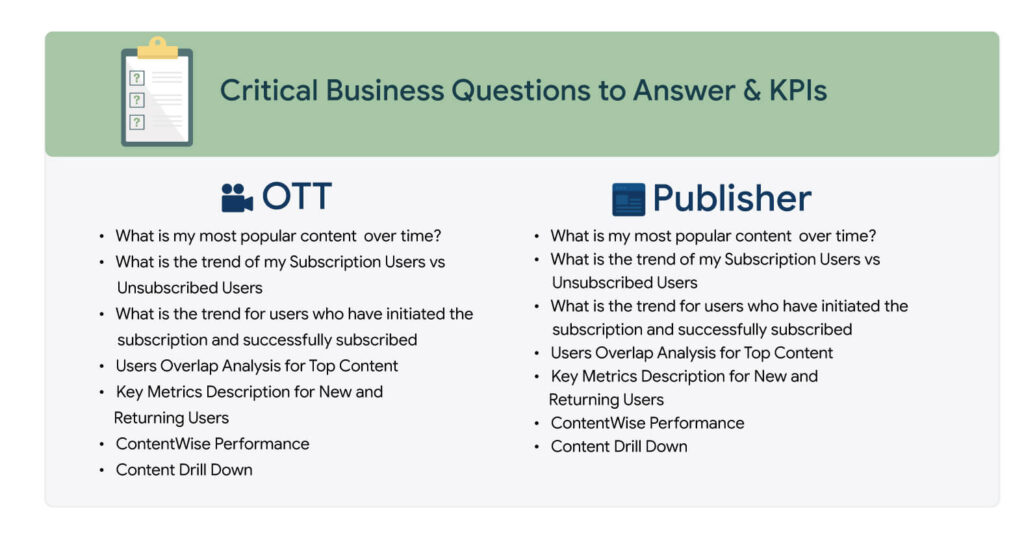
But are these enough to conclude business decisions?
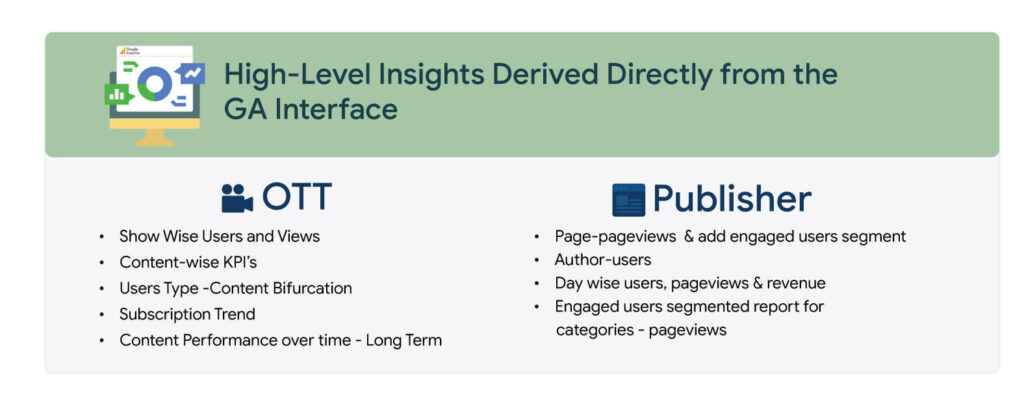
Every decision-maker needs more granular analysis in order to make more effective decisions for the business. In the business of OTT/Publisher, there are many important factors like content consumption, spend to acquire a user & revenue generated from the user, user engagement, etc. And google analytics reports are not directly helpful for analyzing these factors effectively.
Let’s compare the Google Analytics reports & Data Studio visualizations to understand how Data Studio helps you in your analysis. These examples are segmented in the sections just like google analytics reporting. Each example consists of the use cases for both OTT & publishers.
- Audience
- Acquisition
- Behavior
- Conversions
Audience
OTT
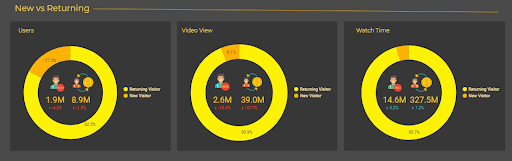
Key Metrics Description for New and Returning Users KPI performance through Custom Report
When you use the same data points in Data Studio Dashboard with Custom Visualization, you have a clear comparison of all your KPI’s for the same dimensions and a clear picture of the data at a look.
Publisher
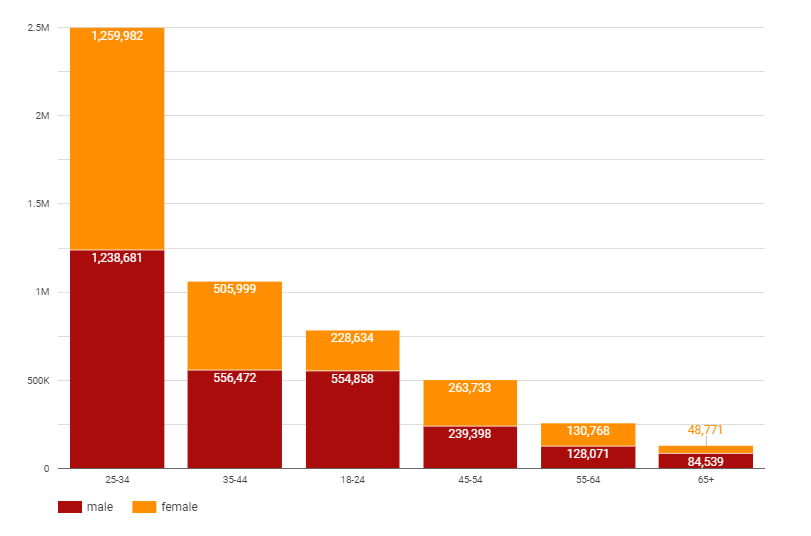
Custom report with age and gender along with page views gives result something like this:
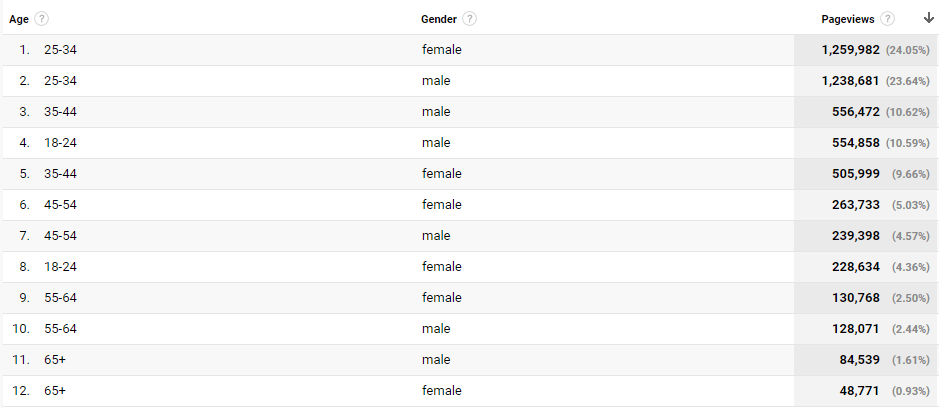
When you use the same data to visualize in the Data Studio, It will provide you the bifurcation which is clearly understandable and visually appealing. % share also can be taken instead of data labels for this visualization.
Acquisition
OTT
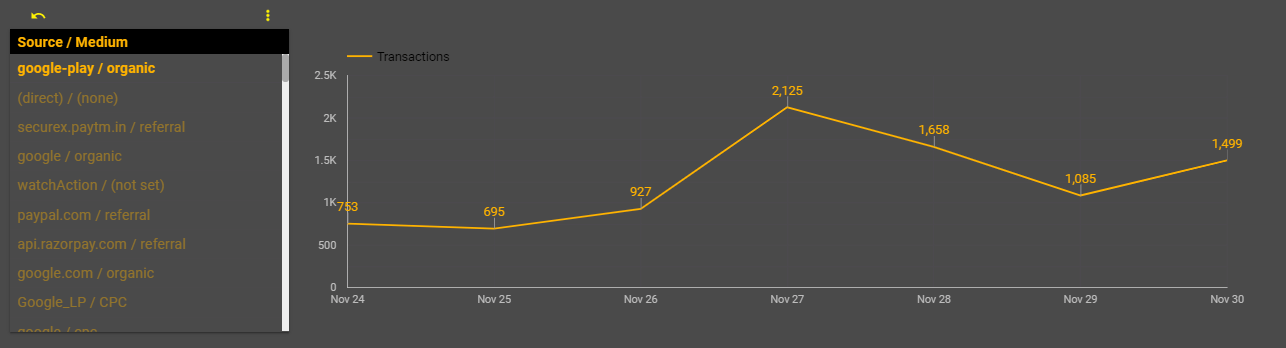
Subscription Trend based on source/medium
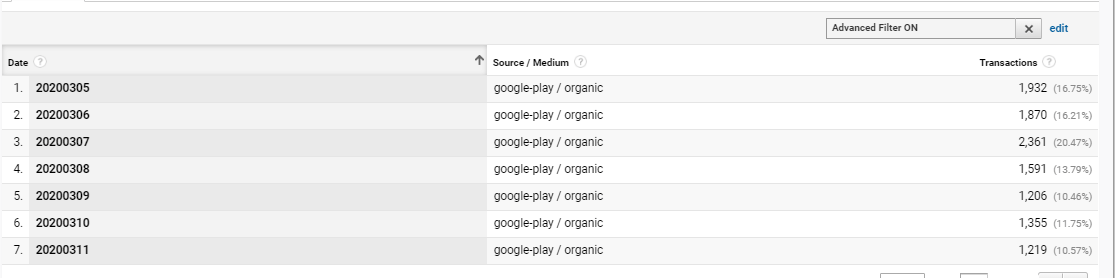
*When you use the same data set in Data Studio dashboard, it gives you bifurcation of the source/medium and trend of the transactions through them which is visible and easy to understand.
Publisher
For every Publisher, user engagement is the key to business success. A Segment(Engaged Users) is created with conditions of session count >= 5 or pageviews>= 30. In Google Analytics, custom reports of users & engaged users will look like this.
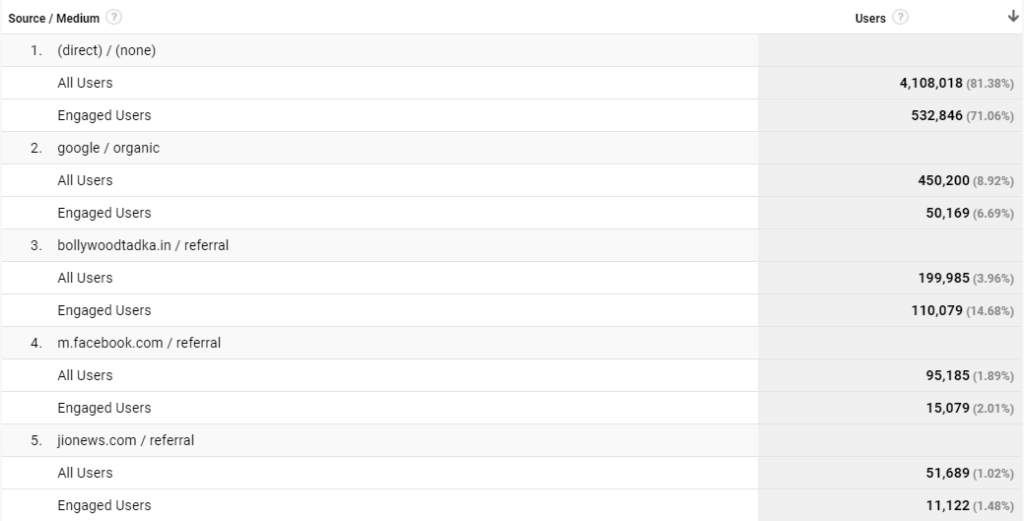
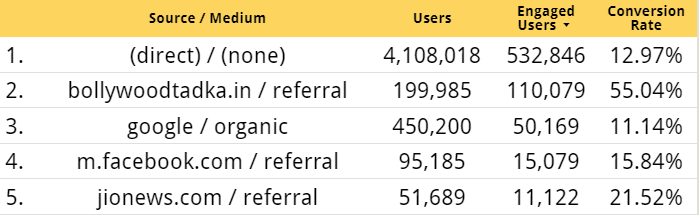
In the Data Studio, with little help of blend data, you can also get the conversion ratio for each source/medium along with its users & engaged users numbers. Further, daily, weekly or monthly trends can be identified and analyzed with help of Data Studio.
Behavior
For every OTT platform, it is necessary to understand the dates and time of the day during which the content is consumed the most and the trend in which this gets followed. In GA, even though we have all the fields in place, to have a clear understanding of those in the UI, it’s difficult to understand and requires a lot of processes.
OTT
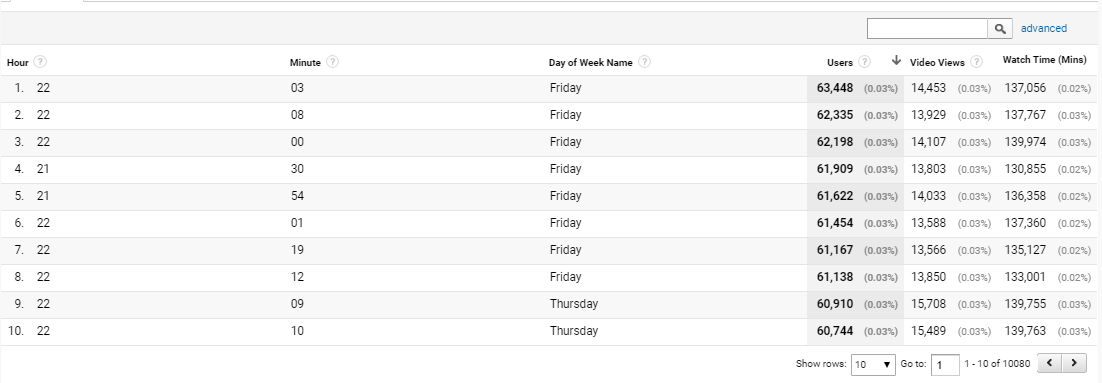
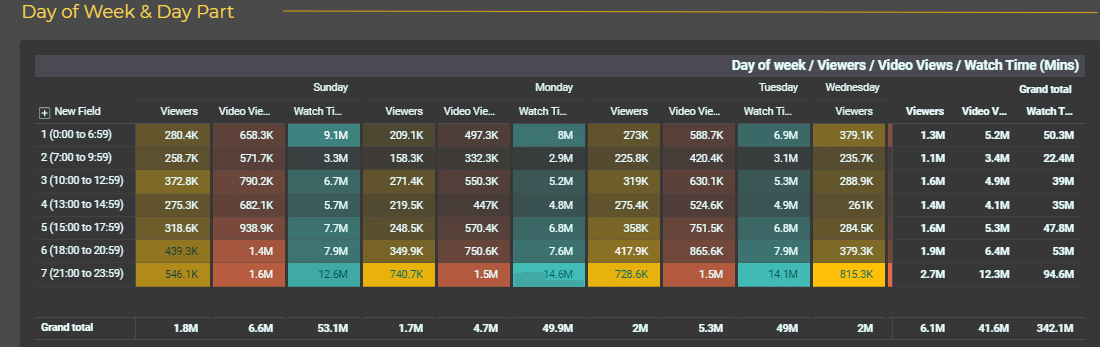
However, In Data Studio through Visualization we can have the data in the format mentioned below which will help to understand the data at a glance.
Publisher
In Google Analytics, you can easily get the reports of pages being read on your website or app.
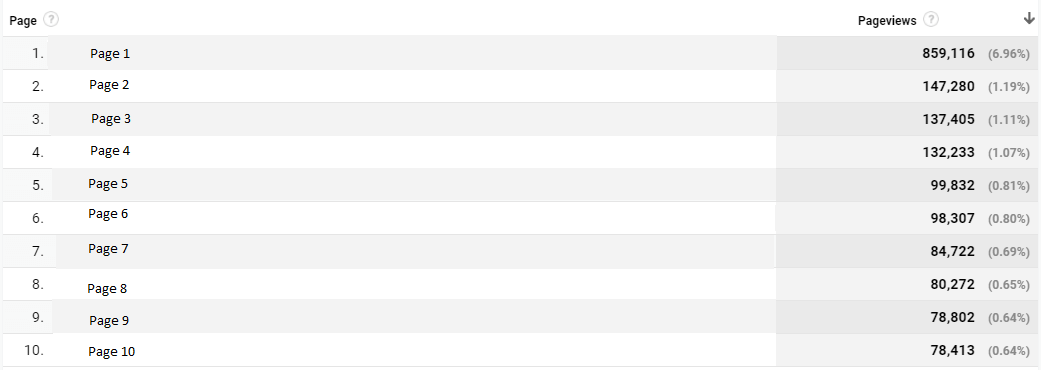
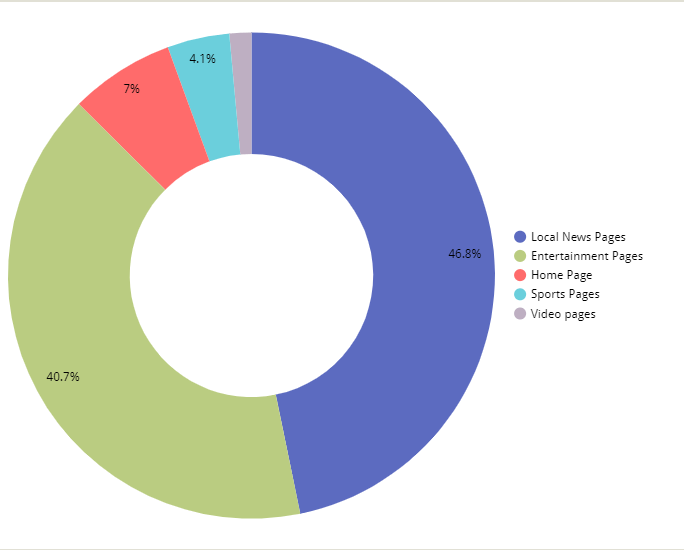
What you don’t get is the kind of content being consumed on your web or app by readers. Data Studio can help you categorize your content on your conditions. Here is an example of how you can categorize your content and visualize it. Various metrics can be combined with this visualization for better analysis.
Conversion
OTT / Publisher
Average Revenue Per User (ARPU)
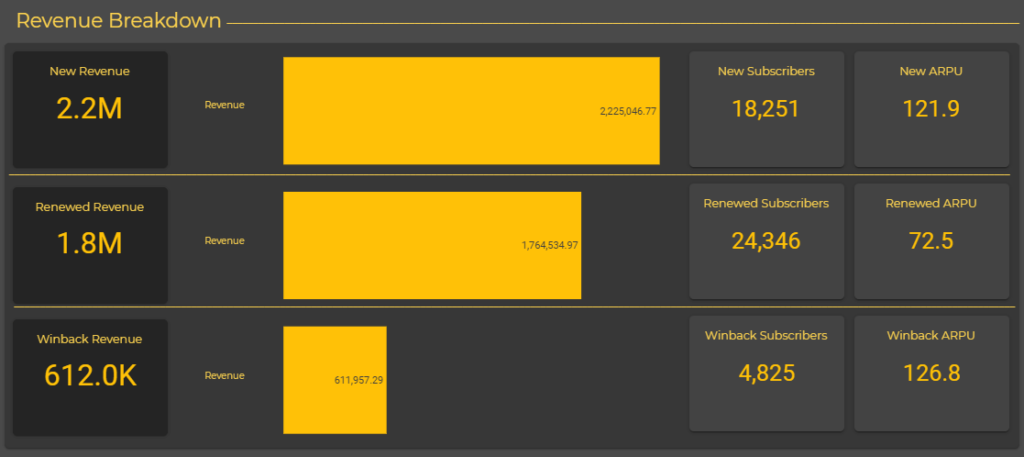
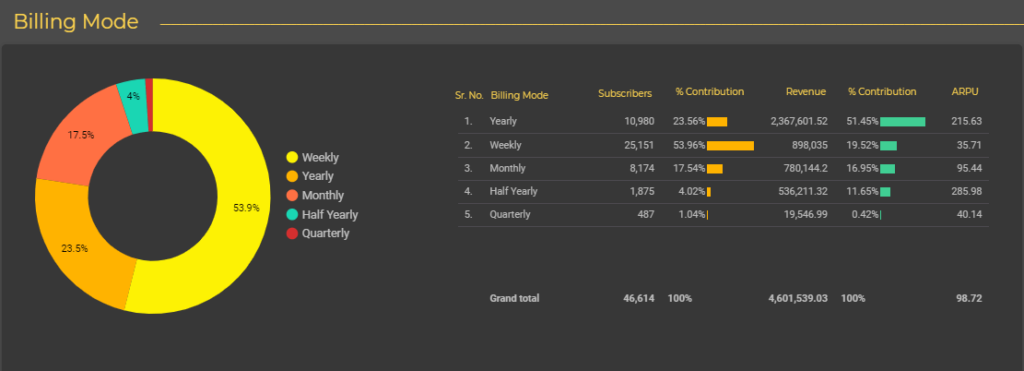
ARPU is a metric used majorly by digital media, and networking firms, defined as the total revenue divided by the number of subscribers.
Below mentioned are the Data Studio examples where we have blended the GA data with internal CRM data and calculated the ARPU. We now have a clear bifurcation of the subscribers and their ARPU. Also, an average of weekly, yearly and other date ranges.
Conclusion
With increasing use of Google’s Data Studio, it’s exciting to see adoption and contributions from different industries. It’s a win for digital marketers and agencies who’re used to creating reports and dashboards, the ease of use and the intuitive interface are attracting more industries and users who’ve never used a visualisation tool before.
As the community visualisation adoption grows, we’ll be writing more explainers on how to use Data Studio in different industries like eCommerce, Leadgen & BFSI companies, Travel booking, hospitality, among others. For any feedback, feel free to drop in your comments in the section below.
