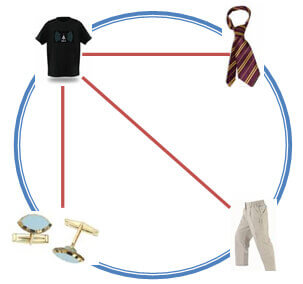
If you have an online store, then as an retailer you would certainly want to know how your product is performing online and the factors that are affecting its sale. And to know this, you need to collect data that provides in-depth information about buyer details and shopping behavior online. Further, it is also essential to identify the behavior of one product, compared to its counterpart. When you notice that few products in your store are performing better, then it becomes important to know whether these products were purchased together or were just complementary in nature. By carrying out Shopping Basket Analysis, this problem can be solved to a certain extent.
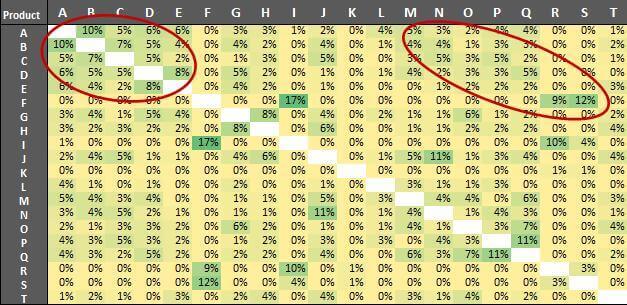
We carried out an analysis from a simple 2 by 2 chart comprising of top 20 highly sold products of clients involved in clothing business to learn how these products were related to each other. We used the transaction data of buyers to find the probability between two or more products purchased together by a buyer in a single transaction. We then put Tatvic Google Analytics Excel Plug-in into use and some pure excel functions to extract the relevant data.


Shopping Basket Analysis:
- In 10% transactions of product “A”, product “B” was also purchased.
- In 17% transactions of product “F”, product “I” was also purchased followed by 12% transactions having product “S”.
- In approximately 5% transactions of product “I”, products R and S were also purchased.
- In 11% transactions of product “P” product “Q” was also purchased.
- Red circles in the diagram show hot zones where maximum slot of transactions happen and should be our focus.
Shopping Basket Recommendation:
Above insights can be used to decide optimum promotion and pricing strategies like:
- Ensuring that products being purchased in combination are on same page side by side.
- Highlighting those products on top landing pages of site.
- Providing discount in form of shipping benefits to group of products giving higher average order value.
- Finding out single product transactions and tie those products to moving items at discounted rate.
There is a whitepaper “Product Purchase Pattern Analysis” which covers this article in comprehensive manner. You can also use our Product Recommendation Engine to provide more product recommendations in different ways to your customers to enhancing up sell and cross sell conversions. In case you wish to analyze data in excel you can download excel version of shopping basket analysis dashboard here.


