Internet connection speeds are on the rise globally. According to reports from Akamai, world’s leading cloud service provider, global average internet speed increased by 15% year on year to 7.2 Mbps1. South Korea continues to have the highest average internet speed 28.6Mbps, followed by Norway and Sweden. A major shift in internet ecosystem is also observed in Indian markets with 4G revolution recently.
We have observed a tremendous change in the way content delivery happens due to the availability of better internet speed. This has also paved a path for user interaction happening in a more in-depth manner than ever before.
According to studies1, the digital video audience is expected to grow at 8.2% in 2017. User experience has improved dramatically for the new age apps. The inherent restrictions caused by slow internet speeds is no more a roadblock. Businesses need to update their content (website/app) to match to the latest technology trends since the market has moved on from static websites to instant personalized content to users based on their past behavior.
With better infrastructure, fast internet and increasing user base, diverse markets like India have a huge potential for telecom companies. While making the changes, we also need to keep in mind that 40% of mobile internet subscribers are still using 2G network. Though the number of 2G internet users is declining in the country, we have to make sure content is accessible on 2G network as well.
To make the decisions based on users network types, it is imperative to track internet speed for every user we have.
Internet Speed Tracking solution developed by Tatvic team is pretty handy here.
It helps us understand the following:
- True download speed at specific time
- Network Type – 2G, 3G, 4G
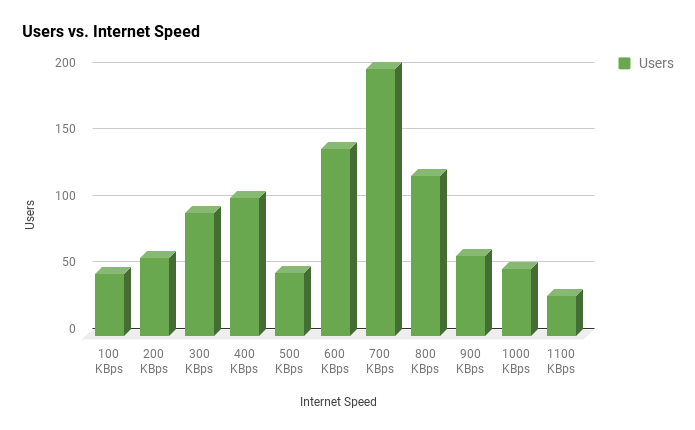
These reports will be available in Google Analytics for every individual user along with acquisition and behavior data. One can create reports like Correlation between Internet connection speeds and content consumption rates by geography, network type across time.
Use Cases:
Content Optimization:
If we observe that most of the users (let’s say more than 60%) are coming from 4G network, we can focus on better designs, adding animations to improve user experience. To increase the user engagement, we can also consider adding more video content as well. But on the other hand, if more users are from slower connections like 2G, the focus would naturally be on content optimization. Less content and fewer user interactions would be key to drive more conversions in such a scenario. In such cases, it’s better to store content on users devices and thus achieve faster content delivery, for which, Progressive Web Apps is the perfect solution.
Personalization:
In today’s dynamic world, ‘one size fits all’ doesn’t work anymore. We cannot have same strategy/design for both slow connection and fast connection users. Personalization tools enable us to serve different user experience to different segments. In above analysis, if we are having users coming from different network types and correlation in conversion rates and app designs by network type is higher, we should consider personalizing content by network type.
What’s Next:
If you are looking to personalize user experience based on network type being used, Google Optimize can be helpful. Its one of the best tools for running AB tests and personalization solutions. It natively integrates with Analytics. So we can use integrations with other Google products like AdWords, BigQuery, DoubleClick For Publishers, etc. to deeply analyze the metrics. Tatvic has posted an informative webinar on Personalization using Google Optimize.
We hope the blog was insightful for you and helped you in understanding the benefits, as well as the use cases of tracking internet speed and network types for your website/app. If you have any doubts or are looking for clarifications, please drop in comments and we shall be sure to get back to you.


