To understand how to enhance A/B testing reports with Google Analytics, let’s briefly cover what A/B testing is and how Google Optimize will help us in A/B Testing.
Define AB Testing:
A/B Testing, also known as split testing, is an experiment for comparing two or more versions of web pages or apps to understand which version is performing better. A/B testing is a method where two or more variants of a page or screen are shown to users on the basis of Audience definitions. Once the test is sent, statistical analysis determines which variant is performing better for a conversion goal defined.
A/B testing will help us enable the data-backed decision for testing the website optimization and shifting the business decision from “This might help us achieve the goal” to “This will help us achieve our goal”
So the major question now is, how do we proceed with A/B testing? There are various tools that help us with A/B Testing. This article focuses on one such tool called Google Optimize.
We will cover:
- Brief on Google Optimize
- How we enhance A/B testing and reporting with Google Optimize and Google Analytics linking.
How will Google Optimize help us in A/B Testing
Google Optimize is an online A/B Testing tool that enables us to run experiments with various approaches to delivering content. Optimize allows us to
- Test variants of web pages and see how they perform against a specific objective
- Monitor the results of your experiment and identify the leading variant
- Work on conversion rate optimization.
There are four types of tests or experiments that can be performed in Google Optimize:
- A/B Testing
- Multivariate Test
- Redirect Test
- Personalization
1) A/B Testing
A/B testing is a randomized experiment using two or more variants of the same web page or app screen (Variant A and Variant B). Variant A is the original page and Variant B contains at least one variant that is modified from the original web page or screen.
2) Multivariate Testing
The test helps you understand the interactions between multiple sections of a page by testing them together in a coordinated way.
In multivariate tests, testing is done for two or more variant elements simultaneously to see which combination creates the best outcome. It identifies the most effective variant of each element as well as analyzes the interactions between those elements.
3) Redirect Test
The test allows you to test separate web pages against each other. In redirect tests, variants are identified by URL or path instead of an element(s) on the page. It is useful when you want to test two very different landing pages or a complete redesign of the page.
4) Personalization Test
It includes a set of changes made to your website for a specific group of visitors. Unlike experiments, personalizations can run forever and don’t have variants. They’re a single set of changes served to anyone who meets the targeting conditions.
Once we have found a leader in an experiment, we can deploy it to all of your visitors permanently, or use Optimize’s powerful targeting capabilities to tailor your website to a specific group of visitors.
How to read Optimize Reports?
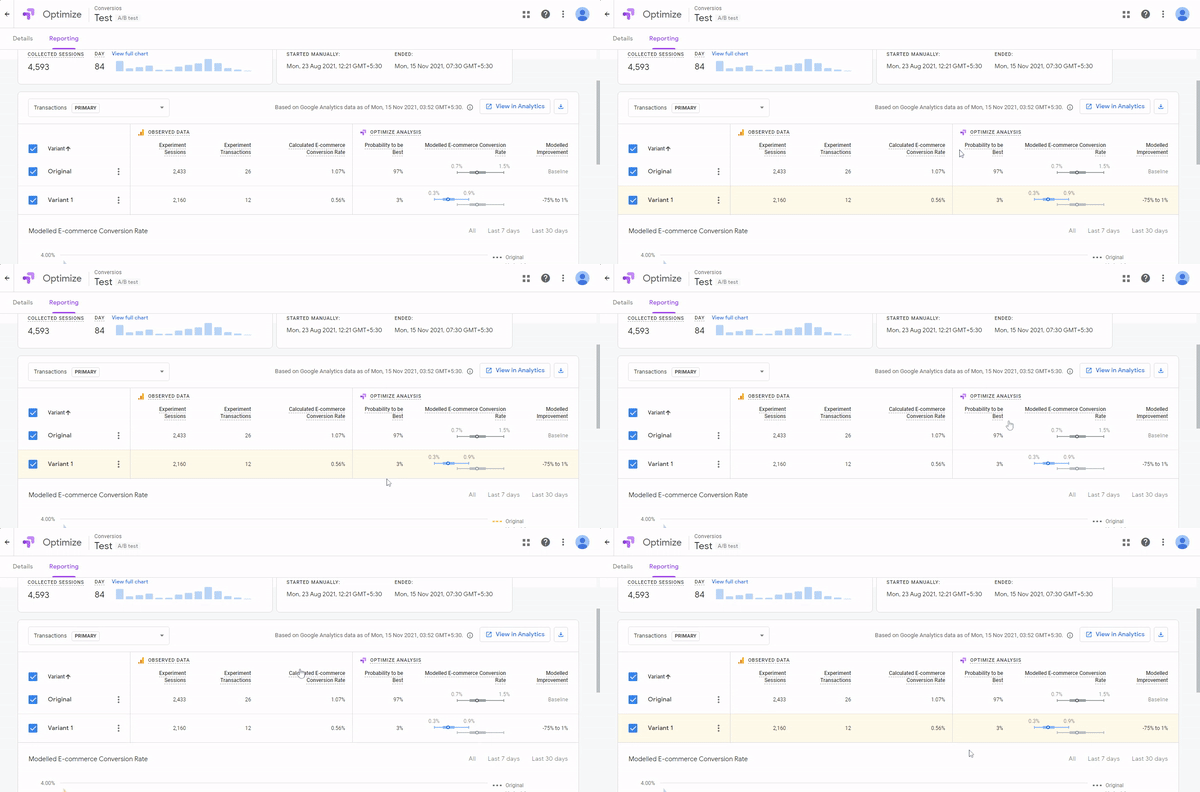
With the Optimize interface, we can read reports of Conversion Rate (CVR) for both the original and variant versions with regard to each goal set. This particular data set is linked to Google Analytics.
Optimize Analysis Interface helps us with the probability of each variant to be best and decide the probability of variants to win
Let us proceed on understanding how we can enhance our A/B testing with Google Analytics (GA)
Use of Google Analytics Audiences for Google Optimize Experiments:
Google Optimize has the capability to target audiences based on Device category, User behavior, Geography, technology, and such. Then why should we use Google Analytics Audiences if we already have so many targeting options in Google Optimize?
Let us take a use case to understand this better.
If we are targeting audiences directly from the Google Optimize interface, it will be based on the next actionable step taken by the users. For instance, if we are targeting web users from the Ahmedabad city location, Google Optimize will target the audiences based only on the current location (Ahmedabad) and will not consider the past location.
What if the users were in Ahmedabad in the past 30 days but their current location is now Mumbai? In such cases, Google Optimize will not show the experiment to such users.
With Google Analytics Audiences, we can target audiences on the basis of past behavior with a 30 to 90 days lookback window. For instance, creating an audience for users who were in Ahmedabad in the past 30 days and then targeting them will serve the requirement.
How to analyze Google Optimize experiments with Google Analytics Data?
Optimizing reporting is fine but what if I want to analyze some more metrics for any micro business KPI?
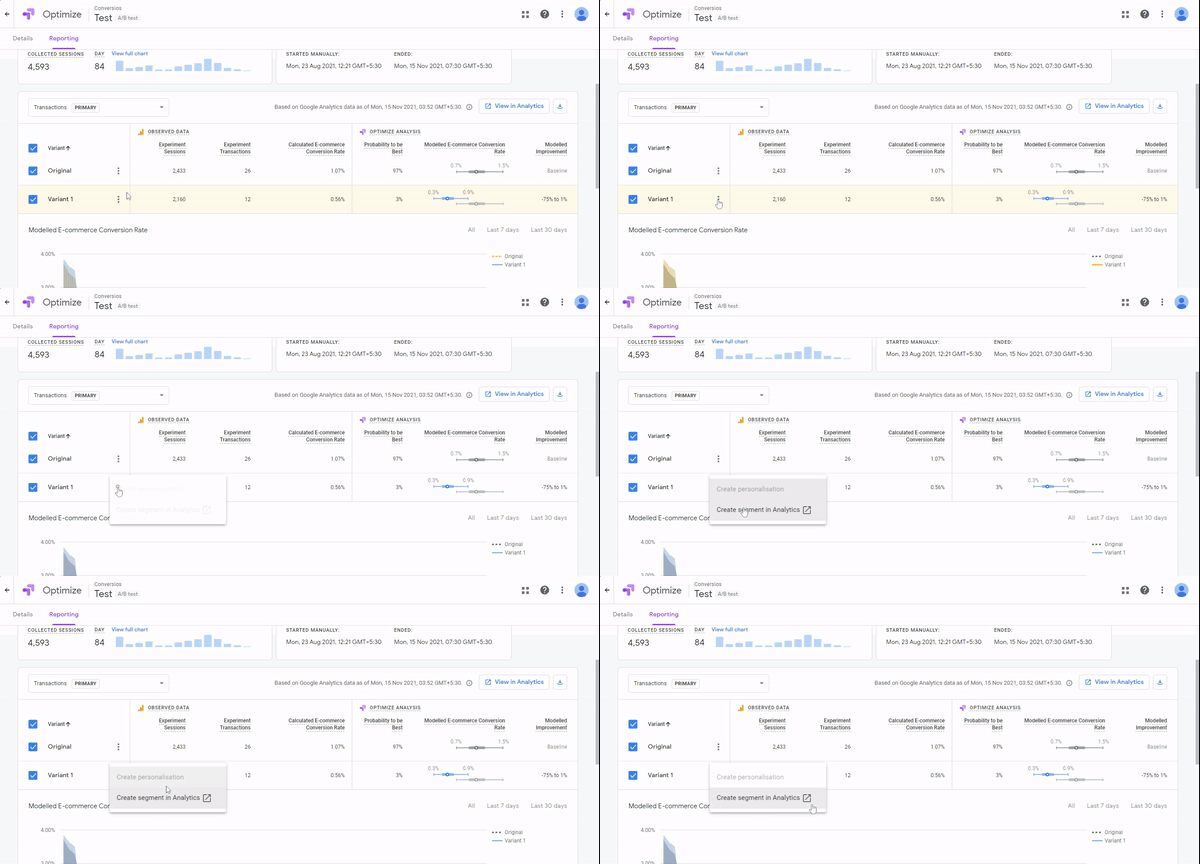
Optimize provides us with an opportunity to analyze each variant’s data on GA. All you need to do is create a segment from the Optimize interface and use it in GA.
Once the segment is imported in GA, it can be used on all reports as per requirement, like user journey, interactions/clicks, pages, source/medium, etc.
As an alternative, Google Analytics also has some session-scoped dimensions for optimizing tests which can be used for creating segment or custom reports.
- Experiment Name – User-generated name entered during experiment creation. e.g. “My Optimize Experiment”.
- Experiment ID – A unique ID is available in the information panel on the Optimize experiment details page. E.g. IzxbYxEfTeuq3bQqIAHB9g
- Experiment ID with Variant – The Experiment ID with the Variant ID appended to it. Available in the information panel on the Optimize experiment details page. e.g. IzxbYxEfTeuq3bQqIAHB9g:1
Let’s take an example to understand what Google Analytics is capable of when it comes to analyzing user journeys for any eCommerce transaction or specific conversion event.
For eCommerce conversion, finding drop-offs is quite easy with just an application of experiment segments on funnel reports. But what if you want to measure the conversions and drop-offs from a sticky CTA (that you have placed on the home page as your A/B test), how do we do that?
Let’s see how we do that.
Create a custom funnel with steps as per the journey and then apply the segment of experiment id with variant or Create sequential segments and apply them on the reports or charts.
When we talk about all tests, we see their reports on Optimize Interface and GA both. But with the Personalization test, optimization reports show no reports. So then how do we measure the impact of personalization tests? Google Analytics again!
Just use the audience that you have imported in Optimize as a segment in Google Analytics and analyze various reports’ basis hypotheses. All we need to do is replicate the conditions of tests in GA and we have the data with us.
Signing off…
We hope this clears up a few of your queries on how to enhance and analyze Google Optimize experiment reports from Google Analytics UI as well as Google Optimize UI. We have additional useful information if you need to deep dive further, Tatvic’ has a Solution from Google Marketing Platform for Google Optimize 360. You may also comment and send queries.

