Of late we are working a lot on predictive modeling for e-commerce data and implementing interesting ideas using GA. Lot of our analysis leads to one conclusion that the lower end of the funnel is almost always presents lot of opportunities for improvement.
One of the other interesting problems that we encountered was to connect with the product manager who is interesting in optimizing the inventory and making sure that he learns usage patterns at a lower end of the funnel for different product. To tackle this interesting challenge, we had to get lot of data for products SKUs & have user action as metadata for these SKUs.
Data collection
We added following four interesting user actions on product page of an e-commerce stores, with the purpose to get a uniform metadata around product. The way we used the Event tracking here was
_trackevent(category, action, opt_label, opt_value,opt_nointeraction)
nomenclature : _trackevent(pp-product view, gender,product code+brand,price,true)
which can be converted into sample code that can potentially look like this ;
_gaq.push([‘_trackEvent’,’pp – product view’,’women’,’abc12332423’,’1999’,true])
- Product view
- Add to Cart
- Feature selection
- Wishlist addition
This can easily become a standard to use when user adds product to cart, or selects a color or adds a product to wishlist.
This way we extracted metadata of products along with additional metrics for the product to help product manager gauge what’s going on with the lower end of the funnel, which typically comprises of cart & check out pages.
If you have done several e-commerce implementations you can clearly realize that this method can provide very effective metadata for each product, in form of categorical variables like ,which gender it is aimed towards, brand & action occurring on this product (i.e. view, add to cart, feature selection, wishlist addition). The other additional ordinal variable data that is possible to beget is time spent on product , views, unique views, etc.
We also added similar type of event tracking implementation on cart page, which effectively also helped us provide product metadata
_trackevent(cp-product removed, gender, product code + size+brand,product proce,true)
That eventually translates into values like below:
_gaq.push([‘_trackEvent’,’cp – product removed’,’men’,’xyz10234’,’1500’,true])
At the end of this implementation you would stand gaining such a beautiful set of data that you can do wonders with. Click on the image below to see the larger version of data yourself.

Above data clearly will help to establish a relationship of each individual products revenue with its # of instances of cart addition, # of instances of removal, # of instances of view as well.
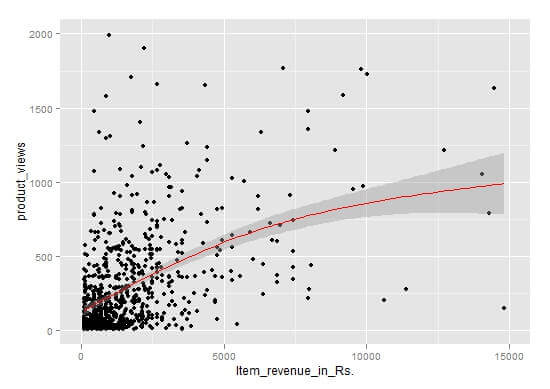
Using this dataset, we can create a visual representation of how the relationship between product views & product revenue exists as below, thanks to ggplot2 & R
All the products which falls in the area of above the curve, ie. High product views but low on revenue, needs work to be done. For such products a different strategy may be required, may be a specific campaign or a discount or something, but these are those products which are getting viewed but not bought.
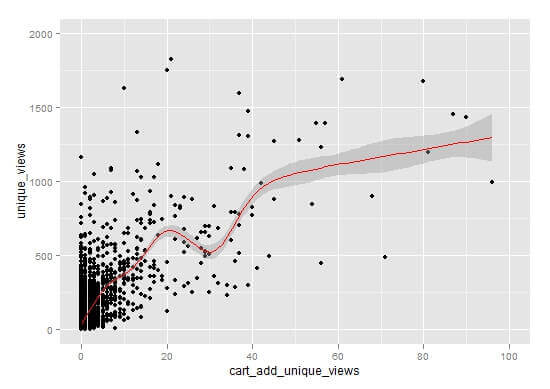
Additional research can also be done to check what the relationship with product views is & cart add like below:
Dots in above chart represents # of people viewed the product vs. # of people added it to cart. Clearly, there are products which people are not adding to cart and require further research as to whether it is due to price, or shipping or competitive pressure that people are not considering to add this product to cart.
In the next post, I’d describe a linear relationship model that is able to predict the quantity of product sold based on factors such as views, alerts set, wishlists etc.


