
The amount of data collected and processed daily is rising exponentially. You have data for various digital frontiers such as user interactions, business performance, sales and revenue, internal operations, inbound and outbound logistics, finances, marketing activities, and more. Making sense of this data is important for your business to sustain and grow. Especially, if you are a digital business owner, you cannot afford to miss out on relevant patterns and trends in this data.
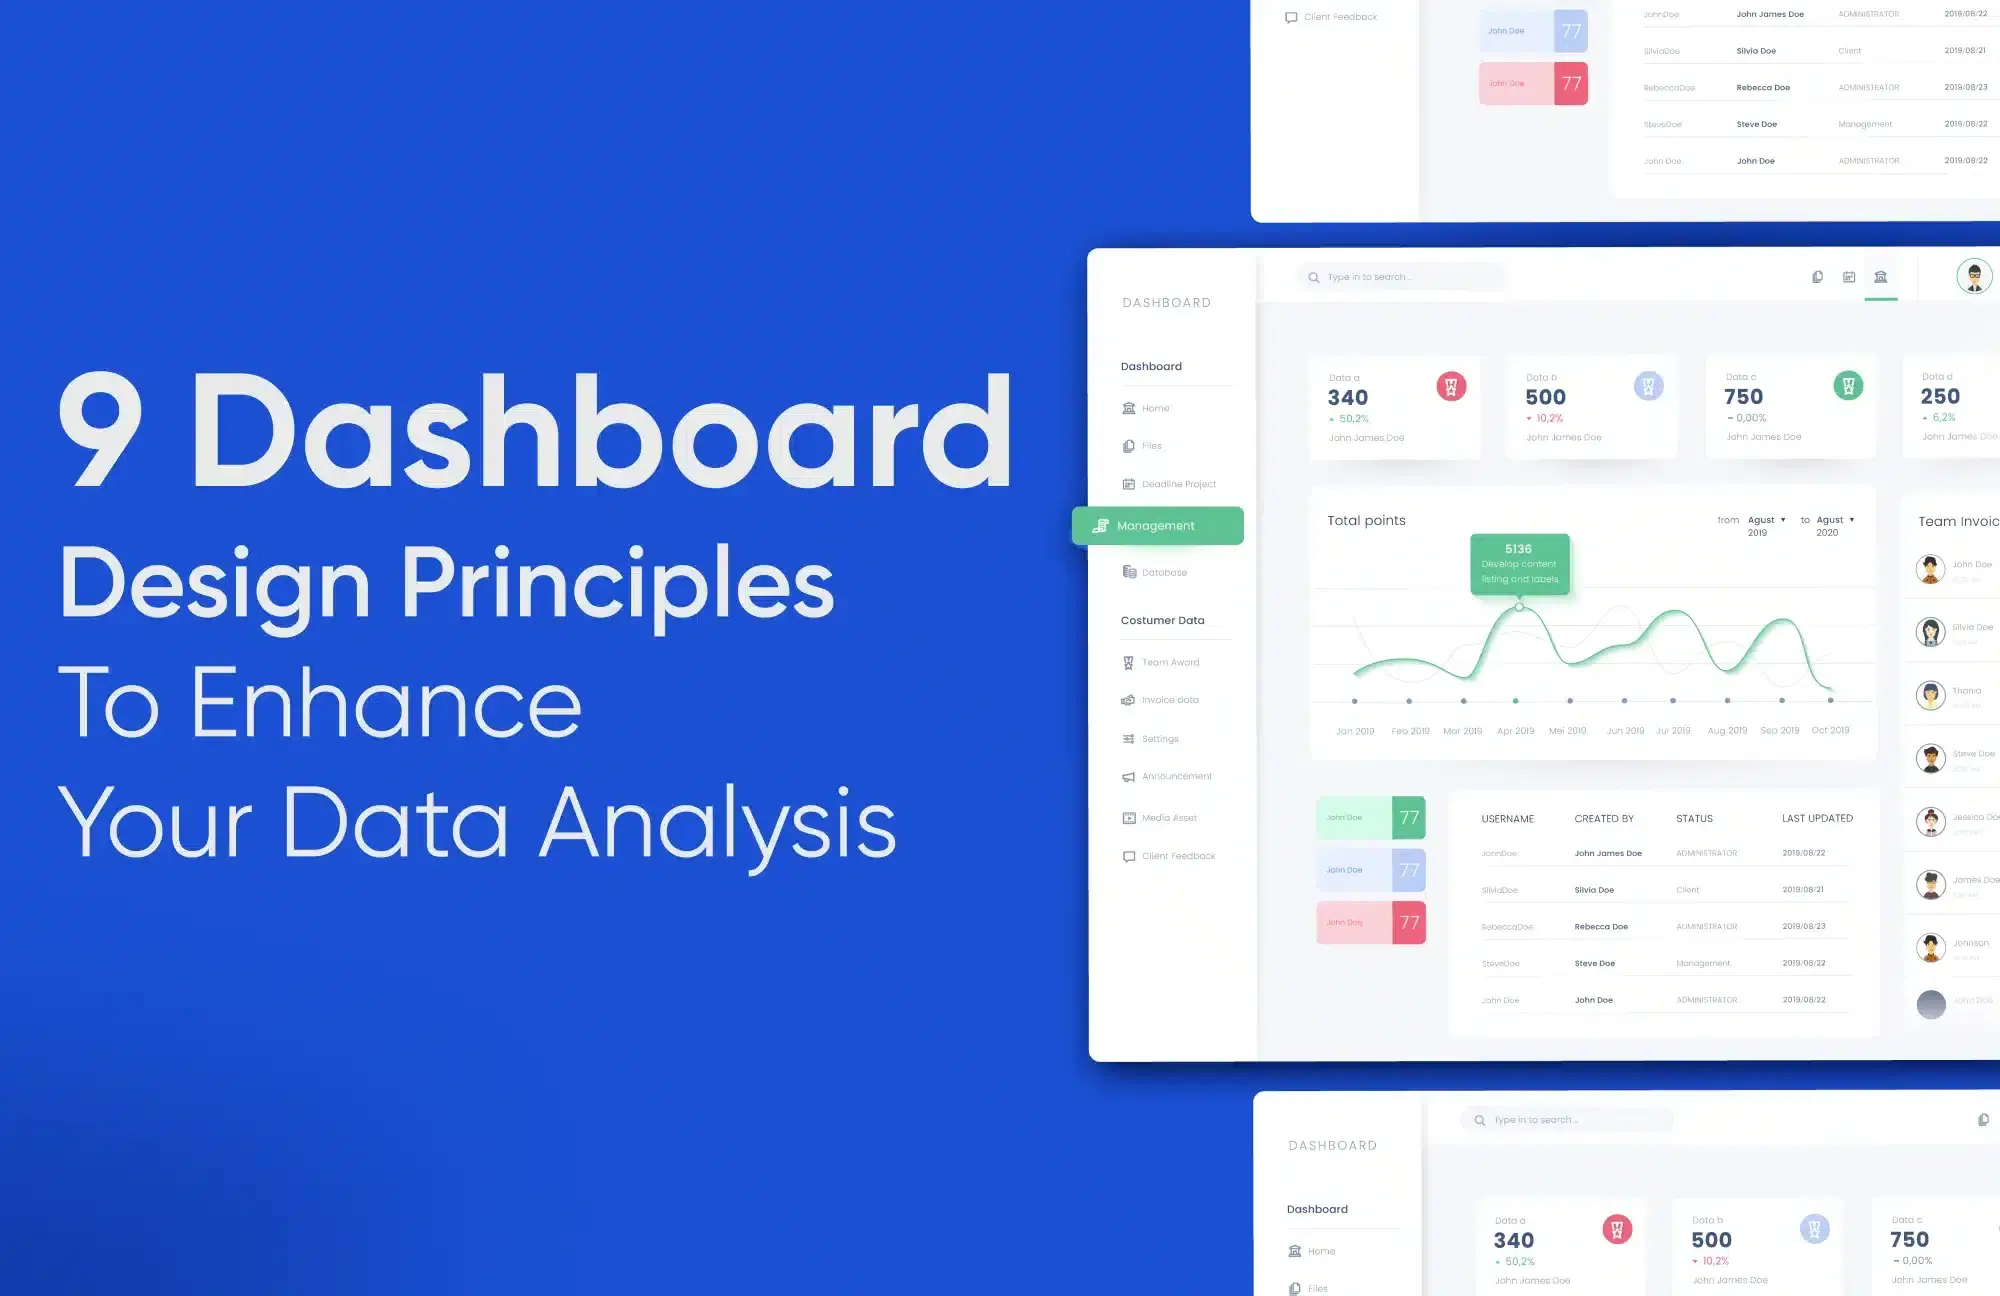
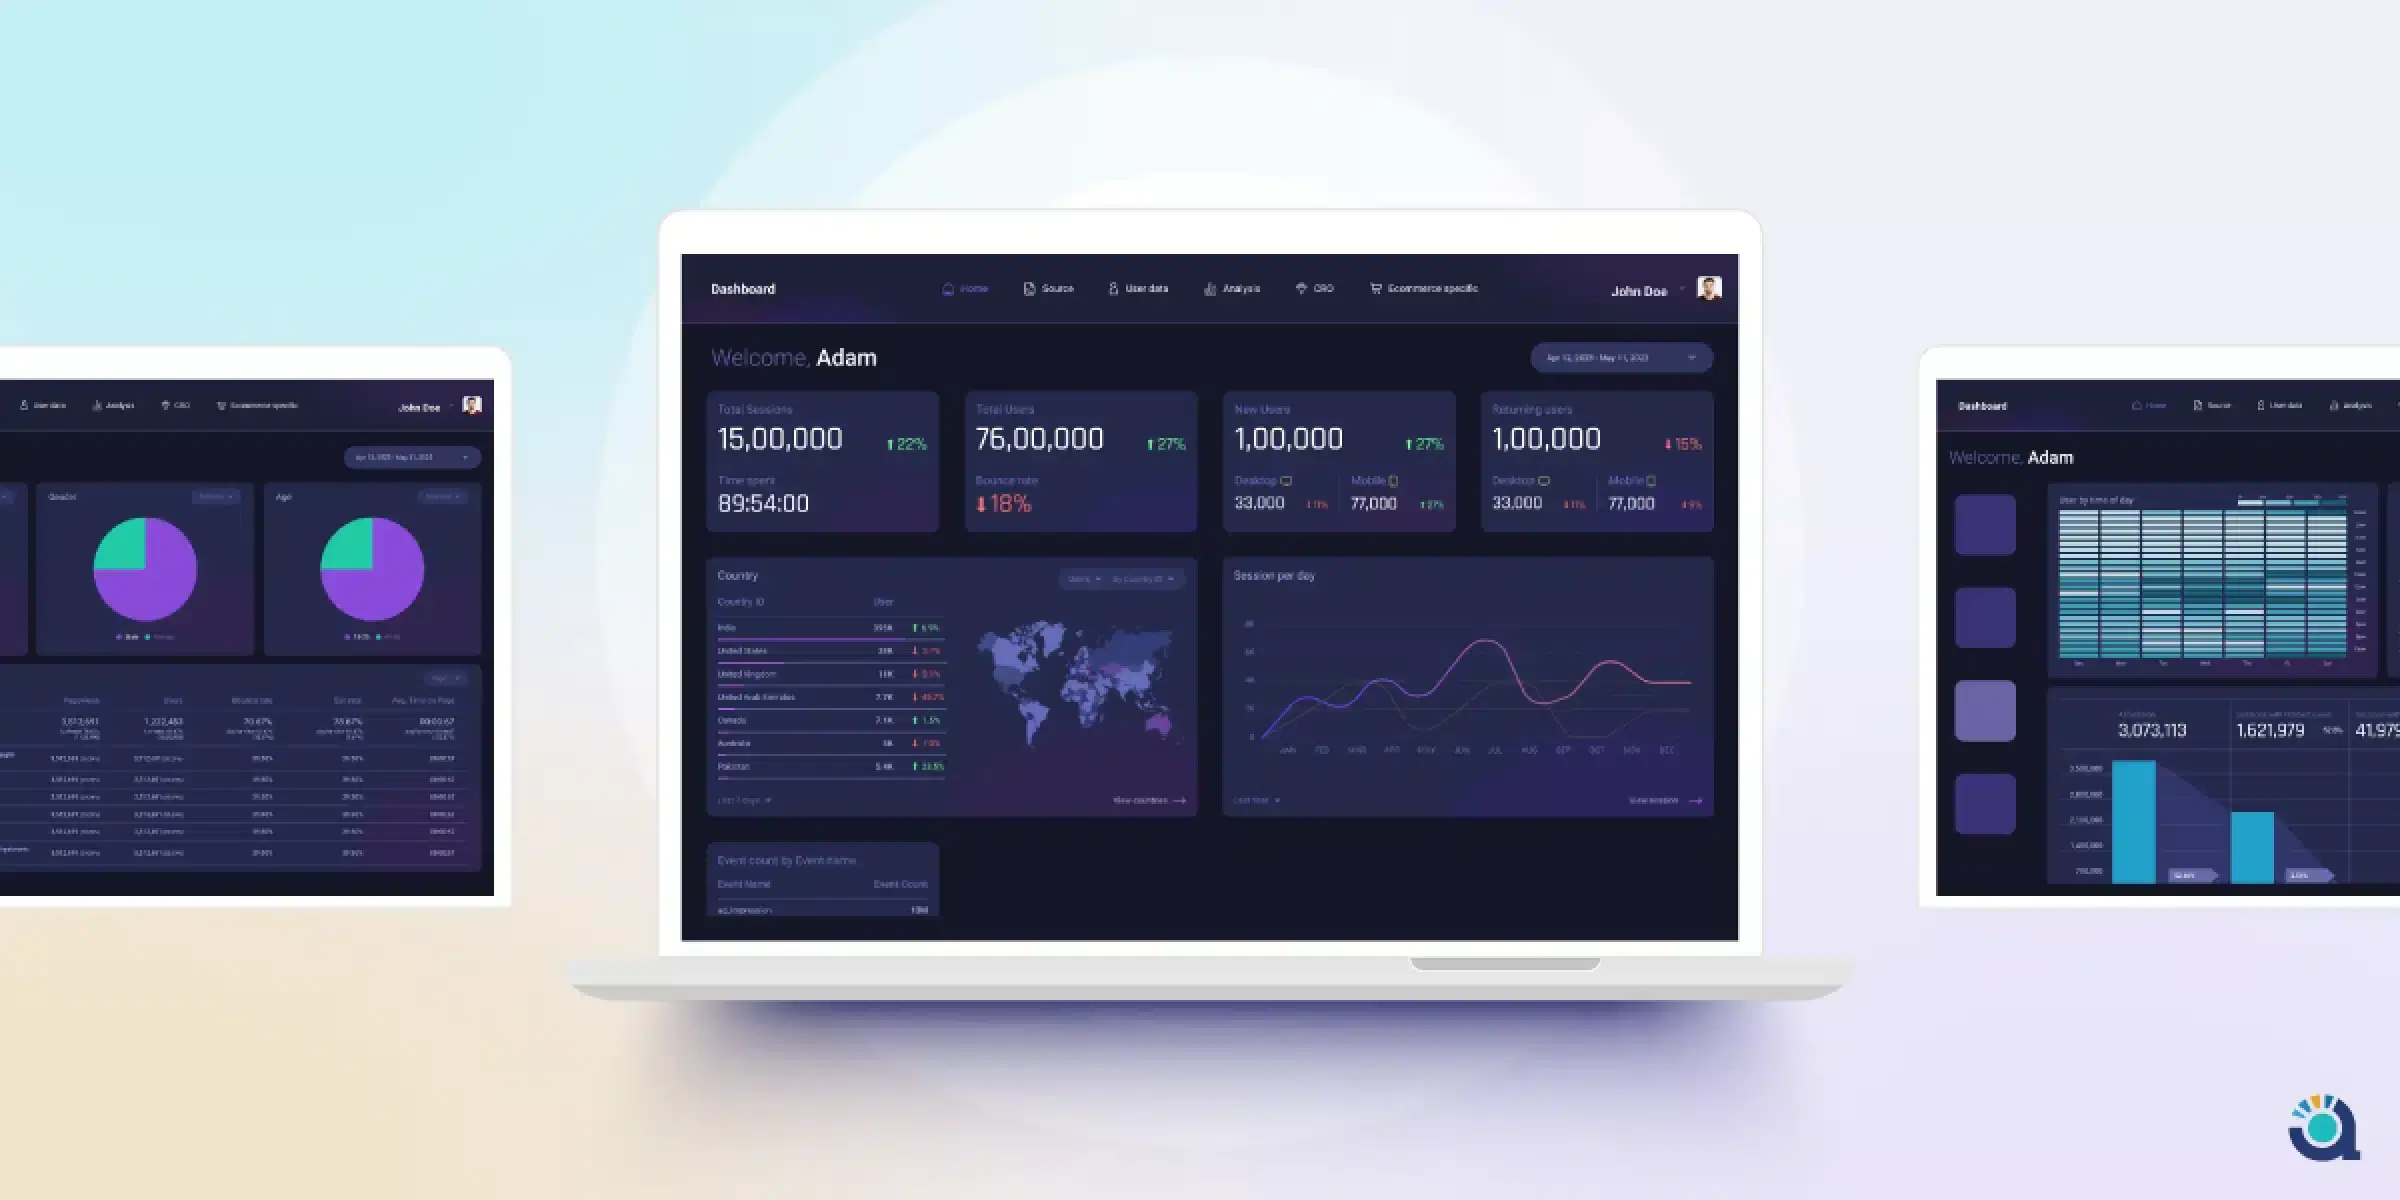
Dashboards are great for visualizing data points when you have a plethora of data and don’t know where to exactly start. Data analysis will only make sense when you visualize what is being told by the data. The narrative of the data points cannot be evident by looking at them discreetly in your analytics software or spreadsheets. Moreover, complex correlations and causations are of great importance for businesses to make decisions.
“Identifying patterns and effective data consumption is also necessary for businesses to forecast growth. After all, your data can either make or break your business.”
Whether you’re a data analyst, a business owner, or a CRO Specialist, a well-crafted data analytics dashboard will help you transform your data into actionable insights. It would serve as a compass in the ocean of data. But, like any spellbinding craft, designing a remarkable dashboard requires careful planning, a deep understanding of your audience, and a dash of creativity.
You might have seen a lot of business dashboards with multiple purposes. The catch is designing a dashboard that can answer your or your stakeholders’ questions rather than just randomly thrown charts and figures. The OG dashboards are clear, intuitive, and user-friendly.
Here are my 10 pointers to develop the best dashboard design for your websites or app data that not only answer business questions but also tells effective stories.
1. Define the target audience of your dashboard and all the involved stakeholders –

Before you start scribbling on the paper, it is necessary to take a moment and think about who will be using your dashboard. Identify the involved stakeholders and note down the kind of questions for which they would want answers. Understanding your audience’s needs and goals is fundamental for dashboard creation. It should not be the case that you design something and nobody wants it.
The game of data is delicate and working efficiently with it is quite necessary. Pinpointing the correct target audience will help you decide the exact metrics to use for data representation and will help you avoid misrepresentation.
You can start by jotting down all the people who would use the dashboard against all the inferences they would require as per their role. For instance, a C-suite executive might be more interested in knowing the business metrics like Revenue Generated, Sales Growth, and other financials. Whereas for a marketing manager, the performance of marketing campaigns, ROAS, and ROI on marketing spending would be of primary concern. On the other hand, the Project Managers would like to understand the status and goals of projects.
Your to-do list for this section is as follows:
- Identify all potential dashboard users, including executives, managers, and team leads.
- Clearly define the roles, responsibilities, and goals of each stakeholder.
- Conduct interviews to gather insights into stakeholders’ expectations and questions for the dashboard.
- Prioritize and align information needs with stakeholder roles, focusing on critical metrics.
- Develop user personas for visualization of preferences and specific data interests.
2. Set your narrative before you get to design the dashboard –
One dashboard might not answer everything and that is alright!
However, you need to create stories that you want to narrate to each of the segments in your target audience through your dashboard. Establish this narrative before beginning to design the dashboard. Set specific Key Performance Indicators (KPIs) that will generate value for your dashboard users and will help you set the narrative.
Your dashboard should not be a generic data dump with random facts and figures with no alignment with the business story whatsoever. This is where you finetune the questions that you had written down for each segment of the audience.
Let us assume that you are creating an executive-level dashboard for upper management. You might want to answer these questions through your dashboard:
- What is the revenue for this quarter? What is the QoQ, and YoY growth?
- What are the top-selling products and/or services?
- Which product/service categories are performing well and which need attention?
- What is the Customer Lifetime Value (CLTV)?
- What is the Retention Rate of the website? What is the Recurring Revenue?
- Which products/services/categories are bringing the highest recurring revenue?
… and many more.
Write down all the relevant metrics for the same and the chart types that might suit the best to your narrative.
Your to-do list for this section is as follows:
- Establish the narrative for your dashboard before starting the design.
- Fine-tune questions for each audience segment, aligning with business objectives.
- Identify specific Key Performance Indicators (KPIs) to drive value for users.
- Avoid creating a generic data dump; ensure alignment with the established narrative.
- Define relevant metrics and choose suitable chart types for visualization.
- Focus on executive-level metrics for upper management dashboards.
- Continuously review and refine the narrative, KPIs, and selected metrics.
- Confirm that insights generated are actionable for informed decision-making.
3. It should tell a story and the narrative should not break –
It is important for any story that the narrative does not break. As mentioned multiple times earlier, you might digress from the story while designing your dashboard. This may lead you to overload the dashboard with everything possible as you might not want to miss out on anything. This may not be a good thing as you may lose out on the true essence of the dashboard. Conclusively, try to stick to your narrative. There might be changes later on but building an MVP (Minimum Viable Plot) of the story is necessary.
Secondly, you will deal with the data points a lot throughout the dashboard development process but your end users will not be as familiar with it as you are. This might lead to a gap between what you are trying to communicate and what they understand. To prevent this, add context for each page on your dashboard and all the relevant graphs or data points. This will help the user understand what you are trying to say and what they are looking at. However, keep the context to a minimum. Remember that data visualization is at the heart of this process.
Your to-do list for this section is as follows:
- Maintain a cohesive narrative throughout the dashboard design.
- Focus on building a Minimum Viable Plot to avoid overload.
- Add context to pages, graphs, and data points for user understanding.
- Balance detail and simplicity in data visualization.
- Prioritize clear and meaningful visual representation.
- Continuously refine the dashboard in alignment with the narrative.
- Design for user-friendly communication with a diverse audience.
- Keep contextual information concise to prevent overwhelming users.
4. Use charts that make sense and don’t just fill up the page –

Clarity and conciseness are the most important factors for an effective dashboard. As discussed earlier, you cannot simply add visualizations for the sake of it. Choosing the correct metrics is very important but choosing the correct visualization is an art too.
There is a lot at stake and many things you will want to convey like the time series data, uplifts or downfalls of certain metrics, comparisons, numerical values, and a lot more.
Avoid using charts like pie charts that can distort data perception due to differences in area vs. length. Scientifically, length is perceived better during visual comparison than area. Select visualizations that best represent the information.
For instance, while designing a business dashboard, you might have the urge to add a pie chart showcasing the distribution of revenue sources along with the trendline and maybe a bar graph for comparison. However, you may use a hybrid chart with bar graphs and trendlines combined to save space and a more comprehensive view. Alternatively, you can just omit the pie chart, and the bar graph and the trendline should suffice.
Remember, the purpose of the dashboard is to not look pretty but to convey meaningful insights.
Your to-do list for this section is as follows:
- Prioritize clarity and conciseness in dashboard design.
- Avoid adding visualizations for the sake of it; choose metrics and visualizations thoughtfully.
- Select visualizations that best represent the information; avoid charts like pie charts that can distort data perception.
- Consider the purpose of each chart, whether it’s showcasing time series data, uplifts, comparisons, or numerical values.
- Choose visualizations that convey meaningful insights rather than focusing solely on aesthetics.
- For instance, in a business dashboard, opt for hybrid charts combining bar graphs and trendlines for a comprehensive view.
- Remember, the goal is not just to make the dashboard look pretty but to effectively convey insights.
5. Don’t dump everything on one page. Sectionize the whole dashboard and every section should have at least one takeaway –
Avoid clutter by breaking the dashboard into sections. You should create different pages for different clusters of data with each page talking about a specific KPI or a group of metrics. For instance, if you are creating a business performance dashboard, dedicate one page to marketing performance, one for revenue metrics and trends, and one for web performance metrics. This will give your dashboard a cleaner layout and the narration will be effective and concise for each of the pages. For page-wise sectionizing, you should make sure that each section provides only one takeaway. A single chart should not be used to portray different parts of the stories. If one chart depicts revenue trends for a specific product then the web performance metrics should not be a part of this chart.
Each page or section should have a clear purpose and at least one key takeaway. This segmentation helps users digest the data more effectively.
Your to-do list for this section is as follows:
- Avoid clutter by sectionizing the dashboard, and dedicating pages to specific KPIs or metric clusters.
- Create different pages for distinct data categories, like marketing performance, revenue metrics, and web performance.
- Ensure each section provides only one takeaway; avoid using a single chart for multiple parts of the story.
- Maintain a clear purpose for each page or section with at least one key takeaway.
- Sectionization enhances the dashboard’s layout and helps users digest data more effectively.
6. Keep in mind the Gestalt Principle –
Remember, people forget easily! No matter how engaging the content might be if it is not structured properly or grouped logically,
Add the point about short-term cognition.
Apply Gestalt Principles to your design, particularly the principle of short-term cognition. This principle states that people perceive and understand information more easily when it’s organized and structured logically. Maximize the data-pixel ratio and reduce cognitive load.- Avoid Clutter. Utilize proximity to group-related elements, ensure visual consistency with similarity, and create smooth, flowing designs with continuity. Leverage closure to form cohesive data representations and establish clear focal points for user attention. Maintain simplicity, balance, and alignment for a visually cohesive and intuitive dashboard. Regularly gather user feedback for ongoing refinement and optimization.
Prioritize data presentation over unnecessary embellishments. Minimize clutter, as cognitive overload can hinder understanding. Every visual element should contribute to data comprehension.
Your to-do list for this section is as follows:
- Apply Gestalt Principles, especially short-term cognition, for logical data organization.
- Maximize data-pixel ratio, reduce clutter, and maintain simplicity for improved comprehension.
- Use proximity, visual consistency, and closure to create cohesive data representations.
- Establish clear focal points and balance for an intuitive dashboard design.
- Prioritize data presentation over embellishments to minimize cognitive overload.
- Regularly gather user feedback for ongoing refinement and optimization.
7. Use colors sparingly and don’t obsess too much with design aesthetics –
Employ colors purposefully and sparingly. Colors should enhance data interpretation and not overwhelm the dashboard with design aesthetics. Ensure that color choices consider accessibility and do not hinder users with color blindness.
When designing your dashboard, prioritize clarity and functionality over ornate aesthetics. Colors should serve a purpose, aiding in data interpretation rather than distracting from it. Assign colors meaningfully, maintaining consistency throughout the dashboard for a cohesive visual experience. Opt for a limited color palette to prevent visual clutter, and ensure readability by testing color choices against backgrounds. Remember, the primary focus is on creating a user-friendly interface that facilitates effective data analysis and decision-making.
Your to-do list for this section is as follows:
- Employ colors purposefully and sparingly for enhanced data interpretation.
- Prioritize clarity and functionality over ornate aesthetics in dashboard design.
- Assign colors meaningfully, maintaining consistency for a cohesive visual experience.
- Opt for a limited color palette to prevent visual clutter and ensure readability.
- Test color choices against backgrounds for accessibility and readability.
- Focus on creating a user-friendly interface for effective data analysis and decision-making.
8. Your dashboard layout should be consistent on different devices or different viewports –
Ensure a smooth and accessible user experience by maintaining a consistent dashboard layout across various devices and viewports. A responsive design that adapts to different screen sizes and resolutions promotes usability and accommodates users with diverse accessibility needs. Consistency in layout enhances user familiarity, allowing individuals to effortlessly navigate the dashboard regardless of whether they are using a desktop, tablet, or mobile device. Prioritize responsiveness to create an inclusive experience for all users, considering different abilities and preferences.
Design the dashboard layout to be consistent across various devices and viewports. Users should have a similar experience whether accessing the dashboard on a desktop, tablet, or mobile device.
Your to-do list for this section is as follows:
- Ensure a smooth user experience by maintaining a consistent dashboard layout across devices.
- Prioritize responsiveness for usability and accessibility on diverse screen sizes.
- Enhance user familiarity with a consistent layout across desktop, tablet, and mobile devices.
- Create an inclusive experience considering different abilities and preferences.
- Design the dashboard for a similar user experience on various devices and viewports.
9. Design for accessibility- Color Blindness –
Go beyond color considerations and design your dashboard with a broader focus on accessibility. Provide alternative text for images, use descriptive link text, and ensure a logical and intuitive navigation flow. Pay attention to font size and readability, allowing users to adjust text as needed. Ensure interactive elements are accessible via keyboard navigation, and use ARIA (Accessible Rich Internet Applications) landmarks to aid screen readers. By incorporating a comprehensive accessibility approach, you create a dashboard that is usable and user-friendly for individuals with varying needs and abilities.
Ensure your dashboard is accessible to all users, including those with disabilities. Consider issues like color blindness and provide alternative text for images and charts to make the dashboard usable for all.
Your to-do list for this section is as follows:
- Design your dashboard with a broad focus on accessibility, going beyond color considerations.
- Provide alternative text for images, use descriptive link text, and ensure logical navigation.
- Pay attention to font size and readability, allowing users to adjust text as needed.
- Make interactive elements accessible via keyboard navigation.
- Use ARIA landmarks to aid screen readers for a user-friendly experience.
- Ensure your dashboard is accessible to all users, including those with disabilities like color blindness.
