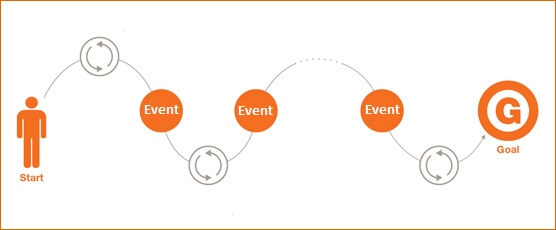
Are you facing difficulty to know the actual behavior sequence of your site users? Do you want to discover each user interaction in the same sequence as actually performed on your site by users while moving toward conversion? Do you want to know the most followed user patterns leading to conversion?
Standard Reports in Google Analytics don’t give user journey to conversion. Even with Google Premium Accounts, the user journey is possible to track through Custom funnels, though it has its own limitations of pre-defined funnel steps. So let me show you a different approach to get the comprehensive user journey.
We will be using the “Top Conversion Path” report with some advanced tracking approach. You may have come across the top conversion path report that provides you with information on how users have come to the site at different points in time from a variety of sources of acquisition. How about we use the same report to get you specific sequences of user actions leading to conversion? Using this report only, you can also get a user journey leading toward conversion.
Let’s see how it works:
Step 1: Google Analytics View & Filter
Create a new separate view with a filter ‘including’ only virtual page views. Virtual page view is a way to track dynamic content on the page.
Additionally, you will have to use the ‘exclude’ virtual page view filter in all other existing views of the same property or else you can maintain a separate property for this output.
Here is how you select an include filter.
Step 2: Datalayer Event Tracking
Let us figure out the events you need to track on your site. All these major events on the pages of the site are supposed to be tracked through datalayer events. If they are not been tracked, then it should be done first.
Step 3: Google Tag Manager
Now, create a virtual page view tag for each event on the page
-
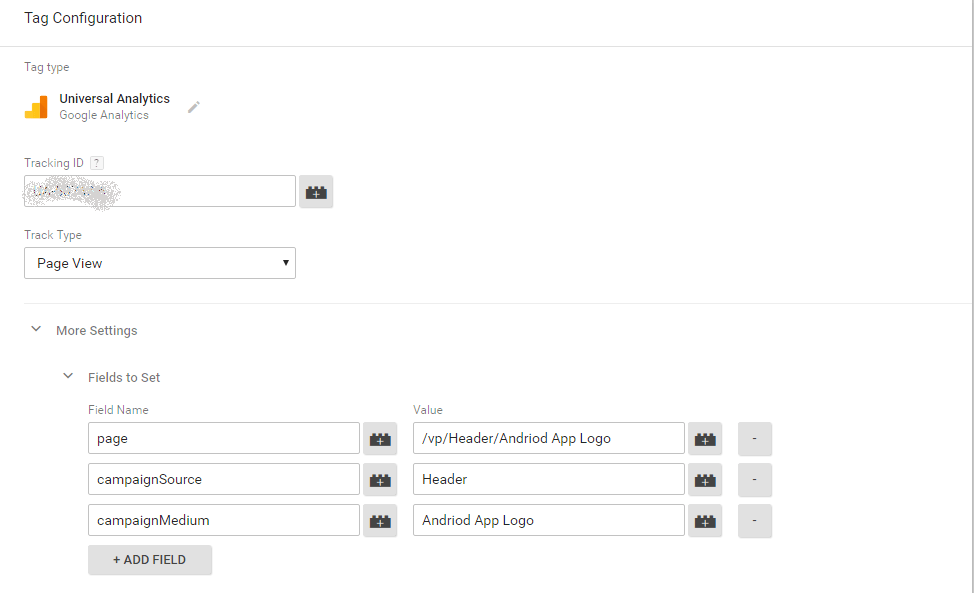
Select Page view track type in the tag configuration
-
Go to more settings, click on fields to set and pass the hardcoded values in three field pages, campaignSource, and campaignMedium.
-
Add a trigger to these tags as a datalayer event.
For clarity, we will pass the value of interaction/event name in the campaignMedium and location where that event takes place (like particular page section ) as campaignSource. For example, in the above image, we have passed campaignMediam as clicking on ‘Android App Logo’ and page section name ‘Header’ as campaignSource.
Step 4: Set up Goal in GA
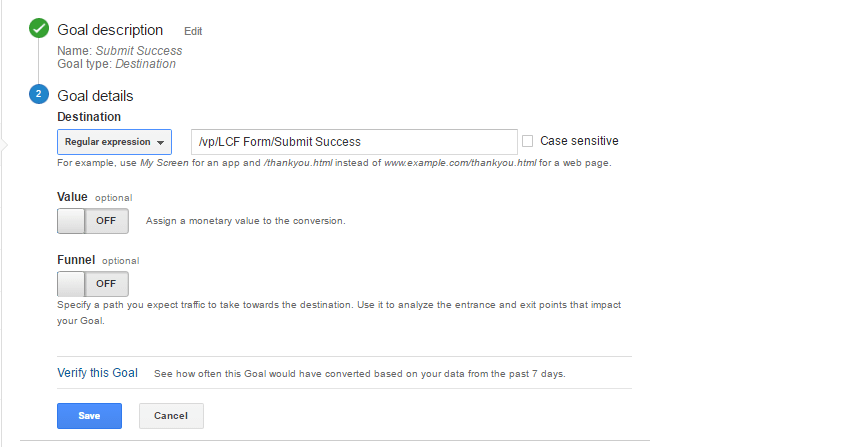
Create a destination goal in GA and use the virtual page URL of the goal conversion interaction (Submit Success is the goal conversion interaction – as in the below image).
Step 5: Data in Google Analytics Reports
After publishing the container, let’s wait for the data to get into GA.
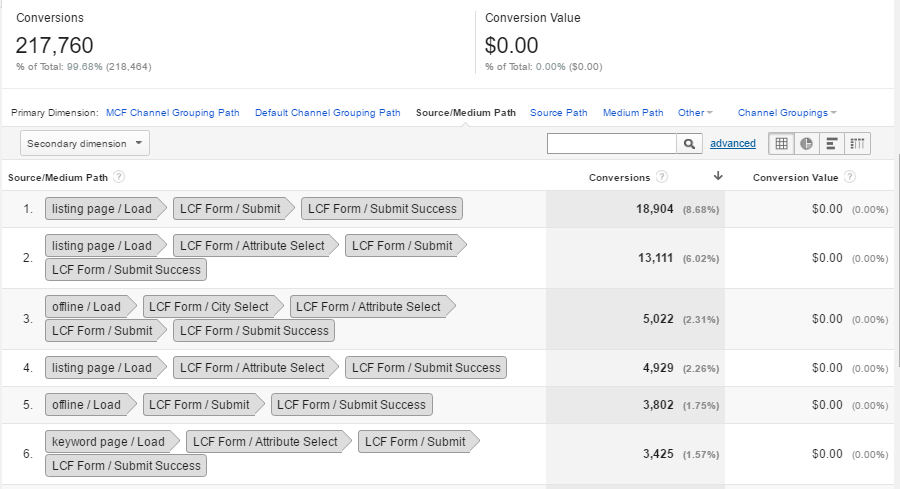
Below is the screenshot of how you will get data in the GA “Top Conversion Path” report
We have passed the hardcoded values of source/medium as page section/interaction name respectively and so we are now getting the patterns of user interactions which leads to conversion.
Here in the above screenshot “submit success” interaction is the goal and so it is the last source/medium path shown in each row.
Going through the rows of the report, we will get the top most user patterns leading to the goal. You might have observed that even though we have passed hardcoded values in the source, some of the rows show Google/CPC values. This is because in the processing stage of the GA if any user landed on the site through any Adwords campaign, at that time GA cannot overwrite the values of campaignSource and campaignMedium.
Note that this view should only be used to get insights from the Top Conversion Path report as changing the value of source/medium and sending it to GA at each interaction will create a new session on each event.
If you are interested in further details on how we do it or you want us to track your user journey, our experts will be glad to assist you. Please drop a comment with your details in the section below & we will reach out to you!!


